. 2019 Mar 20;9(1):4922.
doi: 10.1038/s41598-019-41196-z.

Uncertainty and hotspots in 21st century projections of agricultural drought from CMIP5 models

Affiliations

Uncertainty and hotspots in 21st century projections of agricultural drought from CMIP5 models

Junyu Lu et al. Sci Rep. .

Abstract

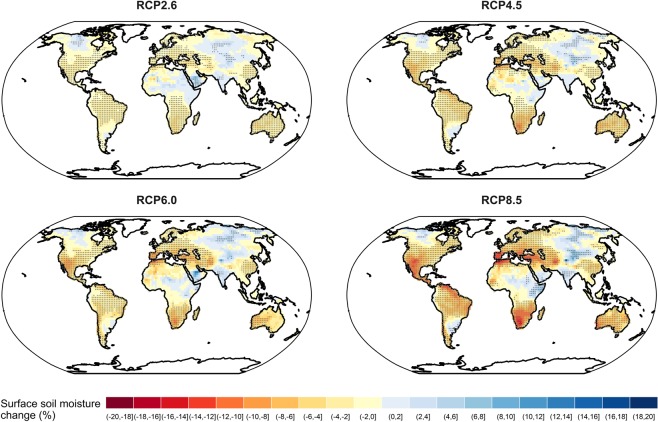
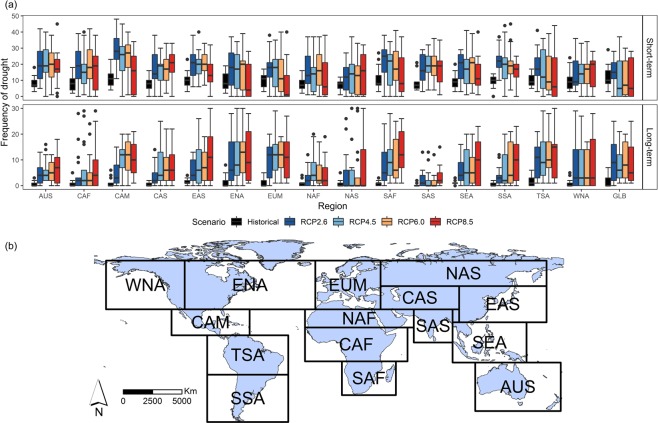
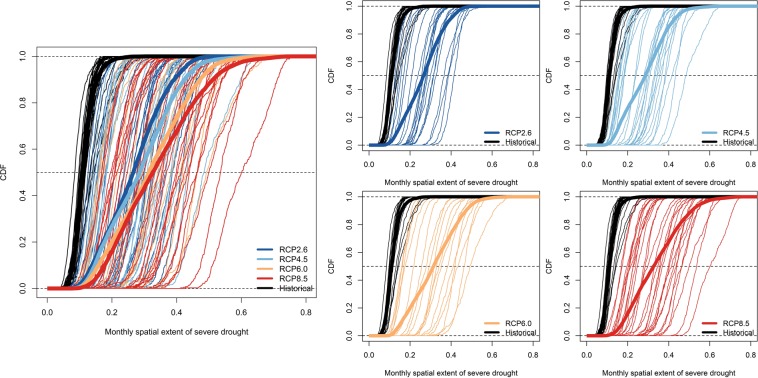
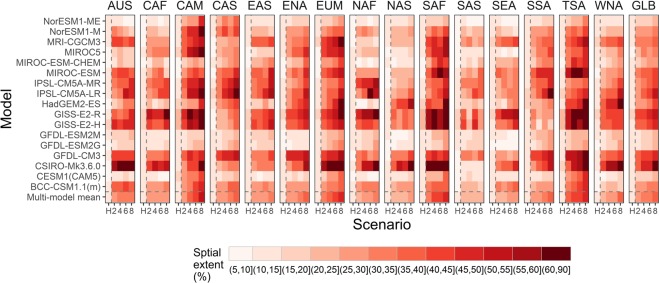
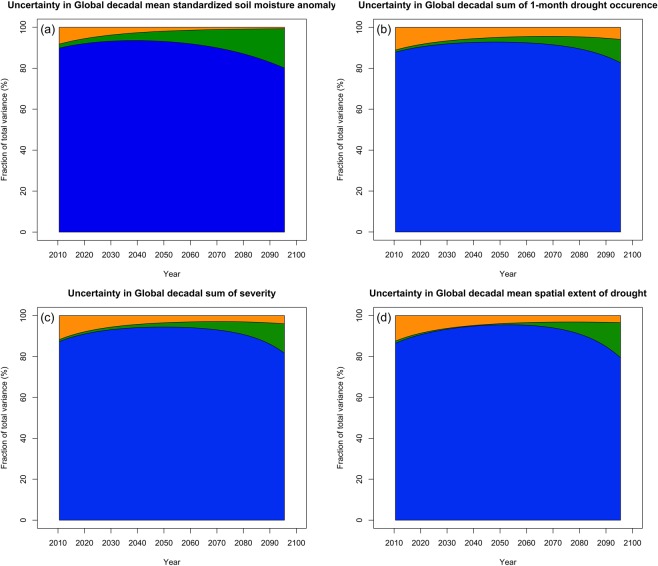
Future climate changes could alter hydrometeorological patterns and change the nature of droughts at global to regional scales. However, there are considerable uncertainties in future drought projections. Here, we focus on agricultural drought by analyzing surface soil moisture outputs from CMIP5 multi-model ensembles (MMEs) under RCP2.6, RCP4.5, RCP6.0, and RCP8.5 scenarios. First, the annual mean soil moisture by the end of the 21st century shows statistically significant large-scale drying and limited areas of wetting for all scenarios, with stronger drying as the strength of radiative forcing increases. Second, the MME mean spatial extent of severe drought is projected to increase for all regions and all future RCP scenarios, and most notably in Central America (CAM), Europe and Mediterranean (EUM), Tropical South America (TSA), and South Africa (SAF). Third, the model uncertainty presents the largest source of uncertainty (over 80%) across the entire 21st century among the three sources of uncertainty: internal variability, model uncertainty, and scenario uncertainty. Finally, we find that the spatial pattern and magnitude of annual and seasonal signal to noise (S/N) in soil moisture anomalies do not change significantly by lead time, indicating that the spreads of uncertainties become larger as the signals become stronger.


Conflict of interest statement

The authors declare no competing interests.

Figures

Figure 1
Figure 1
Global multi-model mean percentage change in annual mean surface soil moisture for the period of 2071–2100 (RCP forcing) relative to 1976–2005 (historical forcing) based on CMIP5 multi-model ensembles (MMEs) under four scenarios: RCP2.6, RCP4.5, RCP6.0, and RCP8.5. The grids with stippling indicate statistical significance using the non-parametric Wilcoxon signed-rank test by controlling the false discovery rate (FDR) at a significance level of 0.05, i.e., there is a strong evidence that the distribution of annual mean surface soil moisture from different GCMs for period of 2071–2100 and the period of 1976–2005 is not the same for those grid cells. The results are based on all available models for each RCP scenario and the corresponding models in the historical forcing.
Figure 2
Figure 2
(a) Boxplots of global mean frequency of short-term drought (longer than or equal to 2 months and less than 6 months, see methods), frequency of long-term drought (longer than or equal to 6 months, see methods) for the period of 1976–2005 (historical forcing) and 2071–2100 (RCP forcing) under four emission scenarios: RCP2.6, RCP4.5, RCP6.0, and RCP8.5. The range of the variation for each period is based on CMIP5 MMEs. (b) 15 regions defined in IPCC: Western North America (WNA), Eastern North America (ENA), Central America (CAM), Tropical South America (TSA), Southern South America (SSA), Europe and Mediterranean (EUM), North Africa (NAF), Central Africa (CAF), South Africa (SAF), North Asia (NAS), Central Asia (CAS), East Asia (EAS), South Asia (SAS), Southeast Asia (SEA) and Australia (AUS). The GLB stands for Globe.
Figure 3
Figure 3
Global and regional multi-model ensemble mean, 30-year mean of the monthly spatial extent of severe drought for the period of 1976–2005 in historical forcing and 2071–2100 in RCP forcing under four emission scenarios: RCP2.6, RCP4.5, RCP6.0, and RCP8.5.
Figure 4
Figure 4
Empirical cumulative distribution functions (CDFs) of the global monthly spatial extent of severe drought for the period of 1976–2005 (360 months) in historical forcing and 2071–2100 (360 months) in RCP forcing under four emission scenarios: RCP2.6, RCP4.5, RCP6.0, and RCP8.5. The thin lines indicate the CDFs for individual GCMs and the thick lines indicate the CDFs for all GCMs for each scenario.
Figure 5
Figure 5
Mean spatial extent of severe drought for the period of 1976–2005 in historical forcing and for the period of 2071–2100 in RCP forcing under four emission scenarios: RCP2.6, RCP4.5, RCP6.0, and RCP8.5. H, 2, 4, and 8 in the x-axis represent historical, RCP2.6, RCP4.5, RCP6.0, and RCP8.5 scenario respectively. The columns are globe (GLB) and 15 regions.
Figure 6
Figure 6
Global (a) decadal mean standardized soil moisture anomalies; (b) decadal sum of 1-month drought occurrence; (c) decadal sum of drought severity; (d) decadal mean spatial extent of drought from CMIP5 MMEs under four RCP scenarios: RCP2.6, RCP4.5, RCP6.0, and RCP8.5 from 1900 to 2100 (the thin line represents individual GCM and the thick line represents multi-model mean for each scenario). The fluctuations (“wiggles”) superimposed on the long-term trends in each projection approximate the internal variability in climate; the spread of the thin lines in the same color represents the model uncertainty for a particular scenario (e.g. red color for RCP8.5); the spread of the four thick colored lines represents the scenario uncertainty.
Figure 7
Figure 7
Fraction of total variance in (a) Global decadal mean standardized soil moisture anomaly, (b) Global decadal sum of 1-month drought occurrence, (c) Global decadal sum of severity, and (d) Global decadal mean spatial extent of drought, explained by three components of total uncertainty: internal variability (orange), scenario uncertainty (green), and model uncertainty (blue). The four uncertainty partitions correspond to the four sets of time series in Fig. 6.
Figure 8
Figure 8
The annual and seasonal signal to noise ratio of surface soil moisture anomalies for the 3rd decade, 6th decade, and 9th decade relative to mean of 1976–2005 based on CMIP5 MMEs (summer: JJA in North hemisphere and DJF in South hemisphere; winter: DJF in North hemisphere and JJA in South hemisphere). The negative values indicate drying and the positive values indicate wetting. The grids with stippling indicate an absolute value of S/N greater than 1, which means that the magnitude of soil moisture anomaly change signal exceeds uncertainty.

References

    1. AMS. Drought — An Information Statement of the American Meteorological Society, https://www.ametsoc.org/ams/index.cfm/about-ams/ams-statements/statement... (2013).
    1. IPCC. Climate Change 2007: The Physical Science Basis. Contribution of Working Group I to the Fourth Assessment Report of the Intergovernmental Panel on Climate Change (Cambridge University Press, 2007).
    1. Mishra AK, Singh VP. Drought modeling - A review. J Hydrol. 2011;403:157–175. doi: 10.1016/j.jhydrol.2011.03.049. - DOI
    1. Heinrich G, Gobiet A. The future of dry and wet spells in Europe: a comprehensive study based on the ENSEMBLES regional climate models. Int. J. Climatol. 2012;32:1951–1970. doi: 10.1002/joc.2421. - DOI
    1. IPCC. Climate Change 2013: The Physical Science Basis. Contribution of Working Group I to the Fifth Assessment Report of the Intergovernmental Panel on Climate Change. (Cambridge University Press, 2013).

Publication types