. 2019 Dec;26(12):2551-2567.
doi: 10.1038/s41418-019-0318-5. Epub 2019 Mar 20.

CHK1 dosage in germinal center B cells controls humoral immunity

Affiliations

CHK1 dosage in germinal center B cells controls humoral immunity

Katia Schoeler et al. Cell Death Differ. 2019 Dec.

Abstract

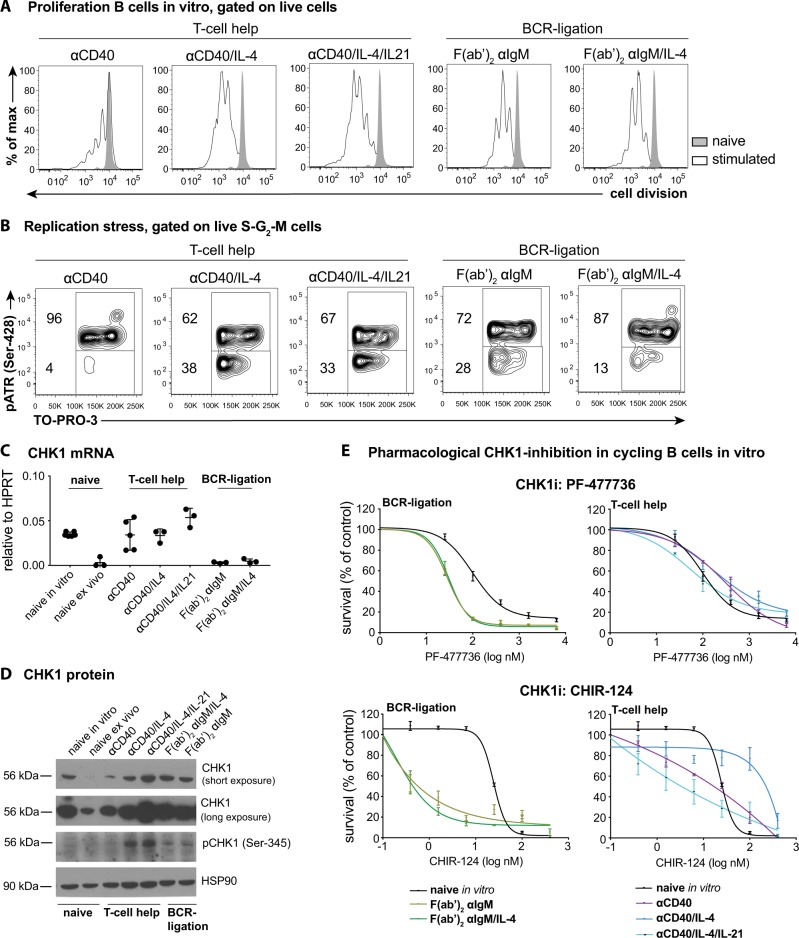
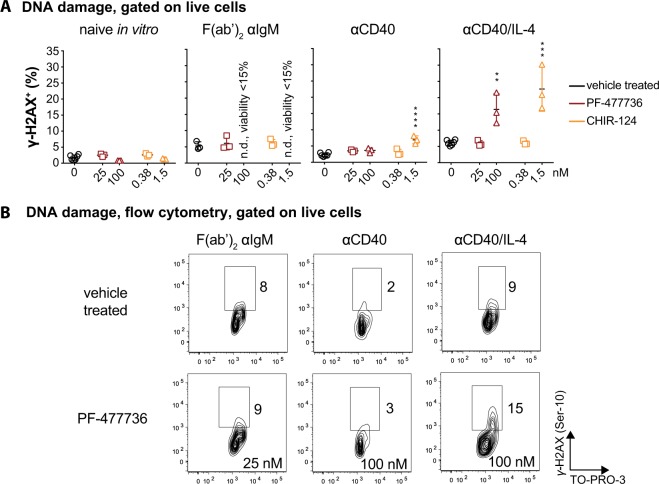
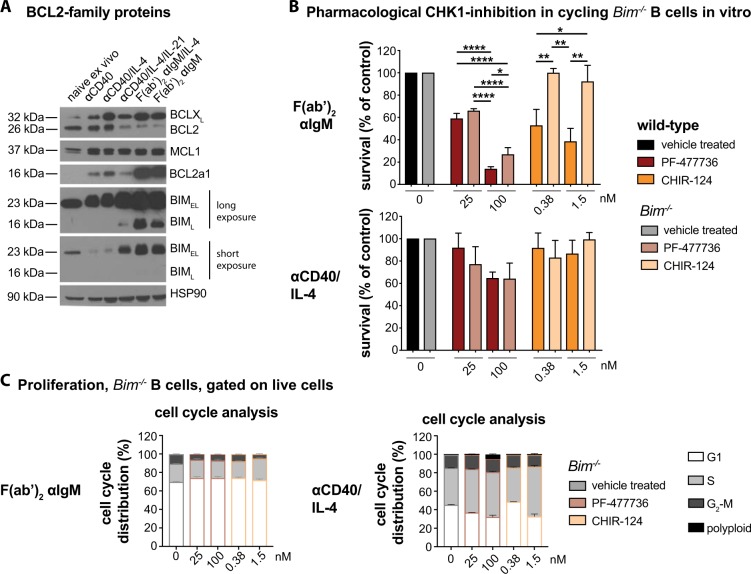
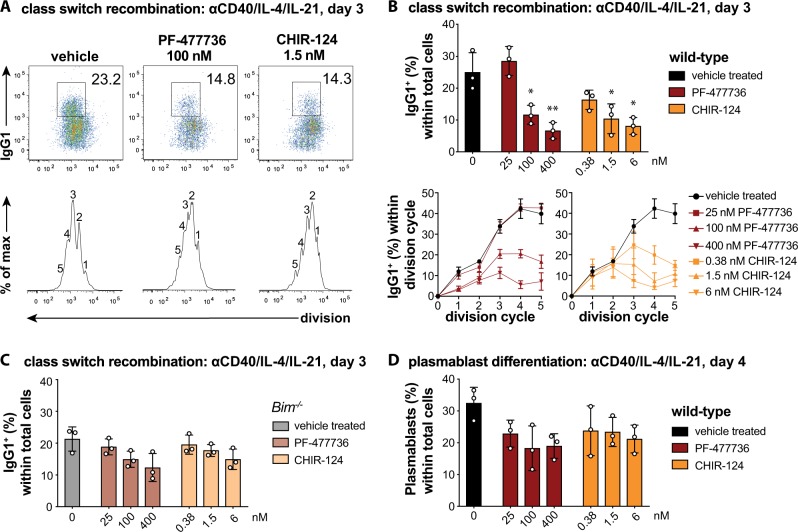
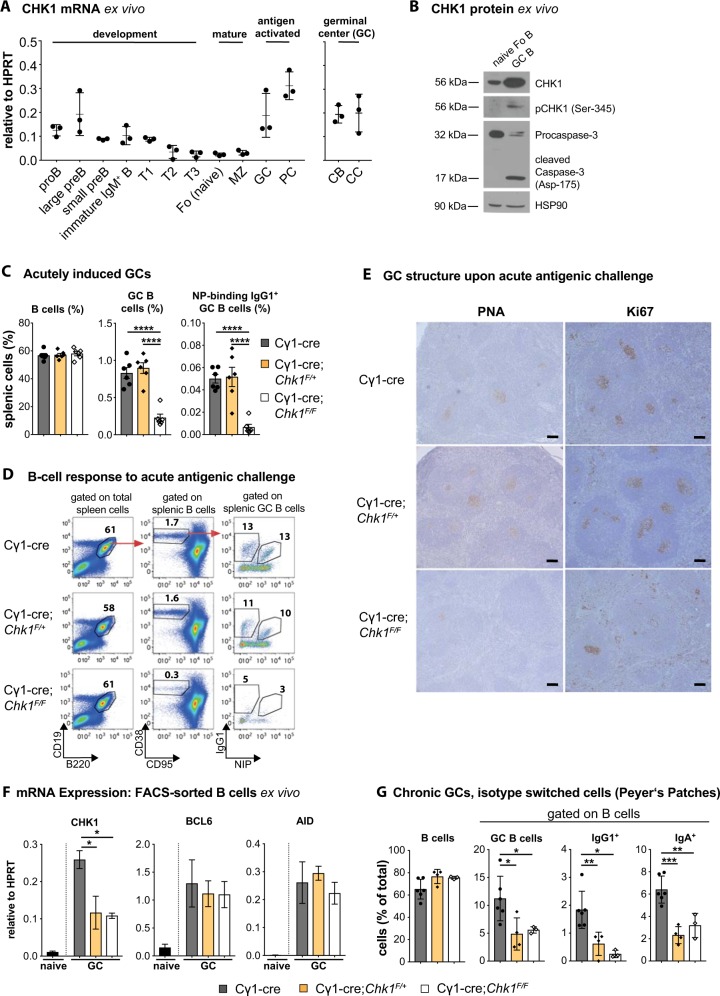
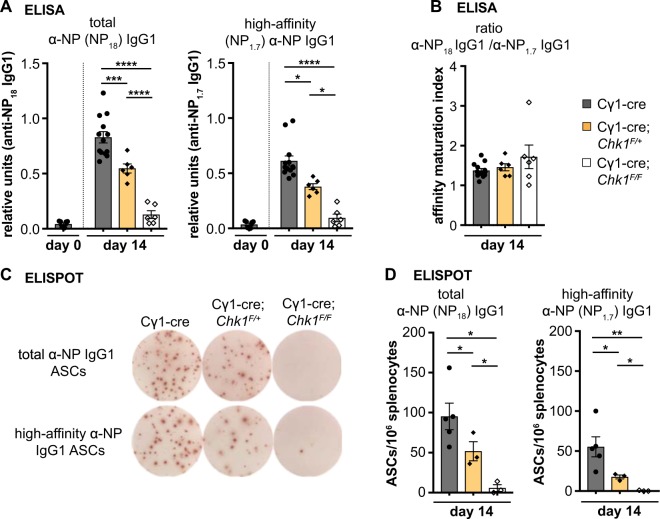
Germinal center (GC) B cells are among the fastest replicating cells in our body, dividing every 4-8 h. DNA replication errors are intrinsically toxic to cells. How GC B cells exert control over the DNA damage response while introducing mutations in their antibody genes is poorly understood. Here, we show that the DNA damage response regulator Checkpoint kinase 1 (CHK1) is essential for GC B cell survival. Remarkably, effective antibody-mediated immunity relies on optimal CHK1 dosage. Chemical CHK1 inhibition or loss of one Chk1 allele impairs the survival of class-switched cells and curbs the amplitude of antibody production. Mechanistically, active B cell receptor signaling wires the outcome of CHK1-inhibition towards BIM-dependent apoptosis, whereas T cell help favors temporary cell cycle arrest. Our results predict that therapeutic CHK1 inhibition in cancer patients may prove potent in killing B cell lymphoma and leukemia cells addicted to B cell receptor signaling, but will most likely dampen humoral immunity.


Conflict of interest statement

The authors declare that they have no conflict of interest.

Figures

Fig. 1
Fig. 1
CHK1-mediated survival of in vitro-activated B cells depends on the nature of the mitogen. a Murine splenic wild-type B cells were loaded with eFluor450 cell proliferation dye and stimulated with the indicated mitogens inducing BCR-signaling or mimicking T cell help, respectively. After 72 h, cells were analyzed for proliferation by flow cytometry as indicated by the division-dependent loss of the proliferation dye over time. Filled gray peaks represent un-stimulated (non-dividing) cells that were cultured for 72 h. Data are representative for three mice per genotype. b Contour plots depict intracellular flow cytometry staining for DNA content by TO-PRO-3 and for pATR within the S–G2–M population of the cultures described in a. Data are representative for three mice per genotype. c qRT-PCR analysis of CHK1 mRNA expression in wild-type B cells directly after isolation (naïve ex vivo) or after 48 h of cultivation without (naïve in vitro) or with mitogenic stimulation as indicated. The data are presented as means ± SD and represent 3–6 mice per cell population. d Immunoblot analysis for CHK1 and pCHK1 in wild-type B cells directly after isolation (naïve ex vivo) or after 48 h of cultivation without (naïve in vitro) or with mitogenic stimulation as indicated. Western blot is representative of four independent experiments. e Splenic wild-type B cells were left untreated or stimulated with the indicated mitogens. After 48 h, the cells were treated with vehicle or graded doses of either of the two CHK1-inhibitors PF-477736 (25, 100, 400, 1600, and 6400 nM) or CHIR-124 (0.38, 1.5, 6.25, 25, 100, and 400 nM), and analyzed 24 h later for Annexin V/TO-PRO-3 viable cells by flow cytometry. Survival is depicted normalized to the survival of the vehicle-treated culture, and hence termed “survival (% of control)”. Data are cumulative from three experiments with three mice per concentration, and presented as log(inhibitor) vs. response curves
Fig. 2
Fig. 2
Mitogenic signals differentially instruct CHK1 function. a Murine splenic wild-type B cells were loaded with eFluor450 cell proliferation dye and stimulated with the indicated mitogens. After 48 h, cells were treated with vehicle or with the indicated doses of PF-477736 and CHIR-124 for 24 h and analyzed by flow cytometry for the loss of the proliferation dye (left panel) within Annexin V/TO-PRO-3 viable cells. Furthermore, murine splenic wild-type B cells were stimulated with the indicated mitogens, and after 48 h treated with vehicle or with the indicated doses of PF-477736 and CHIR-124 for 24 h, fixed and stained with DAPI for cell cycle analysis (middle panel), or fixed and stained with a phospho-Histone H3 antibody in combination with DAPI (right panel). Data are cumulative from three experiments, with each symbol representing one wild-type mouse (n = 3–6 for all data points), and shown as mean ± SEM. **p < 0.01, ***p < 0.005, ****p < 0.0001 (one-way ANOVA followed by Tukey post-hoc test) as compared to the respective vehicle-treated control
Fig. 3
Fig. 3
Mitogenically stimulated B cells accumulate genotoxic damage that is further increased upon CHK1i in a stimulus-dependent manner. a Murine splenic wild-type B cells were stimulated with the indicated mitogens. After 48 h, cells were treated with vehicle or with the indicated doses of PF-477736 and CHIR-124 for 24 h, fixed and stained with a γ-H2AX antibody in combination with TO-PRO-3. Data are cumulative from three experiments, with each symbol representing one wild-type mouse (n = 3–6 for all data points), and shown as mean ± SEM. b Representative contour plots of the analysis shown in a. **p < 0.01, ***p < 0.005, ****p < 0.0001 (one-way ANOVA followed by Tukey post-hoc test) as compared to the respective vehicle-treated control
Fig. 4
Fig. 4
BCR-ligation primes activated B cells for BIM-induced apoptosis upon CHK1 inhibition. a Immunoblot analysis for BCL2-proteins in wild-type B cells directly after isolation (naïve ex vivo) or after 48 h of cultivation with mitogenic stimuli as indicated. Western blot is representative of two independent experiments. b Splenic wild-type or Bim/− B cells were stimulated with the indicated mitogens. After 48 h, the cells were vehicle-treated or treated with low-dose CHK1i as indicated, and analyzed 24 h later for Annexin V/TO-PRO-3 viable cells by flow cytometry. Survival is depicted normalized to the survival of the vehicle-treated culture, and termed “survival (% of control)”. Data are cumulative from three experiments (n = 3 for all data points) and shown as mean ± SEM. c Splenic Bim/− B cells were left untreated or stimulated with the indicated mitogens. After 48 h, cells were treated with vehicle or with the indicated doses of PF-477736 and CHIR-124 for 24 h, fixed and stained with DAPI for cell cycle analysis. Data are cumulative from three experiments (n = 3 for all data points) and shown as mean ± SEM. *p < 0.05, **p < 0.01, ****p < 0.0001 (one-way ANOVA followed by Tukey post-hoc test)
Fig. 5
Fig. 5
CHK1 function supports BCL2-mediated cell survival during class switch recombination. a Wild-type B cells were loaded with cell proliferation dye eF450, stimulated with αCD40/IL-4/IL-21, treated after 48 h with the indicated doses of CHK1i and analyzed 24 h later for proliferation as indicated by the division-dependent loss of the proliferation dye, and class switch recombination to IgG1. Representative dot plots and histograms of triplicate samples are shown for each condition. Numbers adjacent to gates depict % of the corresponding population within total viable (Annexin V/TO-PRO-3) cells in culture. Numbers in histograms depict how many times cells had divided. b Upper graph depicts the fraction of wild-type viable (Annexin V/TO-PRO-3) IgG1+ cells within the culture under the indicated doses of CHK1i or vehicle treatment. Lower graph depicts the fraction of wild-type viable (Annexin V/TO-PRO-3) IgG1+ cells within each division cycle under the indicated doses of CHK1i or vehicle treatment. Data are cumulative from three experiments, and shown as mean ± SD. c Bar graph depicts the fraction of Bim/− viable (Annexin V/TO-PRO-3) IgG1+ cells within the culture under graded doses of CHK1i. Data are cumulative from three experiments, and shown as mean ± SD. d Wild-type B cells were loaded with cell proliferation dye, stimulated with αCD40/IL-4/IL-21, treated after 72 h with the indicated doses of CHK1i, and analyzed 24 h later for proliferation as indicated by the division-dependent loss of the proliferation dye and plasmacytic differentiation to CD138+ cells. Bar graph depicts the fraction of CD138+ viable (Annexin V/TO-PRO-3) cells within the culture under graded doses of CHK1i. Data are cumulative from three experiments, and shown as mean ± SD. *p < 0.05, **p < 0.01 (one-way ANOVA followed by Tukey post-hoc test) as compared to the respective vehicle-treated control
Fig. 6
Fig. 6
CHK1 expression levels tune the GC reaction. a qRT-PCR analysis of CHK1 mRNA expression in FACS-sorted wild-type developing B cells in the bone marrow (pro B cells, large pre B cells, small pre B cells, immature IgM+ B cells), immature splenic B cells (T (transitional) 1 B cells, T2 B cells, T3 B cells), mature splenic B cells (Fo (follicular) B cells, MZ (marginal zone) B cells), and splenic antigen-experienced B cells (GC B cells, plasmablasts/plasma cells (PC), DZ centroblasts, LZ centrocytes). GC B cells, PC, DZ, and LZ GC B cells were from wild-type mice that had been challenged with sheep RBCs 14 days prior FACS-sorting, all other cell subsets were sorted from unchallenged wild-type mice. Data are means ± SD for three mice per cell population. b Immunoblot analysis for CHK1, pCHK1, and caspase-3 expression in wild-type naïve (Fo) follicular and GC B cells FACS-sorted from spleens 14 days post immunization with sheep RBCs. Cells from six mice were pooled per lane. c Mice of the indicated genotypes were immunized at the age of 8–10 weeks with NP-CGG and analyzed 14 days later. Flow cytometry analysis of splenic single-cell suspensions identified the fractions of B cells (B220+CD19+), GC B cells (B220+CD19+CD138CD95hiCD38lo/−) and NP+IgG1+ GC B cells within total splenocytes. Data are cumulative from two experiments with 5–6 mice per genotype, with each symbol representing one mouse, and shown as mean ± SEM. d Representative dot plots for the data shown in c. Numbers adjacent to regions indicate the % corresponding population within the respective parent population, and red arrows indicate the gating strategy. e Spleen sections from the indicated genotypes 14 days post immunization with NP-CGG were analyzed for Ki67 (proliferating cells) and for the ability of cells to bind PNA (characteristic of GC B cells). The brown precipitate indicates positive cells. Specimens were counterstained with hematoxylin. One representative mouse out of three per group is shown. Bars: 200 μm. f qRT-PCR analysis for CHK1, BCL6, and AID mRNA expression in FACS-sorted Fo (naïve) and GC splenic B cells of the indicated genotypes 10 days post immunization with NP-CGG. Data are shown as mean ± SD for three mice per group. g Flow cytometry analysis of Peyer’s patch single-cell suspensions in non-challenged 10-week-old mice identified the fractions of B cells (B220+CD19+), GC B cells (B220+CD19+CD95hiCD38lo/−), and class-switched IgG1+ or IgA+ B cells within total Peyer’s patch cells. Data are cumulative from two experiments with 3–6 mice per genotype, with each symbol representing one mouse, and shown as mean ± SEM. *p < 0.05, **p < 0.01, ***p < 0.005, ****p < 0.0001 (one-way ANOVA followed by Tukey post-hoc test)
Fig. 7
Fig. 7
Full CHK1 expression is required for optimal humoral immunity. a Serum total (α-NP18) and high-affinity (α-NP1.7) α-NP antibody titers of the IgG1 isotype before (day 0) or 14 days after immunization with NP-CGG. b Antibody affinity maturation of NP-specific IgG1 14 days after immunization. The maturation index is defined as the ratio of α-NP18 and α-NP1.7 antibody titers of the mice shown in a. c Representative picture of ELISPOT analysis of splenic total or high-affinity α-NP IgG1-secreting cells at day 14 after immunization with NP-CGG. Bar: 3 mm. d Quantification of ELISPOT analysis of splenic total or high-affinity α-NP IgG1-secreting cells at day 14 after immunization with NP-CGG. Data are shown as mean ± SEM (a, b, d) and are representative of two independent experiments with 3–6 mice per group. *p < 0.05, **p < 0.01, ***p < 0.005, ****p < 0.0001 (one-way ANOVA followed by Tukey post-hoc test)

Similar articles

Cited by

References

    1. Mesin L, Ersching J, Victora GD. Germinal center B cell dynamics. Immunity. 2016;45:471–82. - PMC - PubMed
    1. De Silva NS, Klein U. Dynamics of B cells in germinal centres. Nat Rev Immunol. 2015;15:137–48. - PMC - PubMed
    1. Shlomchik MJ, Weisel F. Germinal center selection and the development of memory B and plasma cells. Immunol Rev. 2012;247:52–63. - PubMed
    1. Victora GD, Schwickert TA, Fooksman DR, Kamphorst AO, Meyer-Hermann M, Dustin ML, et al. Germinal center dynamics revealed by multiphoton microscopy with a photoactivatable fluorescent reporter. Cell. 2010;143:592–605. - PMC - PubMed
    1. Gitlin AD, Shulman Z, Nussenzweig MC. Clonal selection in the germinal centre by regulated proliferation and hypermutation. Nature. 2014;509:637–40. - PMC - PubMed

LinkOut - more resources