. 2019 Apr;568(7751):230-234.
doi: 10.1038/s41586-019-1034-5. Epub 2019 Mar 20.

A potassium channel β-subunit couples mitochondrial electron transport to sleep

Affiliations

A potassium channel β-subunit couples mitochondrial electron transport to sleep

Anissa Kempf et al. Nature. 2019 Apr.

Abstract

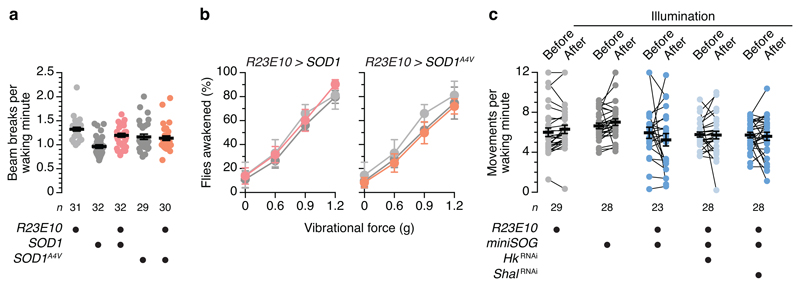
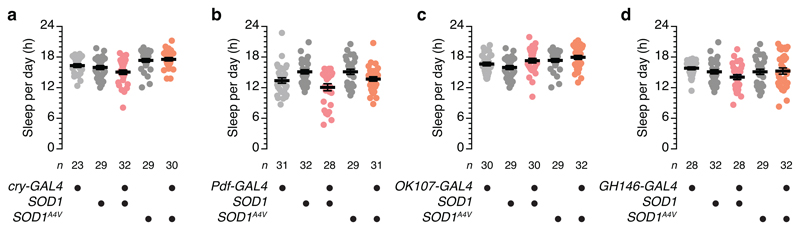
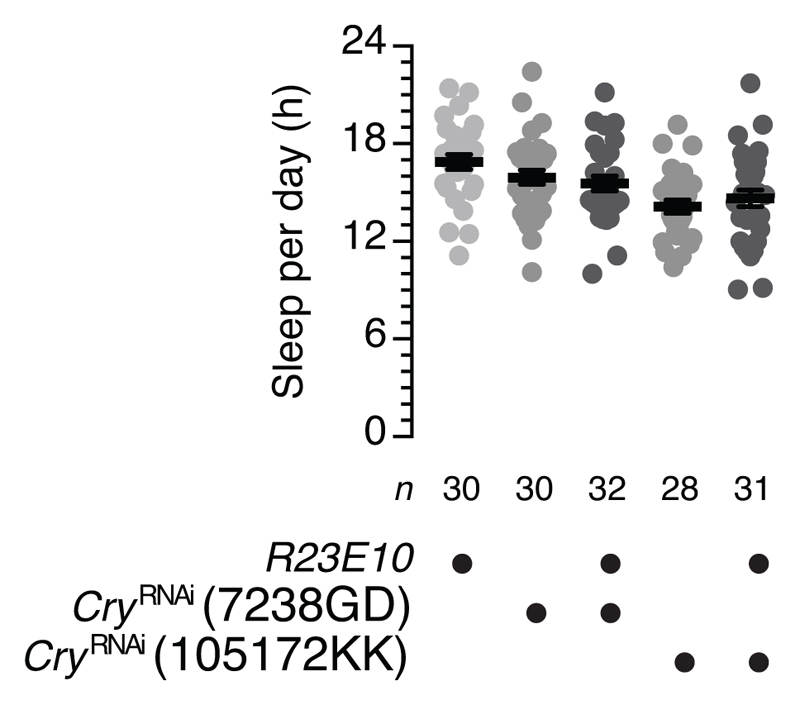
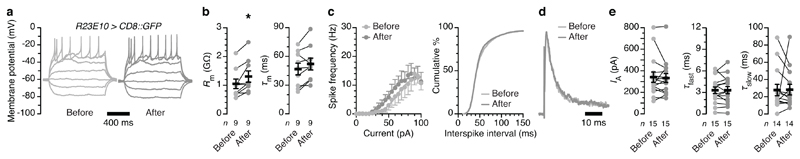
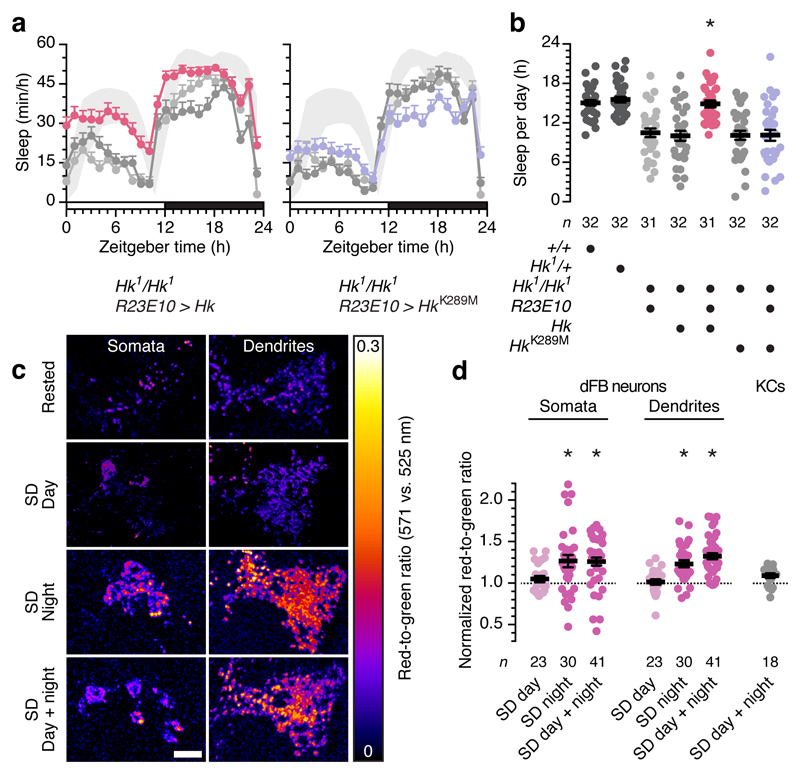
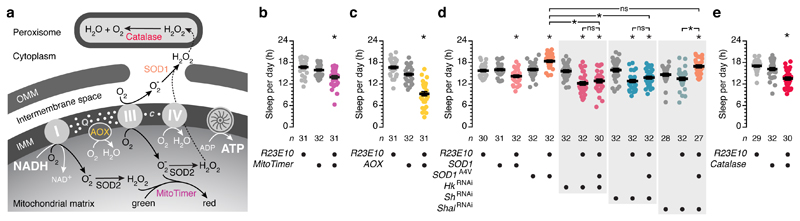
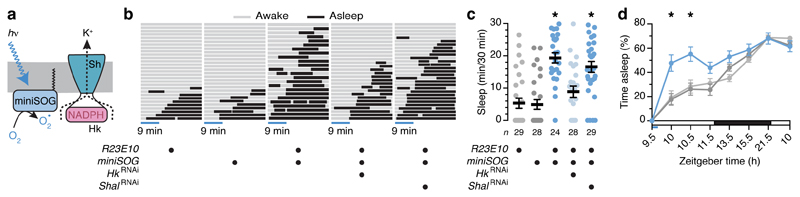
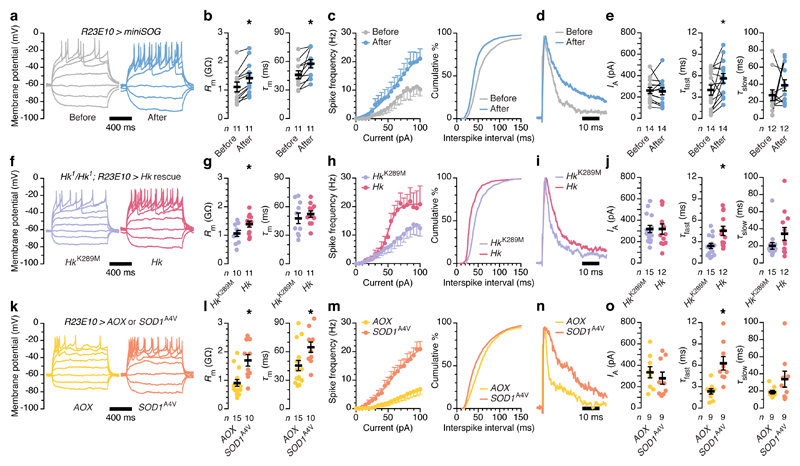
The essential but enigmatic functions of sleep1,2 must be reflected in molecular changes sensed by the brain's sleep-control systems. In the fruitfly Drosophila, about two dozen sleep-inducing neurons3 with projections to the dorsal fan-shaped body (dFB) adjust their electrical output to sleep need4, via the antagonistic regulation of two potassium conductances: the leak channel Sandman imposes silence during waking, whereas increased A-type currents through Shaker support tonic firing during sleep5. Here we show that oxidative byproducts of mitochondrial electron transport6,7 regulate the activity of dFB neurons through a nicotinamide adenine dinucleotide phosphate (NADPH) cofactor bound to the oxidoreductase domain8,9 of Shaker's KVβ subunit, Hyperkinetic10,11. Sleep loss elevates mitochondrial reactive oxygen species in dFB neurons, which register this rise by converting Hyperkinetic to the NADP+-bound form. The oxidation of the cofactor slows the inactivation of the A-type current and boosts the frequency of action potentials, thereby promoting sleep. Energy metabolism, oxidative stress, and sleep-three processes implicated independently in lifespan, ageing, and degenerative disease6,12-14-are thus mechanistically connected. KVβ substrates8,15,16 or inhibitors that alter the ratio of bound NADPH to NADP+ (and hence the record of sleep debt or waking time) represent prototypes of potential sleep-regulatory drugs.


Figures

Extended Data Figure 1
Extended Data Figure 1. Chronic or acute dFB-restricted perturbations of redox chemistry have no impact on waking locomotor activity or arousability.
a, Locomotor counts per waking minute of flies expressing R23E10-GAL4-driven SOD1 or pro-oxidant variant SOD1A4V, in the Trikinetics Drosophila Activity Monitor system, do not differ from their respective parental controls (genotype effect: P>0.2612, Kruskal-Wallis ANOVA with Dunn's post-hoc test). b, Arousability of flies expressing R23E10-GAL4-driven SOD1 (left) or pro-oxidant SOD1A4V (right) and parental controls (gray colours as in a) (genotype effects: P>0.2487, vibrational force effects: P<0.0001, vibrational force × genotype interactions: P>0.9857, two-way ANOVA). Data are means ± s.e.m. of 6 trials per genotype (n=16–32 flies each). c, Locomotor counts per waking minute of flies expressing R23E10-GAL4-driven miniSOG, with or without RNAi transgenes targeting KV channel subunits, and parental controls, in a custom video-tracking system. Activity was monitored for 10 min before the photooxidation of miniSOG and then for a 30-min interval that included a 9-min exposure to blue light (genotype effect: P=0.0827, illumination effect: P=0.8059, illumination × genotype interaction: P=0.3086, two-way repeated-measures ANOVA). Data are means ± s.e.m. n, number of flies (a, c) or trials (b). Statistical detail in Supplementary Table 2.
Extended Data Figure 2
Extended Data Figure 2. Chronic perturbations of redox chemistry in cryptochrome- or Pdf-expressing clock neurons, Kenyon cells, or olfactory projection neurons have no impact on sleep.
a, Sleep in flies expressing cry-GAL4-driven SOD1 or SOD1A4V in clock neurons and parental controls. Kruskal-Wallis ANOVA with Dunn's post-hoc test failed to detect significant differences of experimental flies from both of their respective parental controls (P>0.1426). b, Sleep in flies expressing Pdf-GAL4-driven SOD1 or SOD1A4V in clock neurons and parental controls. Kruskal-Wallis ANOVA with Dunn's post-hoc test failed to detect significant differences of experimental flies from both of their respective parental controls (P>0.1732). c, Sleep in flies expressing OK107-GAL4-driven SOD1 or SOD1A4V in Kenyon cells and parental controls. One-way ANOVA with Holm-Šídák's post-hoc test failed to detect significant differences of experimental flies from both of their respective parental controls (P>0.0603). d, Sleep in flies expressing GH146-GAL4-driven SOD1 or SOD1A4V in olfactory projection neurons and parental controls. Kruskal-Wallis ANOVA with Dunn's post-hoc test failed to detect significant differences of experimental flies from both of their respective parental controls (P>0.6901). Data are means ± s.e.m. n, number of flies. Statistical detail in Supplementary Table 2.
Extended Data Figure 3
Extended Data Figure 3. Chronic dFB-restricted manipulations of cryptochrome have no impact on sleep.
Sleep in flies expressing two different R23E10-GAL4-driven cryRNAi transgenes and parental controls. One-way ANOVA with Holm-Šídák's post-hoc test failed to detect significant differences of experimental flies from both of their respective parental controls (P>0.1718). Date are means ± s.e.m. n, number of flies. Statistical detail in Supplementary Table 2.
Extended Data Figure 4
Extended Data Figure 4. Blue illumination of miniSOG-negative dFB neurons has no impact on their electrical activity.
ae, dFB neurons expressing R23E10-GAL4-driven CD8::GFP, before and after a 9-min exposure to blue light. Example voltage responses to current steps (a, sample sizes in b): illumination increases the input resistance (b, Rm; P=0.0098, paired t-test) but not the membrane time constant (b, τm; P=0.0723, paired t-test) and leaves unchanged the current-spike frequency function (c, left; current × genotype interaction: P=0.9982, two-way repeated-measures ANOVA) and interspike interval distribution (c, right; P=0.0947, Kolmogorov-Smirnov test). Example IA (normalized to peak) evoked by voltage steps to +40 mV (d, sample sizes in e): illumination leaves unchanged the IA amplitude (e; P=0.8040, Wilcoxon test) and both inactivation time constants (e, τfast: P=0.6387, τslow: P=0.2958, Wilcoxon tests). Asterisks indicate significant differences (P<0.05). Data are means ± s.e.m. n, number of cells. Statistical detail in Supplementary Table 2.
Figure 1
Figure 1. Hyperkinetic senses redox changes linked to sleep history.
a, R23E10-GAL4-driven expression of Hk (left), but not of HkK289M (right), in a homozygous Hk1 mutant background restores wild-type sleep (shaded bands: 95% confidence intervals) relative to parental controls (gray colours and sample sizes as in b). Two-way repeated-measures ANOVA with Holm-Šídák’s post-hoc test detected significant differences from both parental controls (P<0.0001) but not from wild-type (P=0.8599) in flies expressing Hk, and a significant difference from wild-type (P<0.0001) but not from either parental control (P>0.9741) in flies expressing HkK289M. b, Sleep in homozygous Hk1 mutants expressing R23E10-GAL4-driven Hk rescue transgenes and parental, wild-type, and heterozygous controls. One-way ANOVA with Holm-Šídák’s post-hoc test detected significant differences from both parental controls (P<0.0001) but not from wild-type (P=0.9763) in flies expressing Hk, and a significant difference from wild-type (P<0.0001) but not from either parental control (P>0.9704) in flies expressing HkK289M. c, Example maximum intensity projections of the somata and dendritic arbors of dFB neurons expressing MitoTimer under R23E10-GAL4 control, in rested and sleep-deprived (SD) flies (sample sizes in d). The red-to-green emission ratio is pseudocoloured according to the key on the right. Scale bar, 10 µm. d, Sleep deprivation during the night (SD effect: P<0.0001, Kruskal-Wallis ANOVA), but not during the day (P>0.6416, Mann-Whitney test), increases MitoTimer's red-to-green ratio in somata and dendrites of dFB neurons but not in Kenyon cells (KCs) (P=0.1328, t-test). Fluorescence ratios are normalized to those of unperturbed controls at the end of sleep deprivation (n=22 and 62 dFB controls for daytime and night-time deprivation; n=20 KC controls). Asterisks indicate significant differences (P<0.05) from both parental controls (b) or rested conditions (d) in pairwise post-hoc comparisons. Data are means ± s.e.m. n, number of flies. Statistical detail in Supplementary Table 1.
Figure 2
Figure 2. dFB-restricted perturbations of redox chemistry alter sleep.
a, Ubiquinone (Q) and cytochrome c (c) ferry electrons (white dots) between the proton-pumping complexes I, III, and IV. When more electrons enter the transport chain than can be used to fuel ATP synthesis, a backlog accumulates in the Q pool. These electrons react directly with O2, releasing O2- into the matrix and the space between the inner and outer mitochondrial membranes (IMM and OMM). Superoxide dismutases (SOD2 in the matrix, SOD1 in the intermembrane space and cytoplasm) convert O2- to membrane-permeant H2O2; catalase decomposes H2O2. AOX uses surplus Q electrons to reduce O2 to water. Coloured components were manipulated in be. b, Sleep in flies expressing R23E10-GAL4-driven MitoTimer and parental controls (genotype effect: P=0.0007, one-way ANOVA). c, Sleep in flies expressing R23E10-GAL4-driven AOX and parental controls (genotype effect: P<0.0001, one-way ANOVA). d, Sleep in flies expressing R23E10-GAL4-driven SOD1 or pro-oxidant SOD1A4V, with or without RNAi transgenes targeting KV channel subunits, and parental controls (genotype effect: P<0.0001, one-way ANOVA). e, Sleep in flies expressing R23E10-GAL4-driven catalase and parental controls (genotype effect: P<0.0001, one-way ANOVA). Asterisks indicate significant differences (P<0.05) from both parental controls or in relevant pairwise post-hoc comparisons (brackets). Data are means ± s.e.m. n, number of flies. Statistical detail in Supplementary Table 1.
Figure 3
Figure 3. Optogenetically controlled ROS production in dFB neurons induces sleep.
a, N-myristoylated miniSOG near the Hyperkinetic (Hk) gondola underneath Shaker (Sh). b, Periods of wake (gray) and sleep (black) during and after an initial 9-min exposure to blue light, in flies expressing R23E10-GAL4-driven miniSOG, with or without RNAi transgenes targeting KV channel subunits, and parental controls. Each row depicts one individual; all individuals were awake at the onset of illumination. The fraction of experimental flies falling asleep differed from both parental controls (P<0.0001) and from flies coexpressing HkRNAi (P=0.0030) but not ShalRNAi (P=0.3622, Fisher’s exact test throughout, sample sizes in c). c, Sleep in flies expressing R23E10-GAL4-driven miniSOG, with or without RNAi transgenes targeting KV channel subunits, and parental controls (genotype effect: P<0.0001, Kruskal-Wallis ANOVA). d, Cumulative sleep percentages after a 9-min exposure to blue light at zeitgeber time 9.5 h, in flies expressing R23E10-GAL4-driven miniSOG (n=19) and parental controls (n=25 each, gray colours as in c) (time × genotype interaction: P<0.0001, two-way repeated-measures ANOVA). Asterisks indicate significant differences (P<0.05) from both parental controls or in relevant pairwise post-hoc comparisons. Data are means ± s.e.m. n, number of flies. Statistical detail in Supplementary Table 1.
Figure 4
Figure 4. Changes in redox chemistry alter the spiking activity of dFB neurons via IA.
ae, dFB neurons expressing R23E10-GAL4-driven miniSOG and CD8::GFP, before and after a 9-min exposure to blue light. Example voltage responses to current steps (a, sample sizes in b): illumination increases the input resistance (b, Rm; P<0.0001, paired t-test) and membrane time constant (b, τm; P=0.0041, paired t-test), steepens the current-spike frequency function (c, left; current × genotype interaction: P=0.0014, two-way repeated-measures ANOVA), and shifts the interspike interval distribution toward shorter values (c, right; P<0.0001, Kolmogorov-Smirnov test). Example IA (normalized to peak) evoked by voltage steps to +40 mV (d, sample sizes in e): illumination leaves the IA amplitude unchanged (e; P=0.7295, paired t-test) and increases the fast (e, τfast; P=0.0245, Wilcoxon test) but not the slow inactivation time constant (e, τslow; P=0.3804, Wilcoxon test). fj, dFB neurons expressing R23E10-GAL4-driven HkK289M or Hk rescue transgenes in a homozygous Hk1 mutant background. Example voltage responses to current steps (f, sample sizes in g): catalytically competent Hk increases the input resistance (g, Rm; P=0.0467, t-test) but not the membrane time constant (g, τm; P=0.4962, t-test), steepens the current-spike frequency function (h, left; current × genotype interaction: P<0.0001, two-way repeated-measures ANOVA), and shifts the interspike interval distribution toward shorter values (h, right; P<0.0001, Kolmogorov-Smirnov test). Example IA (normalized to peak) evoked by voltage steps to +40 mV (i, sample sizes in j): catalytically competent Hk leaves the IA amplitude unchanged (j; P=0.9827, t-test) and increases the fast (j, τfast; P=0.0061, t-test) but not the slow inactivation time constant (j, τslow; P=0.1257, Mann-Whitney test). ko, dFB neurons expressing R23E10-GAL4-driven AOX or SOD1A4V. Example voltage responses to current steps (k, sample sizes in l): pro-oxidant SOD1A4V increases the input resistance (l, Rm; P=0.0023, Mann-Whitney test) and membrane time constant (l, τm; P=0.0166, Mann-Whitney test), steepens the current-spike frequency function (m, left; current × genotype interaction: P<0.0001, two-way repeated-measures ANOVA), and shifts the interspike interval distribution toward shorter values (m, right; P<0.0001, Kolmogorov-Smirnov test). Example IA (normalized to peak) evoked by voltage steps to +40 mV (n, sample sizes in o): pro-oxidant SOD1A4V leaves the IA amplitude unchanged (o; P=0.4892, t-test) and increases the fast (o, τfast; P=0.0027, t-test) but not the slow inactivation time constant (o, τslow; P=0.3401, Mann-Whitney test). Asterisks indicate significant differences (P<0.05). Data are means ± s.e.m. n, number of cells. Statistical detail in Supplementary Table 1.

Comment in

References

    1. Rechtschaffen A. Current perspectives on the function of sleep. Perspect Biol Med. 1998;41:359–390. - PubMed
    1. Mignot E. Why we sleep: the temporal organization of recovery. PLoS Biol. 2008;6:e106. - PMC - PubMed
    1. Donlea JM, Thimgan MS, Suzuki Y, Gottschalk L, Shaw PJ. Inducing sleep by remote control facilitates memory consolidation in Drosophila. Science. 2011;332:1571–1576. - PMC - PubMed
    1. Donlea JM, Pimentel D, Miesenböck G. Neuronal machinery of sleep homeostasis in Drosophila. Neuron. 2014;81:860–872. - PMC - PubMed
    1. Pimentel D, et al. Operation of a homeostatic sleep switch. Nature. 2016;536:333–337. - PMC - PubMed

Publication types

MeSH terms