. 2019 Mar;567(7749):545-549.
doi: 10.1038/s41586-019-1030-9. Epub 2019 Mar 20.

Recruitment of BRCA1 limits MYCN-driven accumulation of stalled RNA polymerase

Affiliations

Recruitment of BRCA1 limits MYCN-driven accumulation of stalled RNA polymerase

Steffi Herold et al. Nature. 2019 Mar.

Abstract

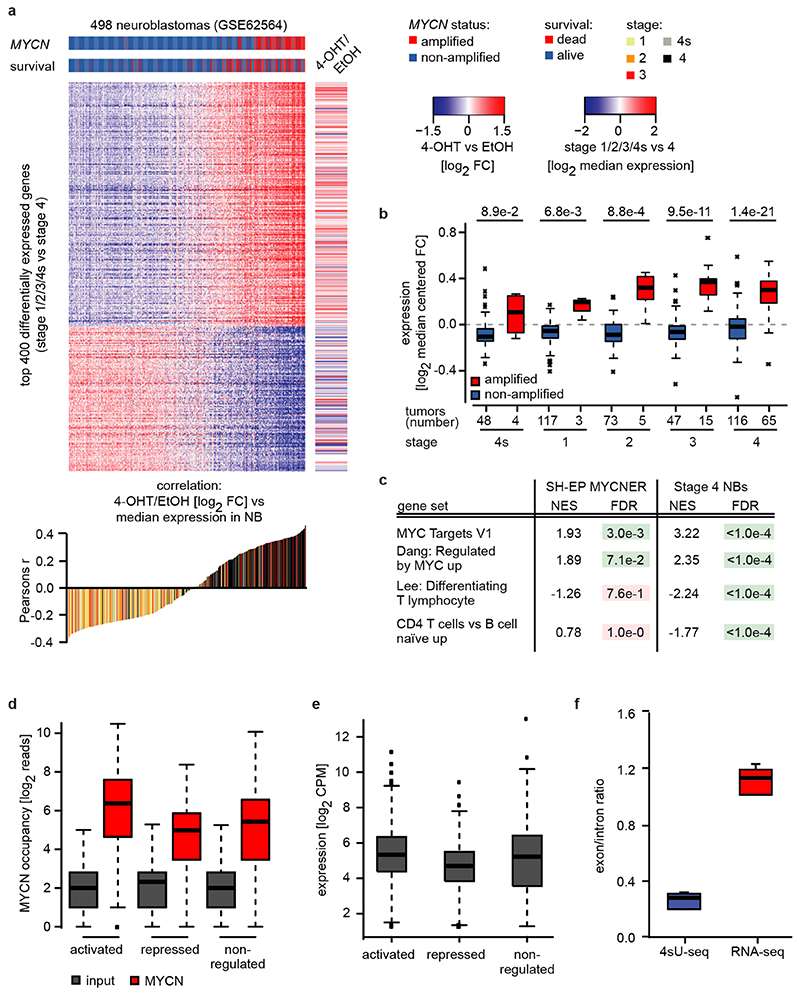
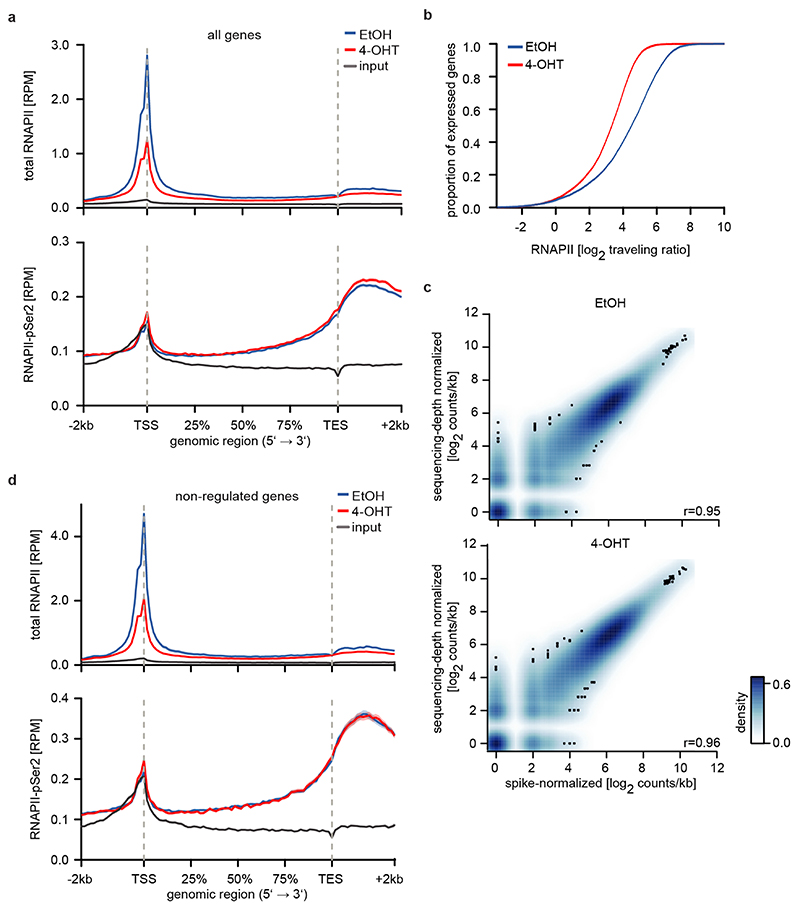
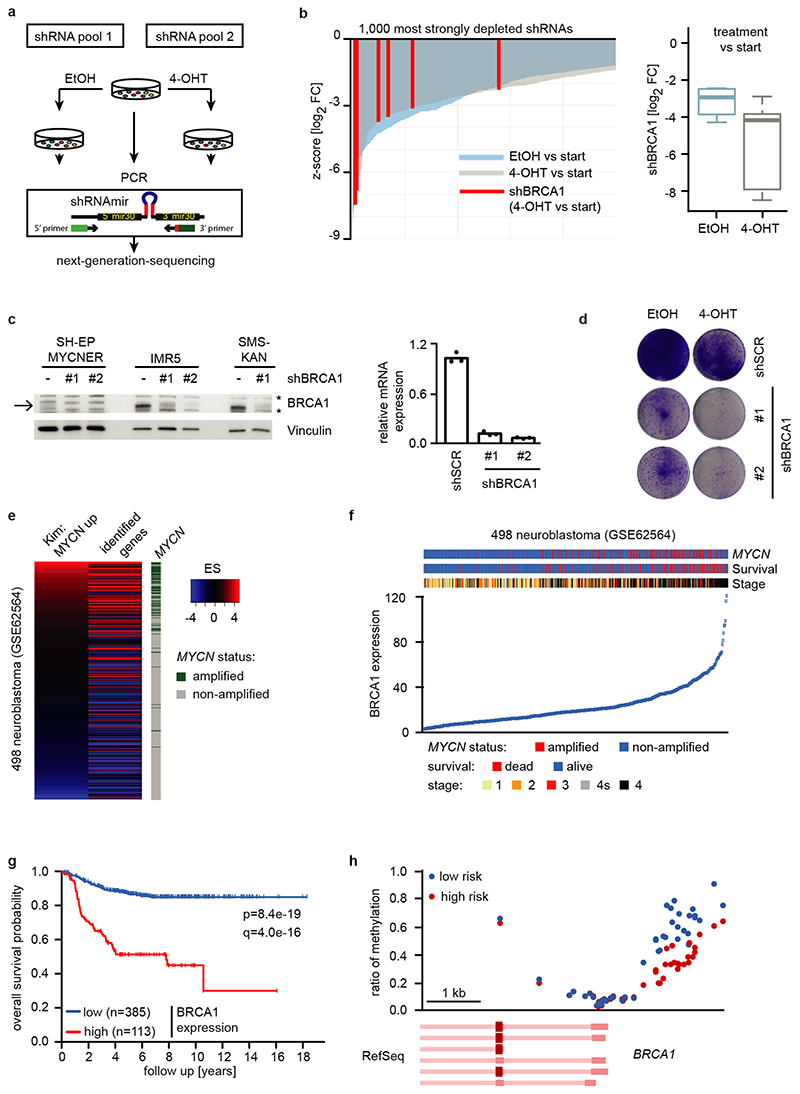
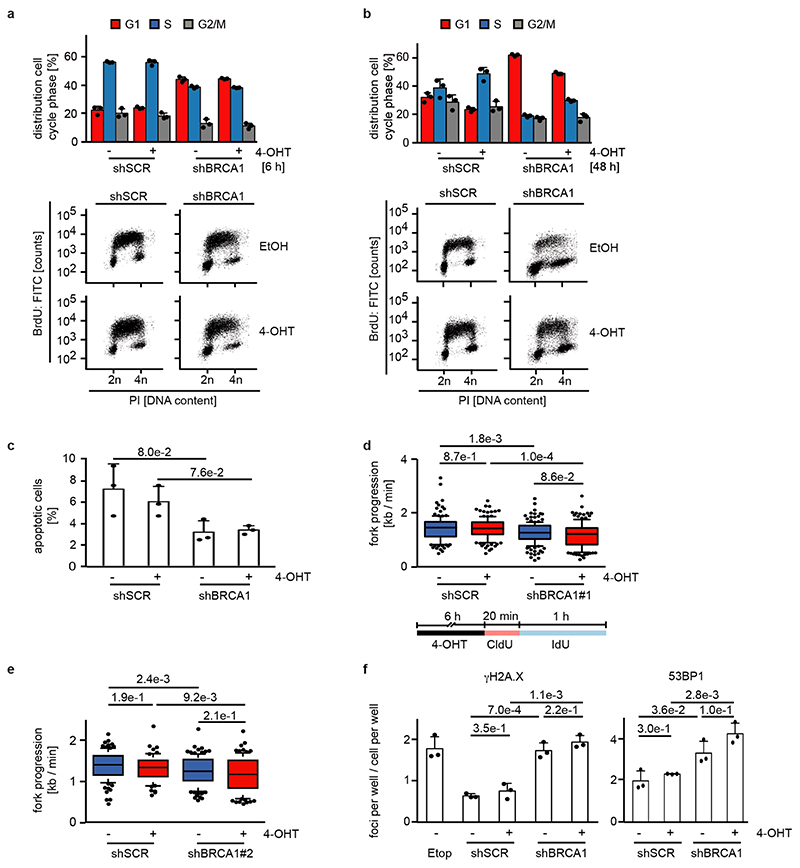
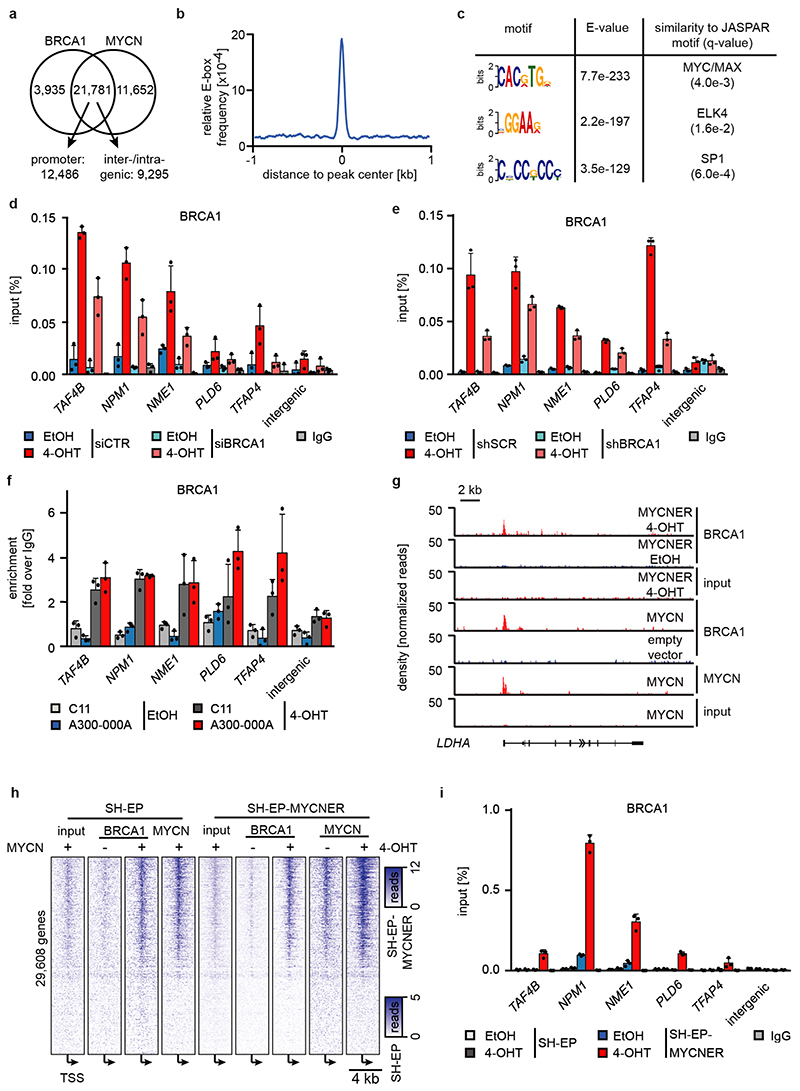
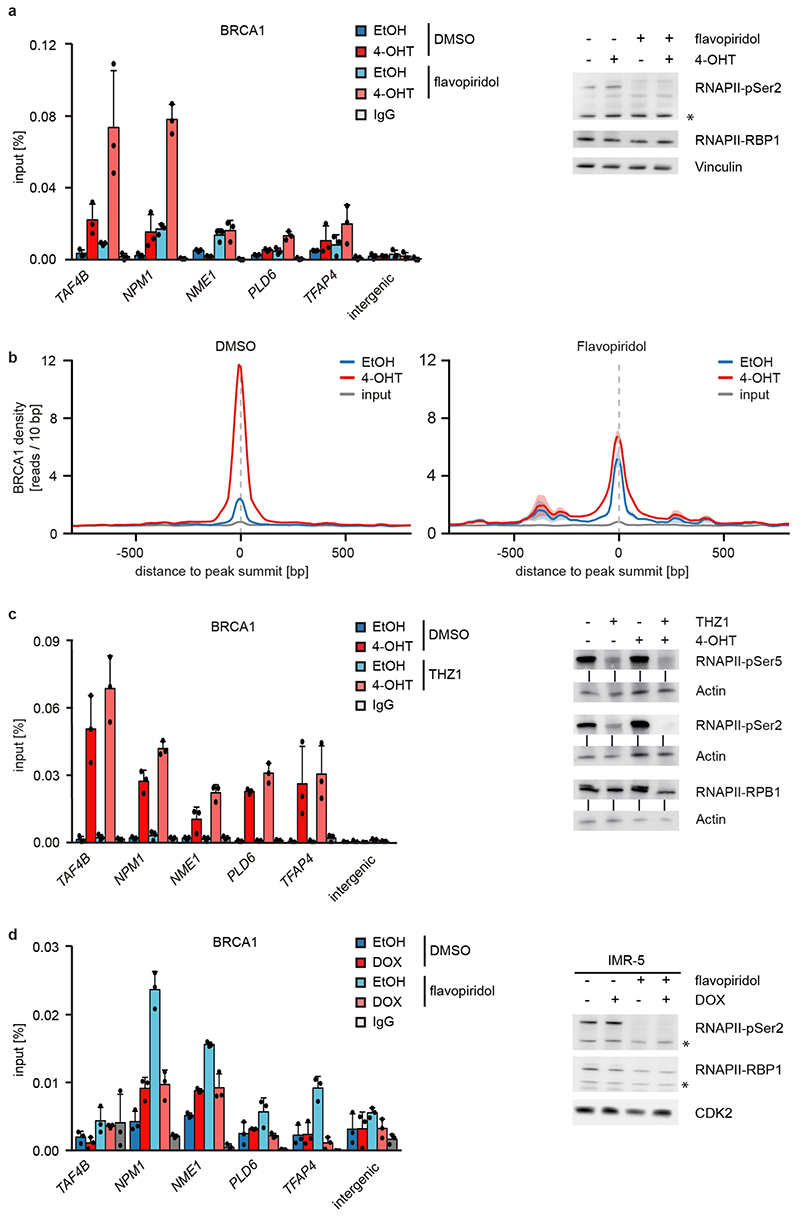
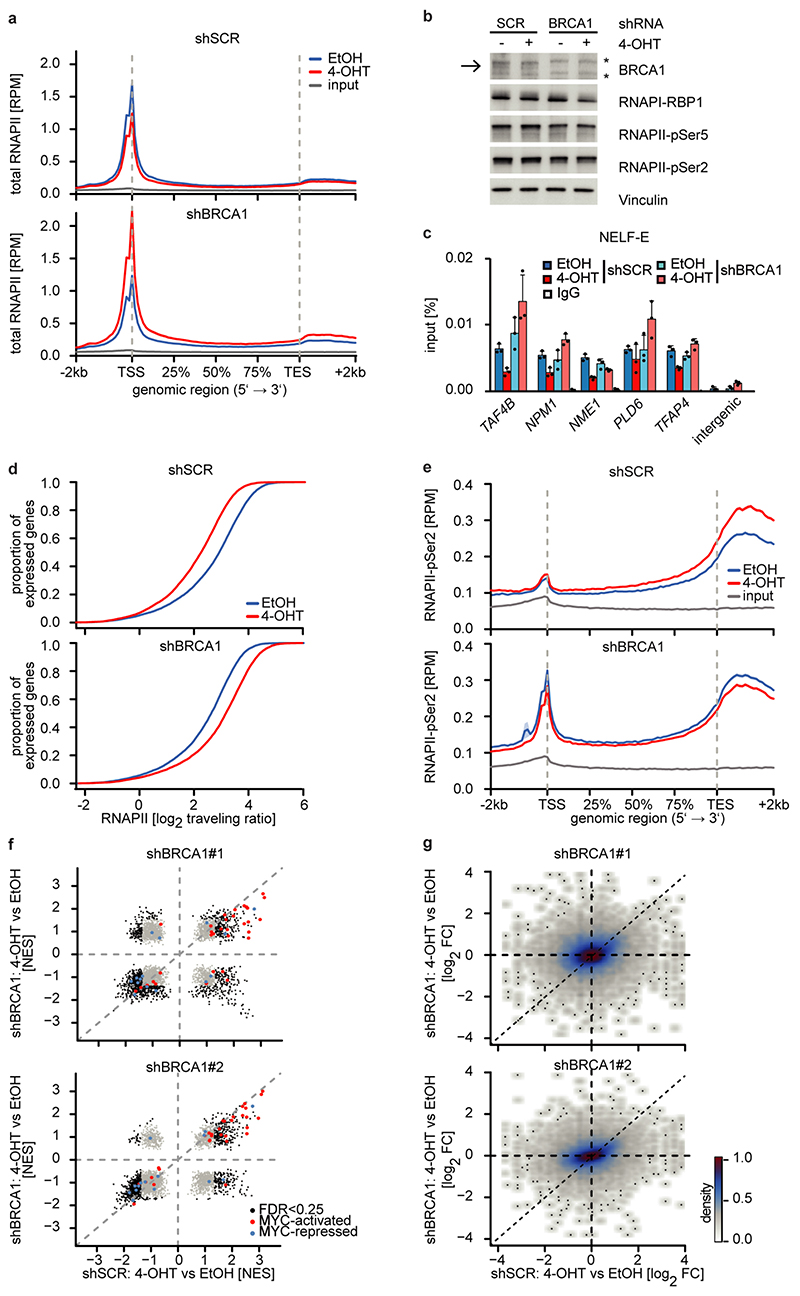
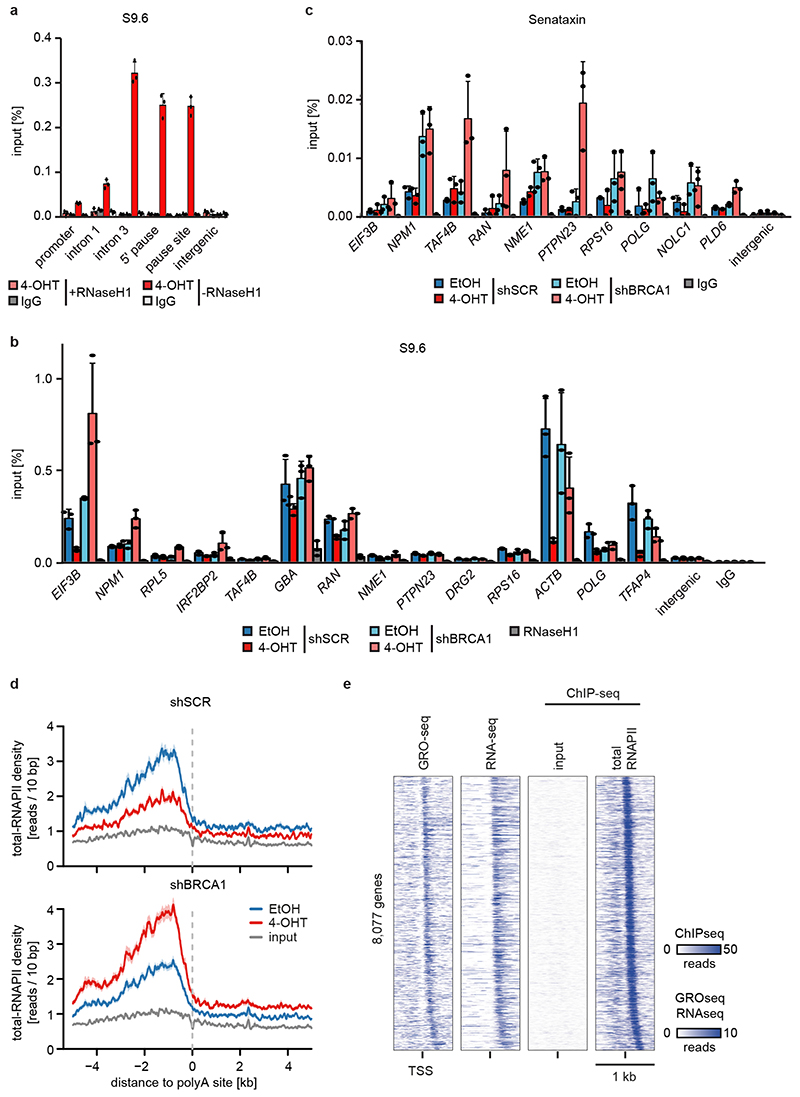
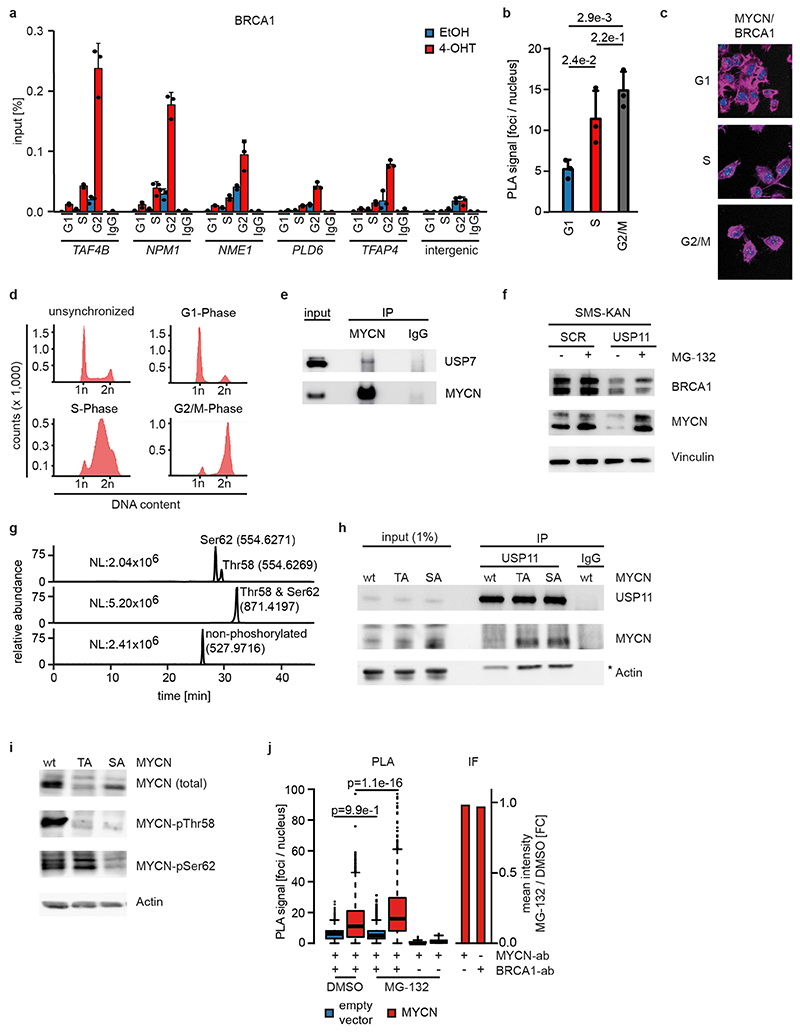
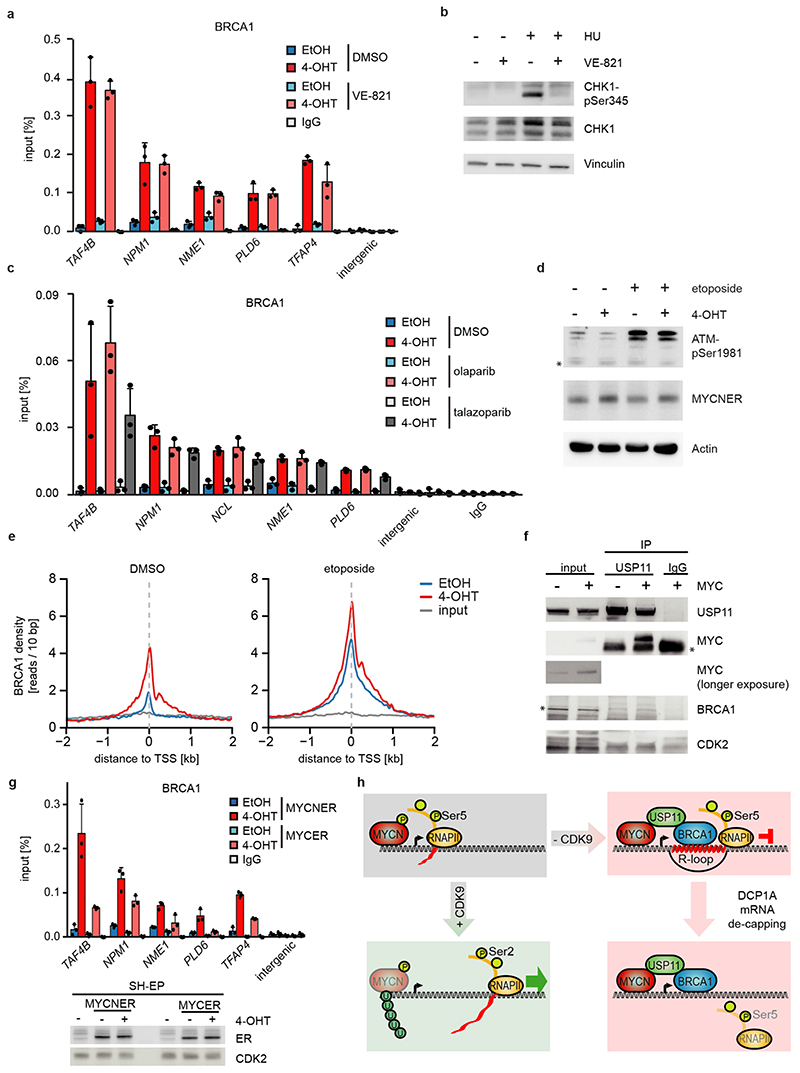
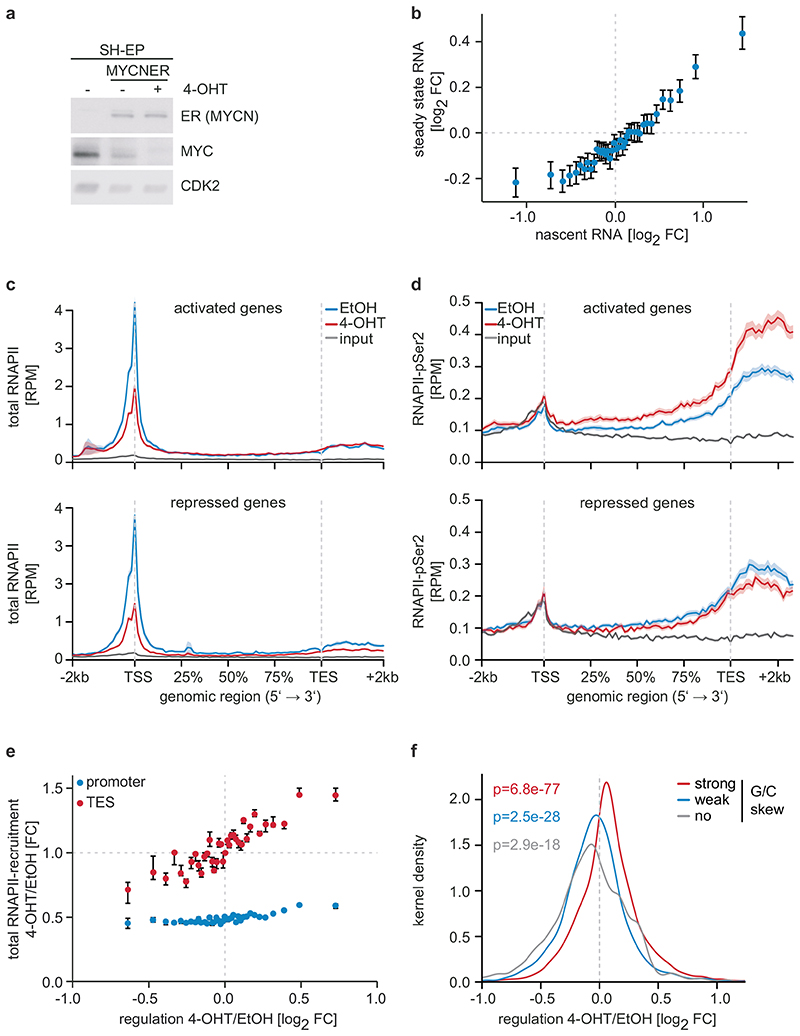
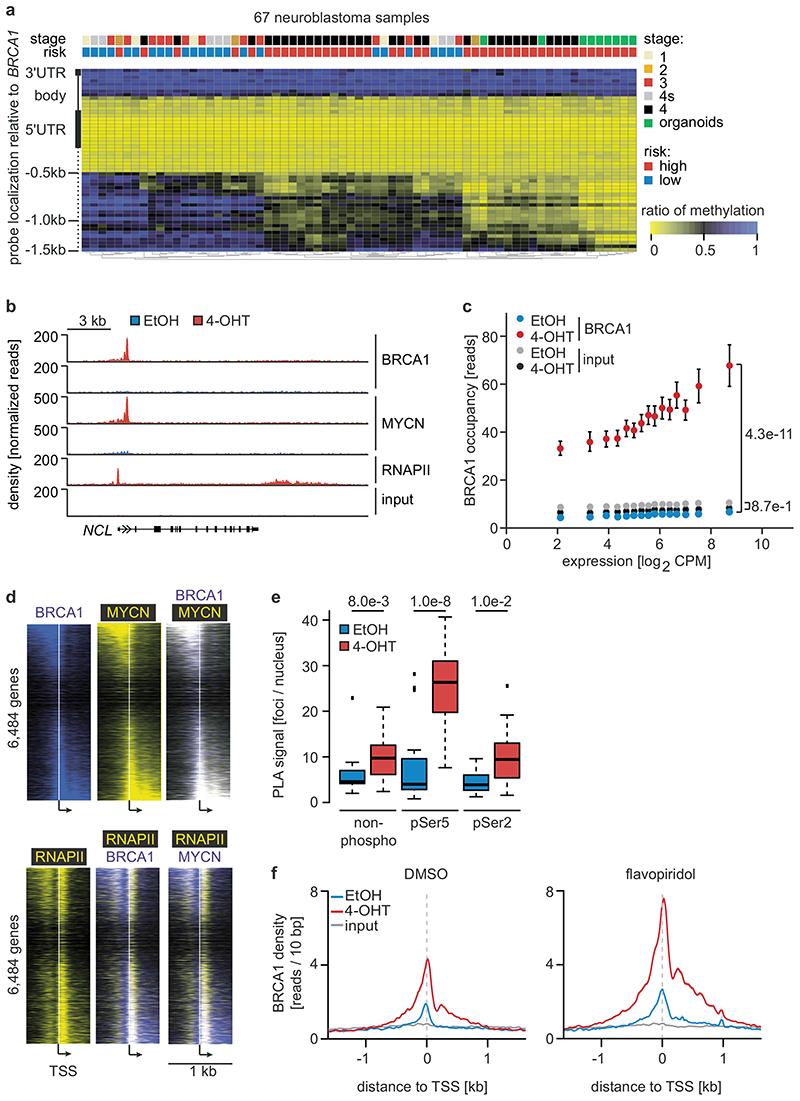
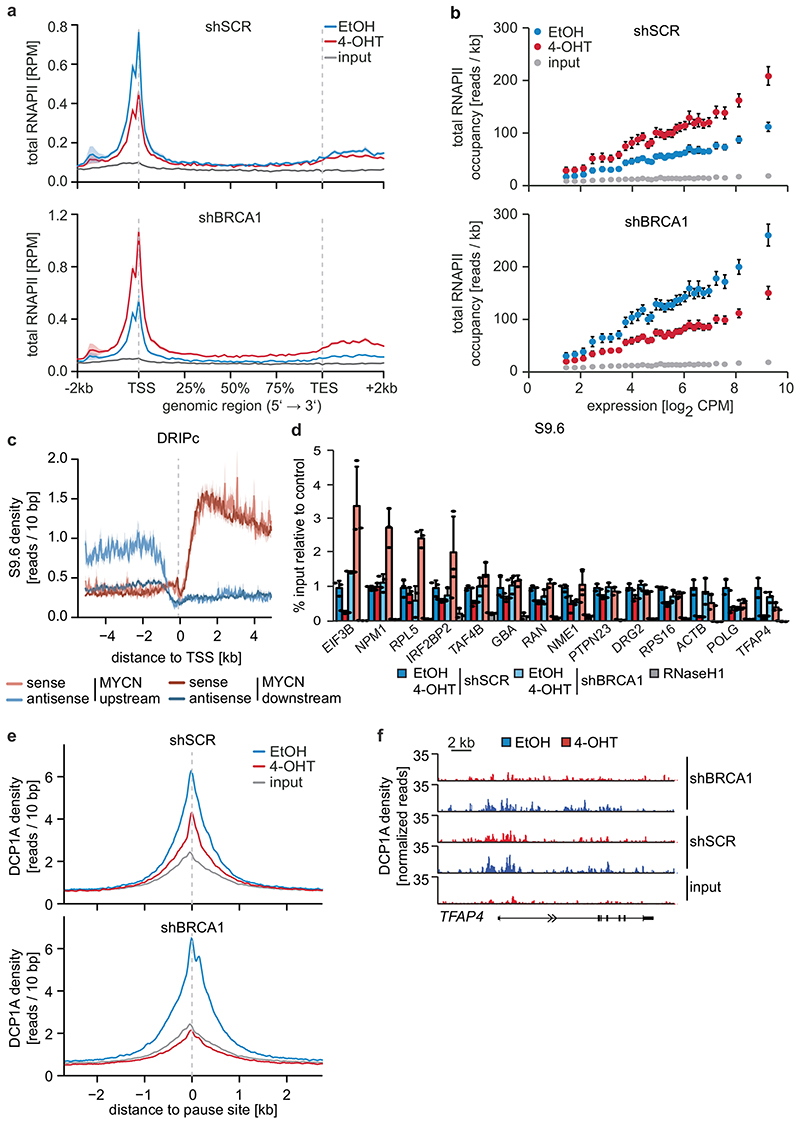
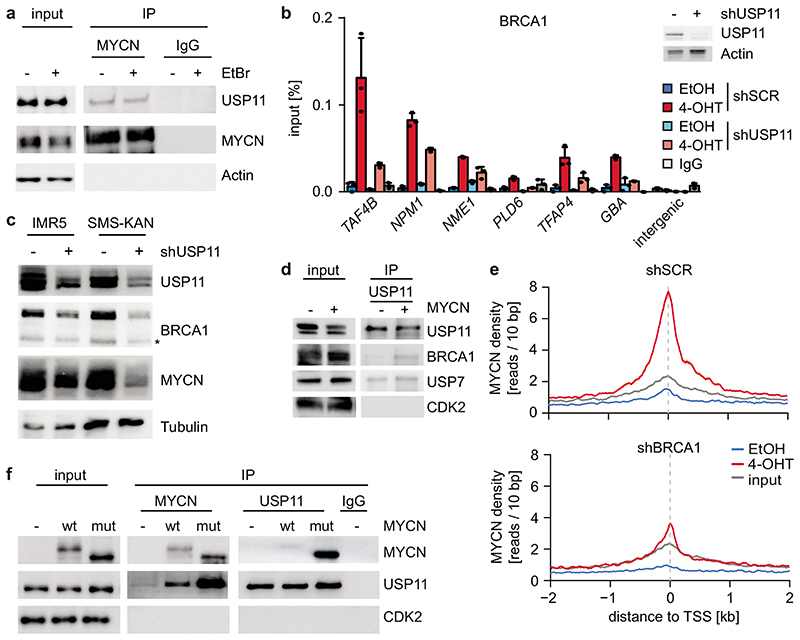
MYC is an oncogenic transcription factor that binds globally to active promoters and promotes transcriptional elongation by RNA polymerase II (RNAPII)1,2. Deregulated expression of the paralogous protein MYCN drives the development of neuronal and neuroendocrine tumours and is often associated with a particularly poor prognosis3. Here we show that, similar to MYC, activation of MYCN in human neuroblastoma cells induces escape of RNAPII from promoters. If the release of RNAPII from transcriptional pause sites (pause release) fails, MYCN recruits BRCA1 to promoter-proximal regions. Recruitment of BRCA1 prevents MYCN-dependent accumulation of stalled RNAPII and enhances transcriptional activation by MYCN. Mechanistically, BRCA1 stabilizes mRNA decapping complexes and enables MYCN to suppress R-loop formation in promoter-proximal regions. Recruitment of BRCA1 requires the ubiquitin-specific protease USP11, which binds specifically to MYCN when MYCN is dephosphorylated at Thr58. USP11, BRCA1 and MYCN stabilize each other on chromatin, preventing proteasomal turnover of MYCN. Because BRCA1 is highly expressed in neuronal progenitor cells during early development4 and MYC is less efficient than MYCN in recruiting BRCA1, our findings indicate that a cell-lineage-specific stress response enables MYCN-driven tumours to cope with deregulated RNAPII function.


Conflict of interest statement

Conflict of Interest

The authors do not declare a conflict of interest.

Figures

Extended Data Figure 1
a: (Top) Heat map showing 400 most differentially expressed genes between 498 low- and high-grade neuroblastomas (GSE62564). MYCN-amplification status of the tumors and survival of the patients is indicated by the horizontal bars on top and the right panel illustrates gene expression changes after MYCNER-activation (3 h 4-OHT) in SH-EP cells of the same genes. (Bottom) Correlation between relative gene expression in tumors and changes in response to MYCNER-activation. b: Box plots showing expression of 294 MYCNER-activated genes (SH-EP MYCNER, FDR<0.01 and log2 FC (4-OHT vs EtOH)>0 in 3 biological replicates) in neuroblastomas of the indicated tumor stage with or without MYCN amplification (GSE62564). Number of tumor samples is indicated at the bottom and p-values were calculated using a two-tailed Wilcoxon rank-sum test. In the box plot, the central line reflects the median and the borders of the boxes show the interquartile range of the plotted data. The whiskers extend to 1.5x of the interquartile range and outliers are shown as dots. c: Expression of selected gene sets from GSE analysis in SH-EP cells after MYCNER-activation (3 h 4-OHT, n=3) and in 65 MYCN-amplified versus 116 non-amplified stage 4 neuroblastomas (GSE62564). p-values were calculated using a Kolmogorov-Smirnov test with 1,000 permutations and corrected for multiple testing using Benjamin-Höchberg procedure (FDR). d: Box plot illustrating MYCN-binding in promoters (-30 to +300 bp relative to TSS) of 914 MYCN-activated and 615 repressed genes (n=3). As control, a randomly selected group of 1,000 non-regulated expressed genes was chosen. p-values were calculated with a two-tailed Wilcoxon test. For description of the box plot, see legend to Extended Data Figure 1b. e: Box plot illustrating mRNA levels in gene groups described above (activated, repressed and non-regulated; n=3). For description of the box plot, see legend to Extended Data Figure 1b. f: Box plot showing the exon/intron ratio for 27,369 genes in 4sU-seq (n=6) compared to RNA-seq data (n=6). For description of the box plot, see legend to Extended Data Figure 1b.
Extended Data Figure 2
a: Metagene plots (mean+SEM as shadow) of total RNAPII (top) and RNAPII-pSer2 (bottom) in SH-EP MYCNER cells after 4-OHT treatment (3 h) for 14,488 expressed genes (n=4). b: Empirical cumulative distribution function of RNAPII traveling ratio after MYCNER-activation (4-OHT) of 14,488 expressed genes (n=4). c: 2D kernel density plot of total RNAPII occupancy at the TSS of 14,945 expressed genes in SH-EP MYCNER cells treated with EtOH (top) or after activation of MYCN (bottom). Samples are normalized either to sequencing depth or using a murine spike-in (n=1). r: Pearson’s correlation coefficient. d: Metagene plots (mean+SEM as shadow) of total RNAPII (top) and RNAPII-pSer2 (bottom) in SH-EP MYCNER cells after 4-OHT treatment (3 h; n=4) of 1,000 non-regulated genes.
Extended Data Figure 3
a: Schematic overview of the shRNA screen in SH-EP MYCNER cells. Samples were analyzed in duplicates after 14 days of cell culture. b: Waterfall plot (left) visualizing the depletion of the six screened shRNAs targeting BRCA1 in SH-EP MYCNER cells with activated MYCN (Z-score for the log2 fold-change (4-OHT vs start)). From all 12,931 individual shRNA, only the 1,000 shRNAs are shown that were most strongly depleted in the screen following OHT treatment. Z-scores for the depletion of all individual shRNAs were calculated based on the population mean and SD of the log2 FC of all screened shRNAs (n=2). Box plot (right) comparing depletion of all shRNAs targeting BRCA1 in SH-EP MYCNER cells upon activation of MYCN. Shown are the median and the lower and upper quartiles of the log2 FC (4-OHT vs start and EtOH vs start) for n=6 independent shRNAs targeting BRCA1 mRNA. Whiskers extend to 1.5x interquartile range (IQR) above and below the upper and lower quartiles, respectively. c: Immunoblot (left) of BRCA1 in SH-EP MYCNER and in MYCN-amplified IMR5 and SMS-KAN cells showing the knockdown of BRCA1 by two shRNAs. Note the high BRCA1 levels in MYCN-amplified neuroblastoma cell lines (IMR5 and SMS-KAN) relative to the non-MYCN amplified cell line (SH-EP). The arrow points to the BRCA1 band, asterisks denote unspecific bands. Vinculin was used as loading control. For all gel source data, see Supplementary Figure 1. qPCR (right) of BRCA1 mRNA levels in BRCA1-depleted SH-EP MYCNER cells. Shown is mean of technical triplicates (n=3). d: Clonogenic assay in SH-EP MYCNER cells after shRNA-mediated knockdown of BRCA1 and induction of MYCN for six days. Colonies were stained with crystal violet (n=3). e: Expression of a gene set of the 99 genes, identified in the shRNA screen, in primary neuroblastoma patients. Each patient is ranked using a defined gene set of MYCN-amplified tumors. MYCN-amplification status of all 498 patients is indicated on the right. f: BRCA1 gene expression in 498 neuroblastoma samples (GSE62564). Tumors are sorted based on BRCA1 expression. g: Survival of 498 human neuroblastoma patients (GSE62564) stratified by BRCA1 expression. Data were obtained from GEO and the R2 platform was used for grouping tumor samples by ,,scanning” mode based on BRCA1 expression. The q-value reflects a Bonferroni-corrected p-value (log-rank test). h: BRCA1 genomic region around the transcription start with average methylation status in high versus low risk neuroblastoma.
Extended Data Figure 4
a: Quantification (top) and representative FACS profiles (bottom) documenting cell cycle distribution of bromodeoxyuridine (BrdU) / propidium iodide (PI)-stained control and BRCA1-deficient cells with shBRCA1#2 after 6 h of 4-OHT treatment. PI-staining was used for quantification. Shown is the mean and error bars indicate SD of biological triplicates. b: Same experimental setup as panel a after 48 h 4-OHT treatment. c: Percentage of apoptotic cells in control and BRCA1-deficient cells with shBRCA1#2 measured in a PI/AnnexinV FACS after treatment with 4-OHT for 48 h. Shown is the mean and error bars indicate SD of biological triplicates. p-values were calculated using an unpaired, two-tailed t-test. d: (Top) Fork progression rates during both labels based on the track length under the indicated conditions in control and BRCA1-deficient cells for shBRCA1#1. The number of analyzed DNA fibers are shSCR: EtOH 130, 4-OHT 131; shBRCA1#1: EtOH 161, 4-OHT 139. Fork progressions are displayed as boxplots with the central line reflecting the median and the borders of the boxes show the lower and upper quartile of the plotted data with 10 to 90 percentile whiskers. Outliers are shown as dots. P-values were calculated using a two-tailed, unpaired t-test with additional Welch’s correction. Shown is one representative experiment (n=3). (Bottom) Scheme of DNA fiber experiment labeled with CldU (red) and IdU (blue). e: Same experimental setup as above with shBRCA1#2. The number of DNA fibers are shSCR: EtOH 95, 4-OHT 69; shBRCA1#2: EtOH 109, 4-OHT 90. For description of the box plot, see legend to Extended Data Figure 4d. P-values were calculated using a two-tailed, unpaired t-test with additional Welch’s correction. Shown is one representative experiment (n=3). f: Number of γH2A.X (left) and 53BP1 (right) foci per cell/cell per well indicating DNA damage in control and BRCA1-deficient cells with shBRCA1#2 after 24 h of 4-OHT treatment. Etoposide (25μM) was used as positive control and added for the last 2 h. Shown is the mean and error bars indicate SD of biological triplicates. p-values were calculated using an unpaired, two-tailed t-test. Shown is one representative experiment (n=3).
Extended Data Figure 5
a: Venn diagram documenting genome-wide overlap of BRCA1 and MYCN peaks. b: Relative E-box (CACGTG) frequency around BRCA1 peaks in promoter regions (+/- 1 kb relative to the TSS). The curve is smoothed using a sliding window of 50 bp. c: Enriched DNA motifs in 12,161 BRCA1 peaks located in promoter (+/- 1kb relative to the TSS) identified by de novo motif search. A region of +/- 50 bp around the BRCA1 peak summit was analyzed and similarity to known motifs was assigned with TOMTOM and the JASPAR vertebrate motif database. E-values are calculated with Fisher’s Exact test corrected for the number of input sequences and q-values for the comparison to known motifs are FDR-corrected p-values calculated with a null model based on sampling motif columns from all the columns in the set of target motifs. Shown are the top 3 motifs from DREME analysis (n=3). d: ChIP of BRCA1 from SH-EP MYCNER cells transfected either with a control siRNA or siRNA targeting BRCA1. Selected promoters have both a robust MYCN and an overlapping BRCA1 peak. IgG was used as control. Where indicated, 4-OHT or EtOH was added for 5 h. Shown is the mean and error bars indicate SD of technical triplicates (n=1). e: ChIP of BRCA1 from SH-EP MYCNER cells stably expressing either a control shRNA or shRNA targeting BRCA1. IgG was used as control. The experiment was carried out as above. Shown is the mean and error bars indicate SD of technical triplicates (n=1). f: ChIP of BRCA1 from SH-EP MYCNER cells using two different BRCA1 antibodies. 4-OHT was added for 5 h. Shown is the mean of the enrichment over IgG (+SD of technical triplicates) (n=1). g: Browser track of the LDHA locus of a BRCA1 and MYCN ChIP-sequencing experiment documenting BRCA1 binding to the LDHA promoter in SH-EP MYCNER cell after MYCN-activation (5 h), and in SH-EP cells expressing ectopic MYCN or empty vector as control. For ectopically expressing cells the MYCN browser track is shown. h: Heat map showing occupancy of BRCA1 and MYCN in SH-EP MYCNER cells and SH-EP cells expressing ectopic MYCN or empty vector as a control. Plot is centered to TSS. i: ChIP of BRCA1 from control SH-EP and from SH-EP MYCNER cells treated either with 4-OHT or EtOH (5 h). Shown is the mean and error bars indicate SD of technical triplicates of one representative experiment (n=2).
Extended Data Figure 6
a: (Left) ChIP of BRCA1 at the indicated loci upon treatment of SH-EP MYCNER cells with 4-OHT (5 h) and flavopiridol (100 nM, 3 h) where indicated. Shown is the mean and error bars indicate SD of technical triplicates of one representative experiment (n=2). (Right) Immunoblot of cells treated as described. Asterisk denotes an unspecific band. Vinculin was used as loading control (n=1). b: Density plots (mean+SEM as shadow) of BRCA1 occupancy in 6887 intergenic regions after treatment with either 4-OHT or EtOH (5 h) in (left) DMSO and (right) flavopiridol (100 nM, 3 h) treated cells (n=1). c: (Left) ChIP of BRCA1 in SH-EP MYCNER cells treated with CDK7 inhibitor THZ1 (200 nM, 4 h) or DMSO as control together with 4-OHT or EtOH. Shown is the mean and error bars indicate SD of technical triplicates. (Right) Immunoblots for pSer5, pSer2 and total RNAPII after treatment as described above. Actin was used as loading control (n=1). d: (Left) ChIP of BRCA1 at the indicated loci in MYCN-amplified IMR-5 neuroblastoma cells expressing a doxycycline-inducible shRNA targeting MYCN. Where indicated, cells were treated with flavopiridol (200 nM, 4 h) or doxycycline (1 μg/ml, 48 h). Shown is the mean and error bars indicate SD of technical triplicates of one representative experiment (n=2). (Right) Immunoblot of cells treated as described above. Asterisks denote unspecific bands. CDK2 was used as loading control (n=2).
Extended Data Figure 7
a: Metagene plots (mean+SEM as shadow) of total RNAPII after 4-OHT treatment (3 h) in control (top) and BRCA1-depleted cells with shBRCA1#1 (bottom) on 14,488 expressed genes. b: Immunoblot of total RNAPII (RBP1) and phosphorylated forms after knockdown of BRCA1 and activation of MYCN. Shown is one representative experiment (n=2). The arrow points to the BRCA1 band, asterisks denote unspecific bands. c: ChIP of NELF-E in control and BRCA1-depleted SH-EP MYCNER cells after 4-OHT treatment (4 h). Shown is the mean and error bars indicate SD of technical triplicates of one representative experiment (n=3 using two different shRNAs). d: Empirical cumulative distribution function of RNAPII traveling ratio after MYCNER-activation (3 h) in control (top) and BRCA1-depleted (bottom) cells with shBRCA1#2 of 14,488 expressed genes. e: Metagene plots (mean+SEM as shadow) of RNAPII-pSer2 in control (top) and BRCA1-depleted (bottom) cells with shBRCA1#2 upon treatment as described above on 14,488 expressed genes. f: Gene-set enrichment analysis upon activation of MYCN (5 h) in BRCA1-depleted and control conditions (n=3). Significantly enriched gene sets are highlighted in black (FDR q-value <0.25), MYC-activated gene sets are marked in red and MYC-repressed in blue. FDR was calculated using a Kolmogorov-Smirnov test) with 1,000 permutations using a Benjamini-Höchberg correction for multiple testing. g: 2D kernel density plot correlating gene expression changes after MYCNER-activation (5 h) in BRCA1-depleted and control cells. Results are shown for two shRNAs of 19,429 expressed genes. r: Pearson’s correlation coefficient.
Extended Data Figure 8
a: DNA-RNA-Immunoprecipitation (DRIP) using the S9.6 antibody, indicating R-loops at known loci within the ACTB gene. Digestion with RNaseH1 was used as control for specificity of the antibody and IgG as control for unspecific chromatin binding. Shown is the mean and error bars indicate SD of technical triplicates of one representative experiment (n=2). b: DRIP documenting binding of the S9.6 R-loop antibody to the indicated loci upon depletion of BRCA1 and activation of MYCN for 4 h. Shown is the mean and error bars indicate SD of technical triplicates of one representative experiment (n=4). The panel shows the non-normalized data of Figure 3d. c: ChIP of Senataxin at the indicated loci in SH-EP MYCNER cells after 4-OHT treatment (3 h) in control or BRCA1-depleted cells. Shown is the mean and error bars indicate SD of technical triplicates of one representative experiment (n=2 with two different antibodies). d: RNAPII density (mean+SEM as shadow) around the first downstream polyA site in SH-EP MYCNER cells after BRCA1-depletion with shBRCA1#2 and MYCN-activation for 3h: 1,713 genes are shown. One representative experiment is shown (n=3). e: Heat map of 8,077 TSSs of genes with an RNAPII-peak downstream of the start site. Reads originate from GRO-seq, mRNA-seq and total RNAPII-ChIP-seq samples and genes are sorted based on the distance from the TSS to the RNAPII-peak.
Extended Data Figure 9
a: ChIP of BRCA1 in SH-EP MYCNER cells synchronized by a double thymidine block. Cells were released and harvested in the indicated cell cycle phase after 4 h of 4-OHT treatment. IgG was used as control. Shown is the mean and error bars indicate SD of technical triplicates (n=1). b: Bar plot summarizing the proximity ligation assays of MYCN and BRCA1 in G1-, S- and G2-phase in SH-EP MYCNER cells synchronized as described above and upon 3 h 4-OHT treatment. The plot shows mean and error bars indicate SD of biological triplicates. For each cell cycle phase, between 74 and 276 cells were counted. P-values were calculated using an unpaired, two-tailed t-test (n=1). c: Representative pictures of proximity ligation assay from panel b showing proximity of MYCN and BRCA1 in G1-, S- and G2-phase (green dots). Nuclei were stained with Hoechst, cytoskeleton was stained using phalloidin indicated in violet (n=1). d: Representative FACS profiles of propidium-iodide stained SH-EP MYCNER cells used for the experiments above (n=1). e: Immunoblot of α-MYCN immunoprecipitates from IMR-5 MYCN-amplified neuroblastoma cells. The input corresponds to 0.75 % of the amount used for the precipitation. Shown is one representative experiment (n=2). f: Immunoblot of indicated proteins after knockdown of USP11 in SMS-KAN cells and treatment with MG-132 (10 μM, 6 h) where indicated. Vinculin was used as loading control (n=1). g: Extracted ion chromatogram of MYCN phosphorylation status from SH-EP cells expressing ectopic MYCN. Values in brackets indicate m/z ratio for each peak and the normalized target level (NL) is given for each chromatogram (n=1). h: Immunoblot of α-USP11 immunoprecipitates from SH-EP cells stably expressing wild-type MYCN (“wt”), Thr58Ala (“TA”) or Ser62Ala (“SA”) mutants of MYCN. Asterisk denotes an unspecific band. Shown is one representative experiment (n=3). i: Immunoblot documenting phosphorylation status of the indicated alleles of MYCN. Actin was used as loading control. Shown is one representative experiment (n=2). j: (Left) Quantification of a proximity ligation assay illustrating complex formation of BRCA1 with MYCN in SH-EP cells expressing ectopic MYCN or empty vector as control. Between 749 and 1854 cells were counted for each condition. p-values were calculated with a two-tailed Wilcoxon test. In the box plot, the central line reflects the median and the borders of the boxes show the interquartile range of the plotted data. The whiskers extend to 1.5x of the interquartile range and outliers are shown as dots. (Right) Quantification of the corresponding immunofluorescence signals of the indicated antibodies (n=1).
Extended Data Figure 10
a: ChIP of BRCA1 in SH-EP MYCNER cells that were pre-treated with ATR inhibitor VE-821 (1 μM, 2 h), 4-OHT or EtOH was added for 4 h. Shown is the mean and error bars indicate SD of technical triplicates of one representative experiment (n=2). b: Immunoblot of pSer345-CHK1 after treatment with ATR inhibitor VE-821 as described above. Cells were treated with HU (5 mM) for 4 h as positive control. Asterisk denotes an unspecific band. Vinculin was used as loading control. Shown is one representative experiment (n=2). c: ChIP of BRCA1 in SH-EP MYCNER cells at the indicated loci after treatment (9 h) with olaparib (10 μM), talazoparib (1 μM) or DMSO as control. Shown is the mean and error bars indicate SD of technical triplicates of one representative experiment (n=3). d: Immunoblot of pSer1981-ATM after treatment with etoposide (5 μM, 3 h). Actin was used as loading control (n=1). e: Density plots of BRCA1 occupancy after treatment with either 4-OHT or EtOH (5 h) in DMSO (left) and etoposide-treated (right) SH-EP MYCNER cells. f: Immunoblots of α-USP11 immunoprecipitates from either control SH-EP cells or cells expressing transiently transfected MYC. CDK2 was used as loading control, asterisks denote unspecific bands. The input corresponds to 2 % of the amount used for the precipitation. Shown is one representative experiment (n=3). g: (Left) ChIP of BRCA1 at the indicated loci in SH-EP MYCNER or SH-EP MYCER cells treated with 4-OHT (5 h) or EtOH. Shown is the mean and error bars indicate SD of technical triplicates of one representative experiment (n=2). (Right) Immunoblot performed with the ER-antibody to detect MYCNER and MYCER in SH-EP, SH-EP MYCNER or SH-EP MYCER cells treated with 4-OHT or EtOH. CDK2 was used as loading control (n=2). h: Model illustrating our findings. We propose that BRCA1 is recruited jointly by MYCN and Ser5-phosphorylated RNAPII. BRCA1 recruitment is strongly enhanced by blockade of CDK9, which blocks pause release, and by increasing torsional stress using etoposide, suggesting that it is predominantly a stress response to stalling of RNAPII. BRCA1 in turn is required to prevent an MYCN-dependent accumulation of stalling RNAPII and R-loop formation via a mRNA de-capping complex. The critical signal in MYCN that enables recruitment of BRCA1 is the de-phosphorylation of T58, a residue that, when phosphorylated, is recognized by FBXW7 and promotes turnover of MYCN. Dephosphorylation of T58 allows binding of USP11, which stabilizes MYCN and BRCA1 on chromatin, suggesting that a kinetic competition between MYCN turnover and dephosphorylation/de-ubiquitination controls the fate of RNAPII at promoters.
Figure 1
Figure 1. Effects of MYCN on gene expression and RNAPII function.
a: Immunoblot documenting MYC and MYCNER levels in SH-EP cells. Cells were treated with 200 nM 4-OHT or EtOH for 3 h. CDK2 is loading control (n=3; in all legends, n indicates the number of independent biological replicates). b: Correlation between regulation by MYCN measured by nascent and steady-state RNA levels. 18,213 genes were binned and the mean including the 95 % confidence interval is plotted (n=3). c: Metagene plots of total RNAPII after 4-OHT treatment (3 h) for the 914 most strongly MYCN-activated (top) and 615 repressed genes (bottom). For each genomic bin, the mean is plotted and the shadow illustrates SEM. RPM: reads per million mapped reads (n=4). d: Metagene plots (mean+SEM as shadow) of RNAPII-pSer2 for MYCN-activated and -repressed genes (n=4). e: Correlation of transcriptional changes and RNAPII occupancy at promoters and transcriptional end sites (TES) after MYCNER activation. 11,093 expressed genes were binned based on log2FC. Plots show median with bootstrapped 95 % confidence intervals with 1,000 re-samplings as error bars. f: Kernel density plot regulation by MYCN of gene with promoters that have different G/C skews (strong:4,003; weak:3,381; no:1,377) (n=3). p-values were calculated with a two-tailed Wilcoxon one-sample signed-rank test with μ=0.
Figure 2
Figure 2. Status of BRCA1 in MYCN-amplified neuroblastoma cells and its MYCN-dependent recruitment to chromatin.
a: BRCA1 genomic region with average methylation status of 67 primary neuroblastomas and organoids. b: Genome browser tracks of the NCL locus upon 3 h (RNAPII and MYCN) and 5 h (BRCA1) of 4-OHT treatment (n=2). c: BRCA1 occupancy in promoter-proximal regions. 7,812 expressed genes (log2 CPM>1.28; CPM: counts per million) with a BRCA1 peak in the promoter were binned. The mean (+/- 95 % confidence interval) is shown. p-values for the difference in slopes between -OHT and +OHT were calculated using a linear model and ANCOVA. d: Position of BRCA1, MYCN and RNAPII on chromatin relative to transcriptional start sites (TSS). The heat map is sorted by the position of the MYCN-binding site. e: Quantification of proximity ligation assays documenting complex formation of BRCA1 with non-phosphorylated, Ser5- and Ser2-phosphorylated RNAPII upon activation of MYCNER (4 h). p-values were calculated using a two-tailed Wilcoxon rank-sum test (n=3). In the box plot, the central line reflects the median and the borders of the boxes show the interquartile range of the plotted data. The whiskers extend to 1.5x of the interquartile range and outliers are shown as dots. f: BRCA1 occupancy after treatment with 4-OHT or EtOH (5 h) in DMSO (top) and flavopiridol-treated (bottom) cells with SEM as shadow.
Figure 3
Figure 3. BRCA1 is required for MYCN-dependent elongation by RNAPII.
a: Metagene plots (mean+SEM as shadow) of total RNAPII after 4-OHT treatment (3 h) in control and BRCA1-depleted cells with shBRCA1#2 for 914 MYCN-activated genes (n=2). b: Correlation of gene expression (n=3) with RNAPII occupancy at promoters in control and BRCA1-depleted cells with shBRCA1#2. Genes were grouped into 30 bins (300 genes/bin) and the mean for each bin is plotted with 95 % confidence interval. c: Strand-specific DRIPc-seq data stratified by position of MYCN binding site. d: DRIP documenting R-loops at the indicated loci upon depletion of BRCA1 and activation of MYCN (4 h). Data are normalized to control (shSCR, EtOH). Shown is the mean of technical triplicates with SD (n=4). e: Density plot (mean+SEM as shadow) of DCP1A occupancy after 4-OHT treatment (5 h) in control or BRCA1-depleted cells with shBRCA1#2. f: Genome browser tracks of the TFAP4 locus show chromatin association of DCP1A in cells treated as above.
Figure 4
Figure 4. MYCN, USP11 and BRCA1 stabilize each other on chromatin.
a: Immunoblot of α-MYCN immunoprecipitates from MYCN-amplified (IMR32) neuroblastoma cells. Where indicated, EtBr (1 mg/ml) was added to the lysate to disrupt DNA-mediated interactions. The input corresponds to 1 % (n=3). b: (Left) ChIP of BRCA1 in SH-EP MYCNER cells expressing either shSCR or shUSP11 upon 4-OHT treatment (5 h). Shown is the mean and error bars indicate SD of technical triplicates (n =2). (Right) Immunoblot of cells described above. Actin is loading control (n=2). c: Immunoblots of indicated proteins after knockdown of USP11 in MYCN-amplified neuroblastoma cells. Asterisk denotes an unspecific band. Tubulin is loading control (n=3). d: Immunoblots of α-USP11 immunoprecipitates from control cells or cells expressing constitutive MYCN. CDK2 is loading control. The input corresponds to 2 % (n=2). e: Density plot of MYCN occupancy after 4-OHT treatment (3 h) in control (top) or BRCA1-depleted (bottom) cells with shBRCA1#2 around transcriptional start sites (TSS). f: Immunoblots of α-USP11 and α-MYCN immunoprecipitates from SH-EP cells stably expressing wildtype (“wt”) MYCN or T58AS62AMYCN (“mut”) as indicated. CDK2 is loading control. The input corresponds to 1 % (n=3).

References

    1. Rickman DS, Schulte JH, Eilers M. The Expanding World of N-MYC-Driven Tumors. Cancer Discov. 2018;8:150–163. doi: 10.1158/2159-8290.CD-17-0273. - DOI - PubMed
    1. Nie Z, et al. c-Myc Is a Universal Amplifier of Expressed Genes in Lymphocytes and Embryonic Stem Cells. Cell. 2012;151:68–79. doi: 10.1016/j.cell.2012.08.033. - DOI - PMC - PubMed
    1. Rahl PB, et al. c-Myc regulates transcriptional pause release. Cell. 2010;141:432–445. doi: 10.1016/j.cell.2010.03.030. - DOI - PMC - PubMed
    1. Pao GM, et al. Role of BRCA1 in brain development. Proceedings of the National Academy of Sciences of the United States of America. 2014;111:E1240–1248. doi: 10.1073/pnas.1400783111. - DOI - PMC - PubMed
    1. Kortlever RM, et al. Myc Cooperates with Ras by Programming Inflammation and Immune Suppression. Cell. 2017;171:1301–1315.:e1314. doi: 10.1016/j.cell.2017.11.013. - DOI - PMC - PubMed