. 2019 Mar;567(7749):473-478.
doi: 10.1038/s41586-019-1038-1. Epub 2019 Mar 20.

The expanding landscape of 'oncohistone' mutations in human cancers

Affiliations

The expanding landscape of 'oncohistone' mutations in human cancers

Benjamin A Nacev et al. Nature. 2019 Mar.

Abstract

Mutations in epigenetic pathways are common oncogenic drivers. Histones, the fundamental substrates for chromatin-modifying and remodelling enzymes, are mutated in tumours including gliomas, sarcomas, head and neck cancers, and carcinosarcomas. Classical 'oncohistone' mutations occur in the N-terminal tail of histone H3 and affect the function of polycomb repressor complexes 1 and 2 (PRC1 and PRC2). However, the prevalence and function of histone mutations in other tumour contexts is unknown. Here we show that somatic histone mutations occur in approximately 4% (at a conservative estimate) of diverse tumour types and in crucial regions of histone proteins. Mutations occur in all four core histones, in both the N-terminal tails and globular histone fold domains, and at or near residues that contain important post-translational modifications. Many globular domain mutations are homologous to yeast mutants that abrogate the need for SWI/SNF function, occur in the key regulatory 'acidic patch' of histones H2A and H2B, or are predicted to disrupt the H2B-H4 interface. The histone mutation dataset and the hypotheses presented here on the effect of the mutations on important chromatin functions should serve as a resource and starting point for the chromatin and cancer biology fields in exploring an expanding role of histone mutations in cancer.


Conflict of interest statement

The authors declare no competing financial interests.

Figures

Extended Data Figure 1
Extended Data Figure 1. Sample characteristics.
One sample per patient where TMB ≤ 10 mut/Mb is shown except (c) where all samples are represented regardless of TMB. a) Tumor allele frequency distribution 1452 of 1921 tumors where allele frequency is available based on publicly available data. b) Detailed tumor allele frequency distribution for the four most frequency mutated residues. Blue bars represent the median. c) TMB distribution. d) Tumor type distribution. For display purposes, the main cancer types are used in place of detailed cancer type. e) Oncoprint of the distribution of histone mutations between core families on a per patient level for all TMB and (f) for TMB ≤ 10 mut/Mb. For display purposes, H2A variants and H3.5 are not shown.
Extended Data Figure 2
Extended Data Figure 2. Validation of TMB ≤ 10 as an analysis threshold.
a) For known oncohistones, the number of mutations captured reaches a plateau at TMB > 10 mut/Mb. b) Histogram plot of H3 mutation distribution on a per patient level without a TMB threshold and (c) with a TMB ≤ 10 threshold shows enrichment of known oncohistones as well as additional mutations compared to background.
Extended Data Figure 3
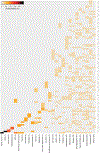
Heatmap of histone H3 mutations with individual residue labels. Color intensity indicates normalized mutation count (#mutations at residue/#samples per cancer type). Red labels indicate positions of known oncohistones. Per patient data with all TMB is plotted. The numbers of tumors sequenced is indicated following the tumor type label.
Extended Data Figure 4
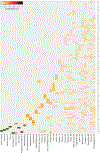
Heatmap of histone H4 mutations with individual residue labels. Color intensity indicates normalized mutation count (#mutations at residue/#samples per cancer type). Per patient data with all TMB is plotted. The numbers of tumors sequenced is indicated following the tumor type label.
Extended Data Figure 5
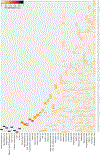
Heatmap of histone H2A mutations with individual residue labels. Color intensity indicates normalized mutation count (#mutations at residue/#samples per cancer type). Per patient data with all TMB is plotted. The numbers of tumors sequenced is indicated following the tumor type label.
Extended Data Figure 6
Heatmap of histone H2B mutations with individual residue labels. Color intensity indicates normalized mutation count (#mutations at residue/#samples per cancer type). Per patient data with all TMB is plotted. The numbers of tumors sequenced is indicated following the tumor type label.
Extended Data Figure 7
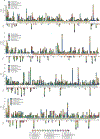
Histogram showing mutational frequency from the dataset in histones across all cancers. One tumor per patient where TMB ≤ 10 mut/Mb are shown. Boxes in the amino acid sequence show the globular domains of each histone. Amino acids with known post-translational modifications are marked in red, and the type of modification is shown by the bars below the histogram.
Extended Data Figure 8
Proximity heat-map showing distances between the most frequently mutated residues in the nucleosome structure (PDB 1kx5). Samples with TMB ≤ 10 mut/Mb and mutation counts ≥ 2.5-fold the median number of mutations/residue for the histone family are displayed. Plotted residues are shown on the axes. Numbers within the grid indicate distance in angstroms between alpha-carbons.
Extended Data Figure 9
Proximity heat-map showing distances between the most frequently mutated residues (horizontal axis) and sites of known PTMs (vertical axis). Per patient data at TMB ≤ 10 mut/Mb is shown for samples with mutation counts ≥ 2.5-fold the median mutations/residue for the histone family.
Extended Data Figure 10
Frequently mutated residues converge in three-dimensional space. Examples of residues with alpha-carbons within 11.4Å that are mutated ≥ 2.5 fold over the median count/residue for each histone family when a TMB ≤ 10 mutations/Mb threshold is applied. Residues of interest are mapped on the nucleosome structure (PDB 1KX5).
Figure 1
Figure 1. Histones as signal integrators and cancer driver genes.
a) Chromatin integrates environmental and developmental signals to control essential cell processes, including those dysregulated in cancer. b) Mechanisms and cancer type associations for known H3 oncohistone mutations.
Figure 2
Figure 2. Cancer-associated histone mutations occur at sites of known PTMs and in both tail and globular domains.
a) The most prevalent somatic missense histone mutations for each core histone. Green bars, sites of known PTMs; orange lettering, residue in the ‘Sin’ patch; red lettering, acidic patch residue. b) The 10 most frequently mutated residues in each core histone family shown in green/red; red labels, established oncohistone mutations. Globular domains are indicated by orange, blue, red, and green bars per color histone convention; purple bars, ‘Sin’ patch. Type of PTMs are indicated below the domain structure schematic. See Extended Data Figure 7 for PTM legend.
Figure 3
Figure 3. Hypothesis generating classes of histone mutations.
a) Histone mutations occur in the ‘Sin-’ patch. Boxes indicate alpha-helices. Classical yeast mutations are shown. b) Residues of the acidic patch (shown) are mutated in tumors. *Indicates amino acids with mutation counts ≥ 2.5-fold the median number of mutations for the core histone family. c) Mapping of three-dimensional proximity of residues mutated ≥ 2.5 fold over median mutation count/residue for each histone family on the nucleosome structure (PDB 1KX5). Globular domains are shaded in darker hues, Sin- patches in purple, and acidic patches in red. Bar height indicates mutation count. Thick black lines indicate alpha-carbon distance between 3.8 and 7.6Å and think grey lines indicate 7.6 to 11.4Å. Intra-molecular proximities are indicated by colored lines and only select residues are labeled for clarity of display. d) The H2B-H4 interface is mediated by hydrogen bonding between H2BE76, H4D68 and H4R92, as well as a salt bridge between H2BE71 and H4K91. These residues exhibit high mutational frequency except H4K91. e) Glutamic acid residues are frequently mutated to lysines or glutamines, which can serve as substrates for acetylation or function as acetyl mimics, respectively.
Figure 4
Figure 4. A model for the impact of oncohistones on the chromatin polymer.
By incorporation into the chromatin polymer, mutated histone proteins (oncohistones, in red) may cause functional effects by altering the biophysical and/or functional properties of chromatin. We propose these effects will occur when the mutant histone is present even at low concentrations and that mutating even one of many histone gene copies can have dominant effects.

References

    1. Luger K, Mäder a W., Richmond RK, Sargent DF & Richmond TJ Crystal structure of the nucleosome core particle at 2.8 A resolution. Nature 389, 251–260 (1997). - PubMed
    1. Allis CD, Jenuwein T & Reinberg D Epigenetics Cold Spring Harb. Lab. Press. Cold Spring Harb; New York: (2007).
    1. Strahl BD & Allis CD The language of covalent histone modifications. Nature 403, 41–45 (2000). - PubMed
    1. Jenuwein T & Allis CD Allis: Translating the histone code. Science 293, 1074–1080 (2001). - PubMed
    1. Shen H & Laird PW Interplay between the cancer genome and epigenome. Cell 153, 38–55 (2013). - PMC - PubMed

Publication types