. 2019 Mar;567(7749):479-485.
doi: 10.1038/s41586-019-1032-7. Epub 2019 Mar 20.

Neoantigen-directed immune escape in lung cancer evolution

Collaborators, Affiliations

Neoantigen-directed immune escape in lung cancer evolution

Rachel Rosenthal et al. Nature. 2019 Mar.

Abstract

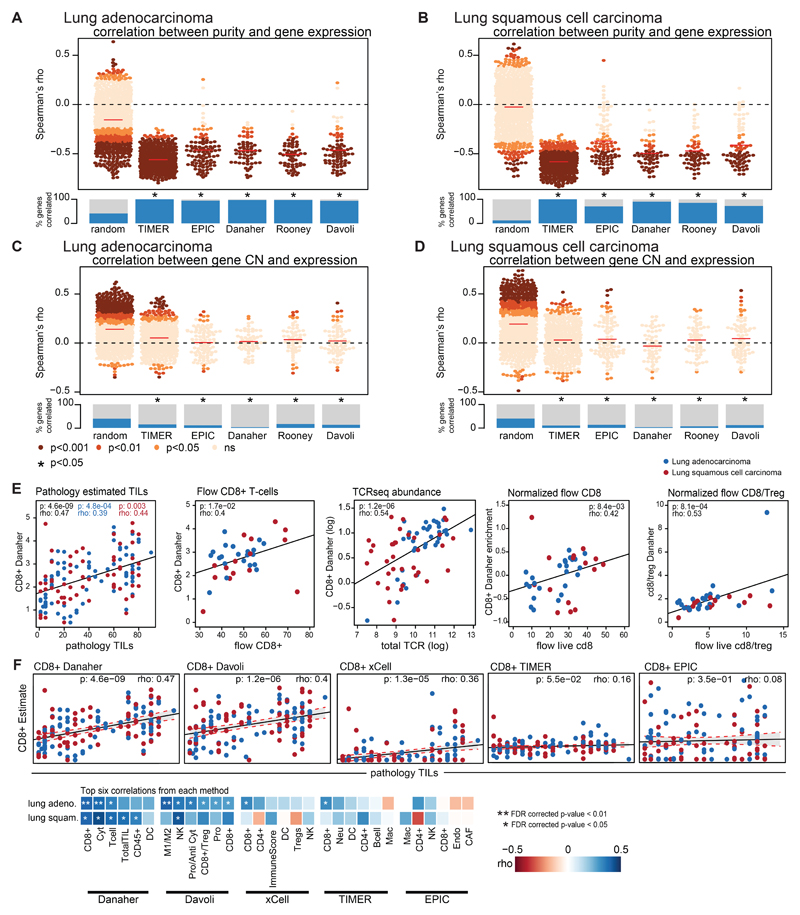
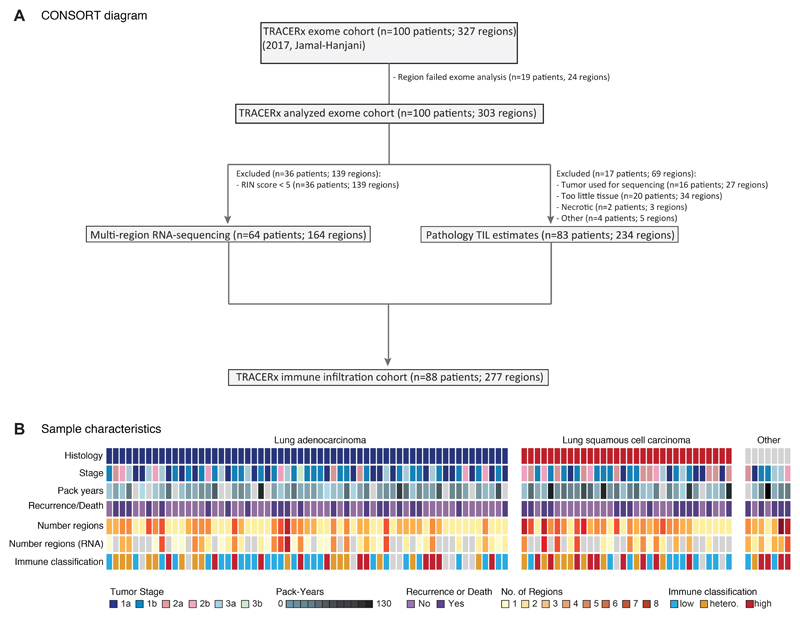
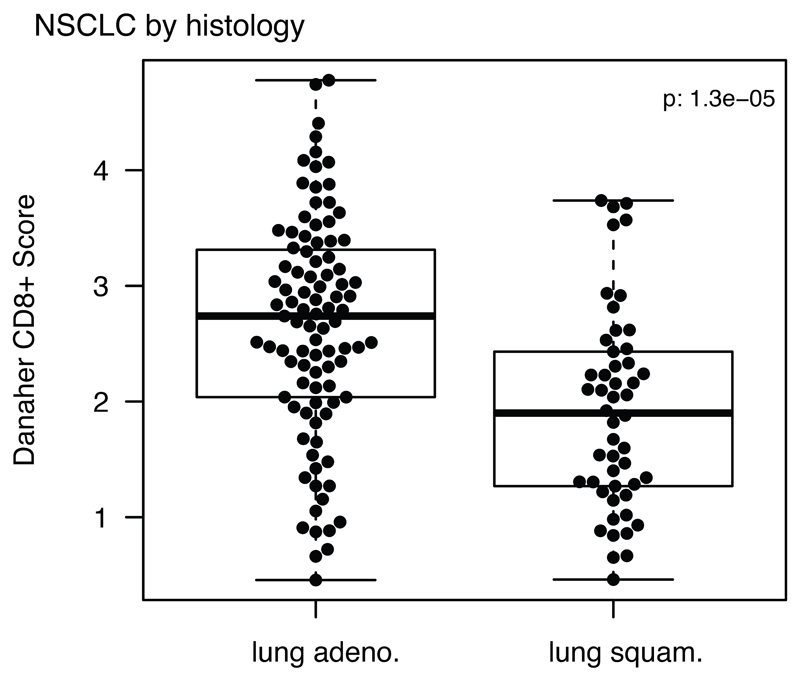
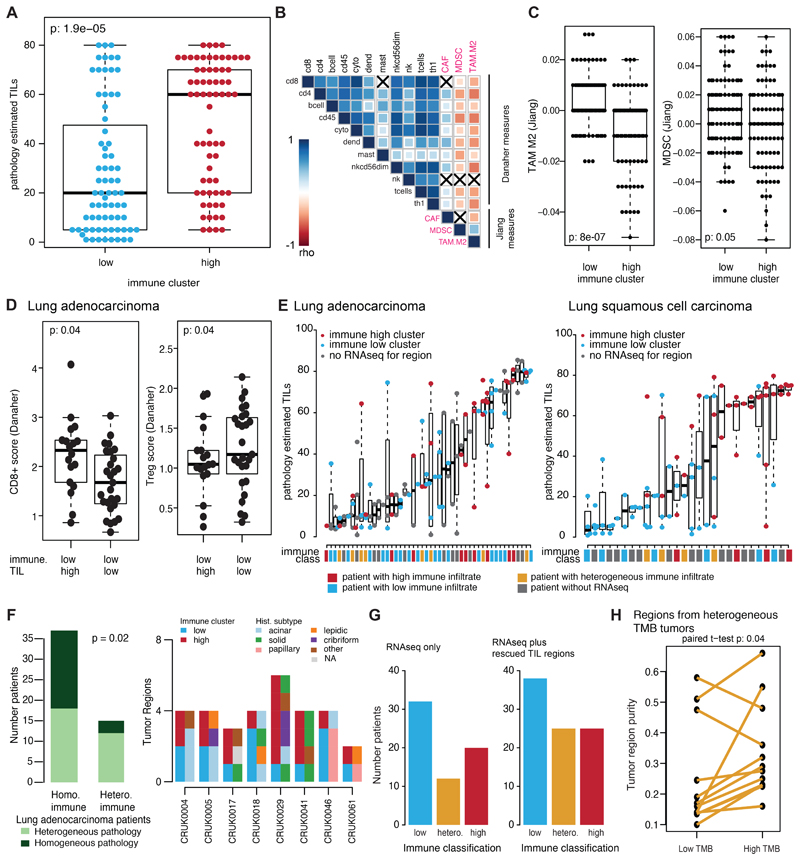
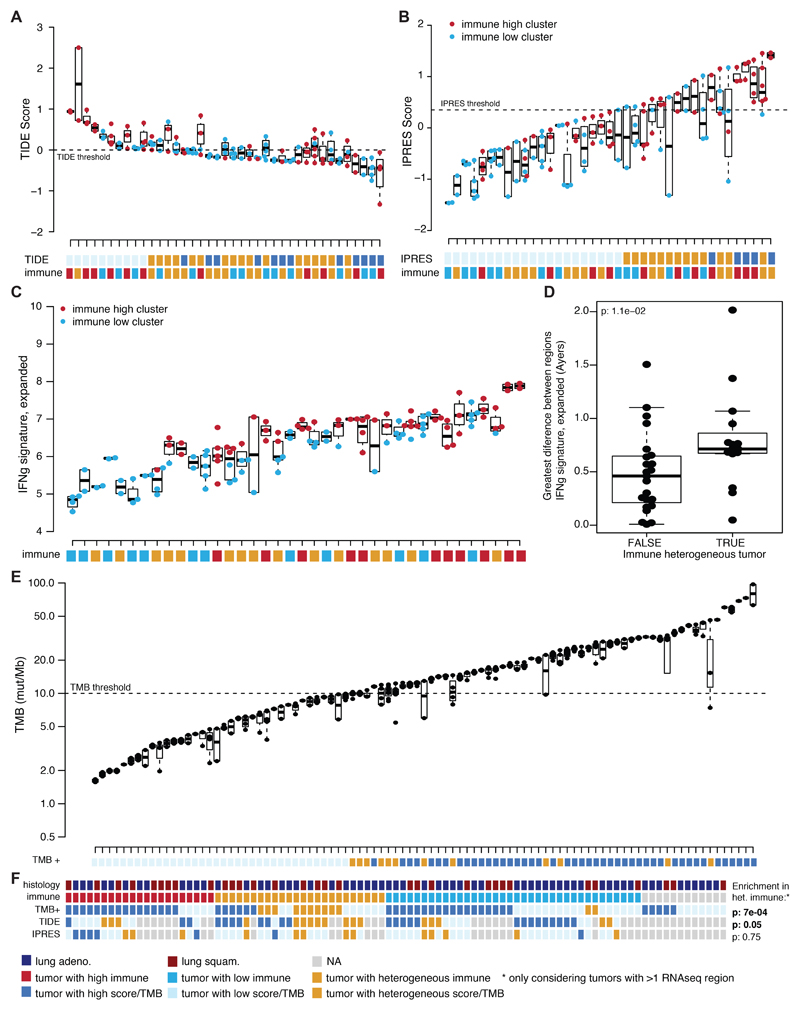
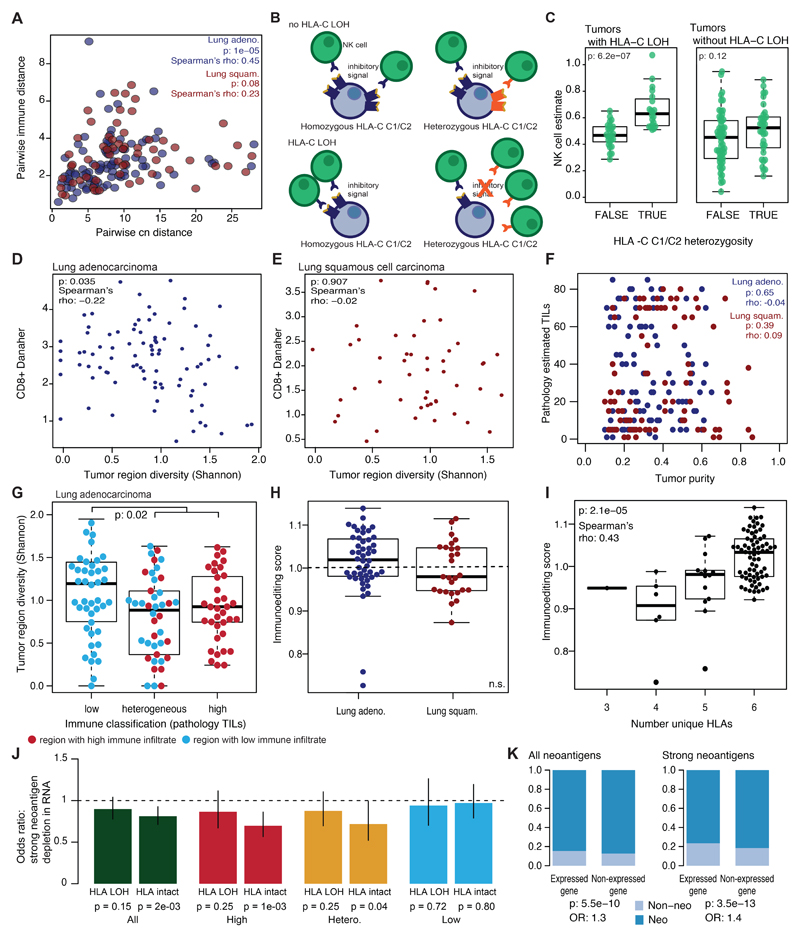
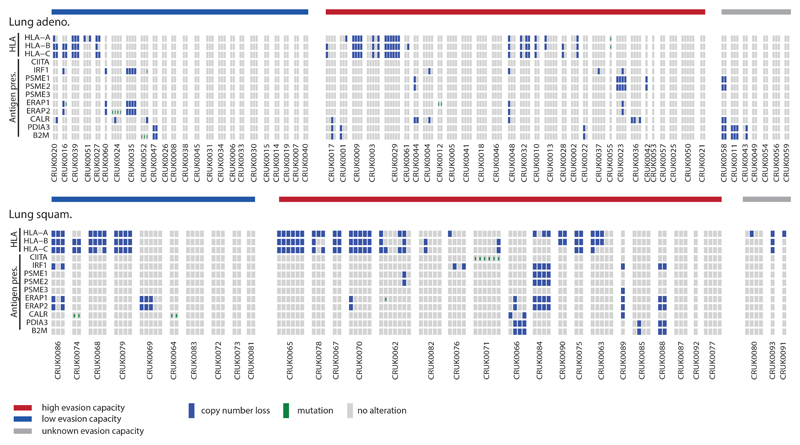
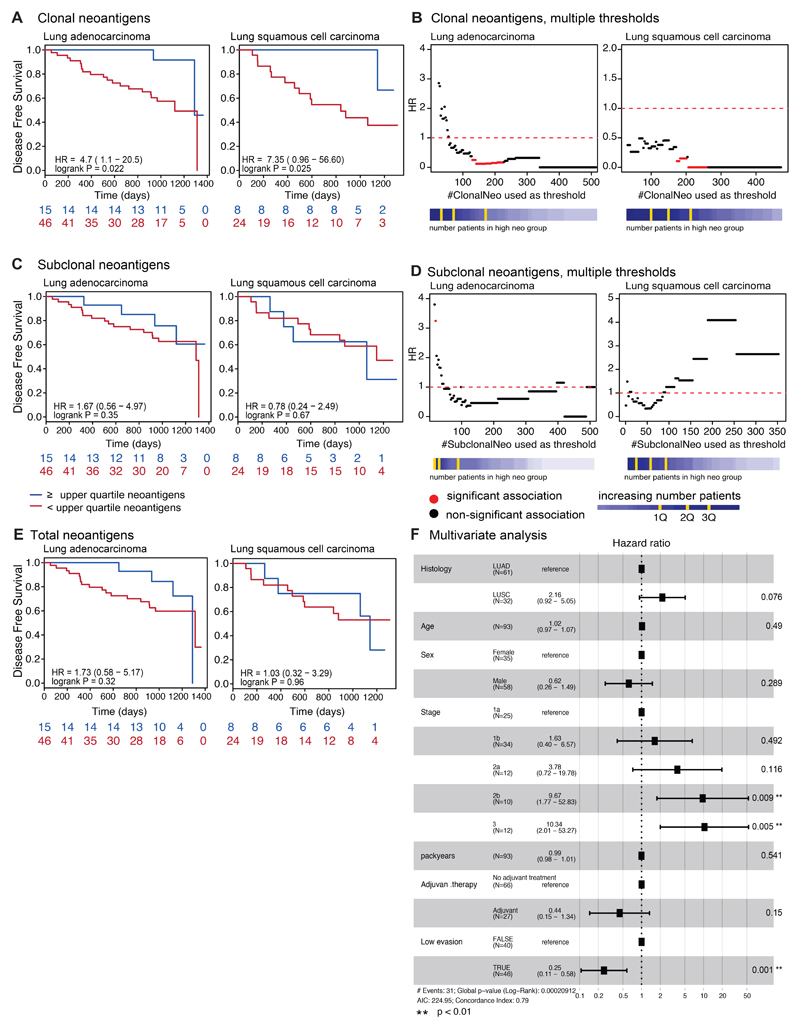
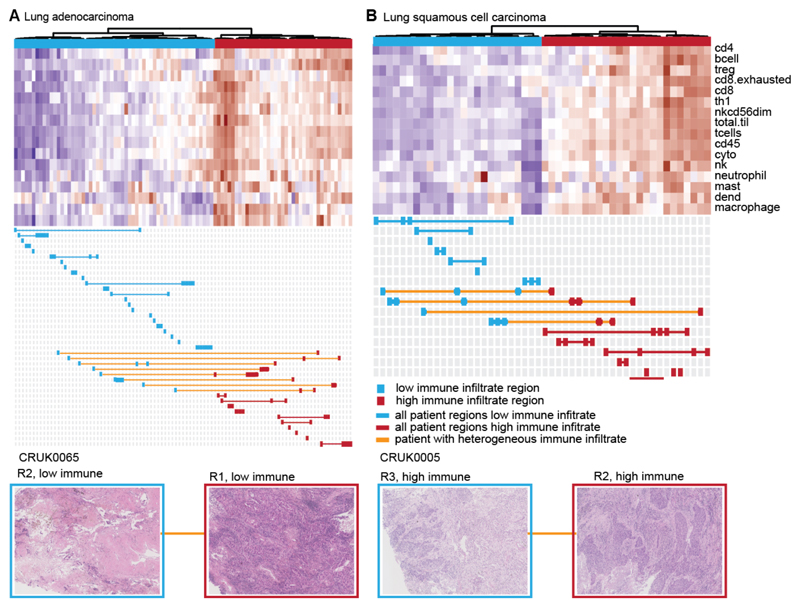
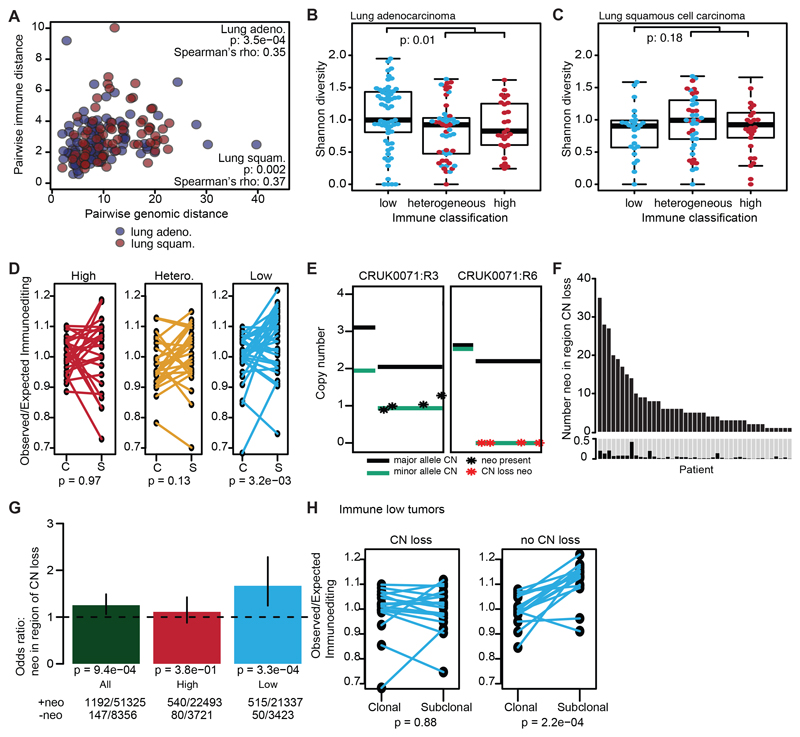
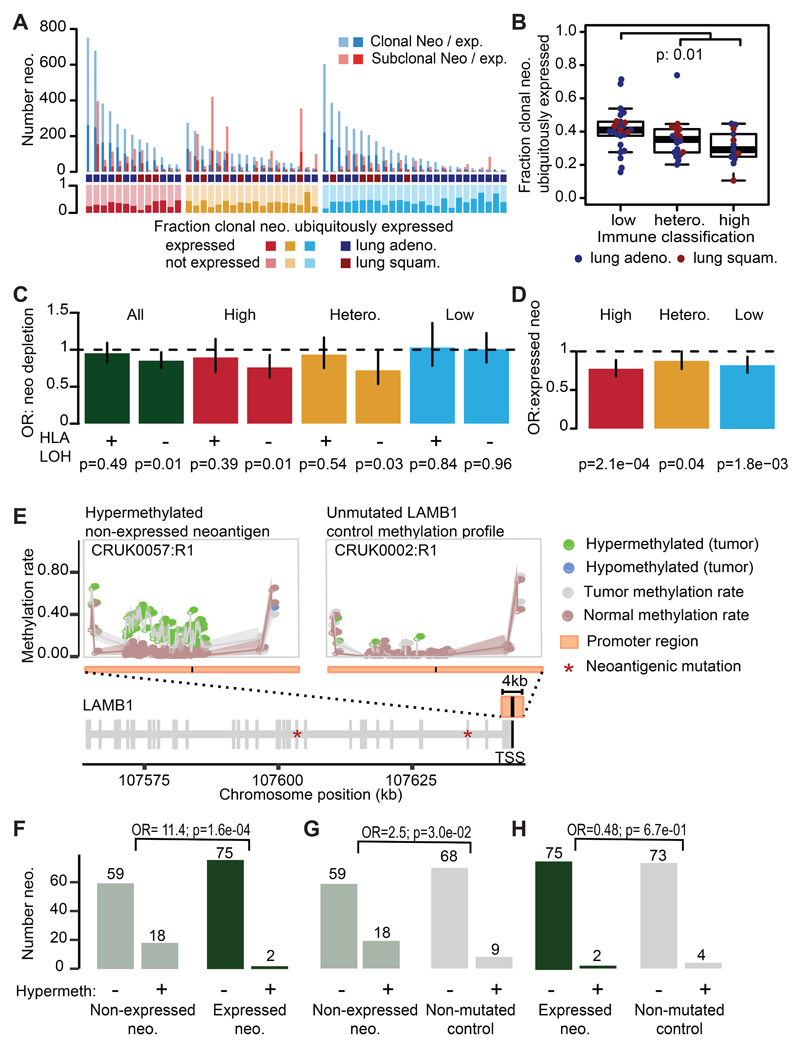
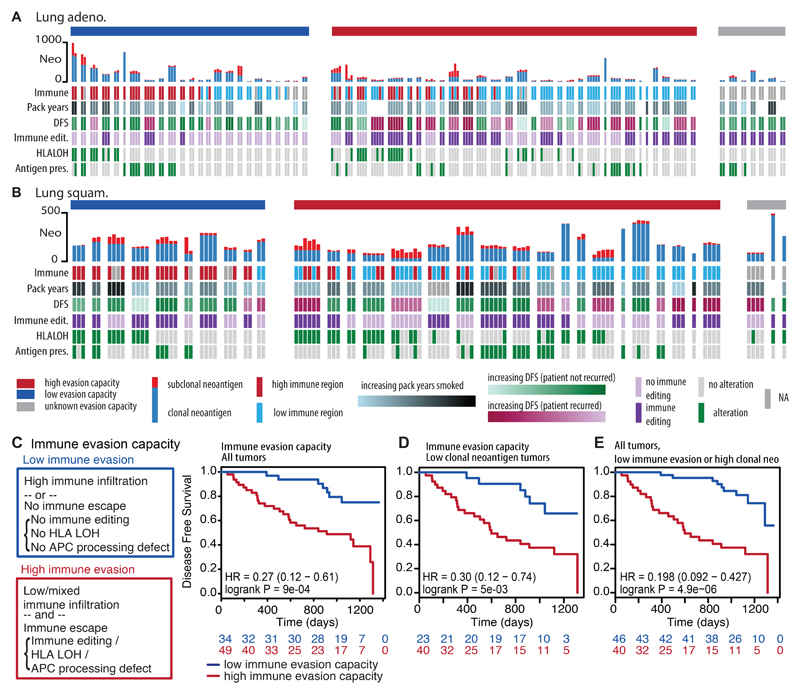
The interplay between an evolving cancer and a dynamic immune microenvironment remains unclear. Here we analyse 258 regions from 88 early-stage, untreated non-small-cell lung cancers using RNA sequencing and histopathology-assessed tumour-infiltrating lymphocyte estimates. Immune infiltration varied both between and within tumours, with different mechanisms of neoantigen presentation dysfunction enriched in distinct immune microenvironments. Sparsely infiltrated tumours exhibited a waning of neoantigen editing during tumour evolution, indicative of historical immune editing, or copy-number loss of previously clonal neoantigens. Immune-infiltrated tumour regions exhibited ongoing immunoediting, with either loss of heterozygosity in human leukocyte antigens or depletion of expressed neoantigens. We identified promoter hypermethylation of genes that contain neoantigenic mutations as an epigenetic mechanism of immunoediting. Our results suggest that the immune microenvironment exerts a strong selection pressure in early-stage, untreated non-small-cell lung cancers that produces multiple routes to immune evasion, which are clinically relevant and forecast poor disease-free survival.


Conflict of interest statement

The authors declare competing financial interests: C.S. receives grant support from Pfizer, AstraZeneca, BMS, and Ventana. C.S. has consulted for Boehringer Ingelheim, Eli Lily, Servier, Novartis, Roche-Genentech, GlaxoSmithKline, Pfizer, BMS, Celgene, AstraZeneca, Illumina, and Sarah Cannon Research Institute. C.S. is a shareholder of Apogen Biotechnologies, Epic Bioscience, GRAIL, and has stock options and is co-founder of Achilles Therapeutics. S.A.Q. is a co-founder of Achilles Therapeutics. R.R., N.M., and G.A.W. have stock options and have consulted for Achilles Therapeutics.

Figures

Extended Data Fig. 1
Extended Data Fig. 1. Determination of robust immune infiltration approach.
(A-D) The expression of the genes used in the each of the immune signature definitions is correlated against tumor purity (A-B) and tumor copy number (C-D). Plotted are random genes (n=1000), TIMER genes (n=575), EPIC genes (n=98), Danaher genes (n=60), Rooney genes (n=100), and Davoli genes (n=75). The Spearman’s rho value of the correlation is plotted for the immune genes comprising each signature definition, colored by the p-value of the association. The comparisons are performed separately for lung adenocarcinoma and lung squamous cell carcinoma. The median rho value for the immune signature set is indicated by the red line. The fraction of genes whose expression value is significantly correlated with purity or tumor copy number is shown and compared to a set of random genes. For every immune signature considered, there was significant enrichment of genes whose expression negatively correlated with tumor purity as compared to the random selection of genes and a significant enrichment of genes whose expression positively correlated with tumor copy number as compared to the random selection of genes. (E) Scatterplots show the Spearman correlation between TIL scores and CD8+ T-cells as measured by the Danaher approach (n=140), between flow CD8+ T-cell estimates and Danaher CD8+ T-cells (n=36), TCRseq abundance and Danaher CD8+ T-cells (n=72), normalized live flow CD8+ T-cell estimates and Danaher CD8+ T-cells (n=39), and normalized live flow CD8+ T-cell/Treg and Danaher CD8+/Treg estimates (n=38). Blue dots indicate regions from a lung adenocarcinoma tumor, red dots indicate regions from a lung squamous cell carcinoma tumor. Spearman rho values, p-values, and 95% CI (shaded area) are given for all tumor regions (black), lung adenocarcinoma tumor regions (blue), and lung squamous cell carcinoma tumor regions (red). (F) A scatterplot showing the correlation between pathology TIL estimates and CD8+ estimates from each of the immune infiltration methods is shown (n=140). Lung adenocarcinoma tumor regions are shown in blue; lung squamous cell carcinoma tumor regions are shown in red. Below, the top six correlations between pathology TIL estimates and an immune cell subset is shown for each method. Blue boxes indicate positive correlation, whereas red boxes indicate negative correlation. P-values were FDR corrected. (G) Example of CD8 T-cell quantification in a representative TRACERx TIL sample. TILs were isolated from tumor regions of surgical resections as previously described and cryopreserved. Thawed samples were stained with a custom-designed 20-marker antibody panel to measure T cell activation, dysfunction and differentiation by flow cytometry.
Extended Data Fig. 2
Extended Data Fig. 2. TRACERx 100 sample selection and patient characteristics.
(A) CONSORT diagram showing the selection of TRACERx 100 patients for RNAseq and/or pathology TIL analysis. (B) Patient characteristics for the TRACERx 100 cohort are shown. Patient characteristics can be found in tabular form in Table S1.
Extended Data Fig. 3
Extended Data Fig. 3. Difference in immune infiltration by histology.
The distribution of Danaher estimated CD8+ T-cell infiltrate is displayed for lung adenocarcinomas (adeno.) and lung squamous cell carcinomas (squam.) (n=145). Minima and maxima indicated by extreme points of boxplot. Median indicated by thick horizontal line. First and third quartiles indicated by box edges. A two-sided Wilcoxon rank-sum test is used.
Extended Data Fig. 4
Extended Data Fig. 4. Rescuing regions without RNAseq using pathology TILs.
(A) The difference in pathology TIL estimates is shown by RNAseq-derived immune cluster (n=139). (B) All regional pathology estimated TILs are plotted for each tumor sample (lung adenocarcinoma n=121; lung squamous cell carcinoma n=90). If a region also had RNAseq information available, the immune cluster that region belonged to is also shown as immune high (red) or immune low (blue). Immune clusters for tumor regions without RNAseq are annotated as grey. The immune class for the patients is also provided as high (red), low (blue), heterogeneous (orange), or unknown (grey). For all boxplots, minima and maxima indicated by extreme points of the plot. Medians are indicated by thick horizontal line. First and third quartiles are indicated by box edges. A two-sided Wilcoxon rank-sum test is used for comparisons. (C) The number of patients in each immune classification is plotted as inferred from using RNAseq data alone or by also incorporating pathology TIL estimates. (D) A correlation matrix of the Danaher immune cell estimates with the Jiang immunosuppressive cell subsets is shown (Spearman’s test). Positive correlations are indicated in blue and negative correlations are indicated in red. Correlations are significant unless marked with a black X. (E) The Jiang immune infiltration estimates are shown for TAM M2 (tumor associated macrophage M2) and MDSC (myeloid-derived suppressor cells) cells split by immune cluster (n=163). (F) The tumor purity is shown for the low tumor mutational burden (TMB) and high TMB regions of every tumor with heterogeneous TMB (n=12) Two-sided paired t-test is used for comparison. No corrections were made for multiple comparisons.
Extended Data Fig. 5
Extended Data Fig. 5. Heterogeneity of biomarkers predicting checkpoint blockade response.
(A) The TIDE gene signature score of each tumor region is shown per patient for patients with >1 region available (n=39). Using threshold defined by (dashed line), patients are classified as having low TIDE (light blue), high TIDE (dark blue), or heterogeneous TIDE (orange). (B) The IPRES gene signature score of each tumor region is shown per patient for patients with >1 region available (n=39). Using threshold defined by Hugo et al. (dashed line), patients are classified as having low IPRES (light blue), high IPRES (dark blue), or heterogeneous IPRES (orange). (C) The expanded Ayers IFN signature is shown for each tumor region per patient for patients with >1 region available (n=38). For (A-C) the immune classification of the patient is also given. (D) The greatest difference in expanded Ayers IFN signature between tumor regions from the same tumor is plotted according to whether the tumor has heterogeneous immune infiltration or not (n=38). A two-sided Wilcoxon rank-sum test is used for comparison. (E) Tumor mutational burden (TMB) of each tumor region is shown per patient (n=93). Using a 10 mutations/mB threshold (dashed line), patients are classified as having low TMB (light blue), high TMB (dark blue), or heterogeneous TMB (orange). For all boxplots, minima and maxima indicated by extreme points of the plot. Medians are indicated by thick horizontal line. First and third quartiles are indicated by box edges. (F) A summary of the tumor histology, immune classification, TMB status, TIDE category, and IPRES category is shown for each tumor (n=93). There is an enrichment for heterogeneously immune infiltrated tumors to have heterogeneous TMB status and heterogeneous TIDE scores (Fisher’s exact test). No corrections were made for multiple comparisons.
Extended Data Fig. 6
Extended Data Fig. 6. Relationship between immune infiltration and tumor region diversity.
(A) The pairwise copy number (cn) and immune distances between every two tumor regions from the same patient are compared for lung adenocarcinoma (n=91) and lung squamous cell carcinoma (n=60). (B-C) For each tumor region, the CD8+ T-cell score is plotted against the Shannon diversity score. Lung adenocarcinomas (n=89) (B) and lung squamous cell carcinomas (n=50) (C) are shown. (D) The correlation between pathology TIL estimates and tumor purity is shown for lung adenocarcinoma (n=120) (blue) and lung squamous cell carcinoma (n=90) (red) regions. No relationship for either histology is observed. Spearman’s test is used to determine relationship. (E) The Shannon diversity score per lung adenocarcinoma tumor region (n=137) is plotted by immune classification as determined solely by pathology TIL estimates. A two-sided Wilcoxon rank-sum test is used for comparison. (F) A comparison of observed/expected immunoediting score between lung adenocarcinoma and lung squamous cell carcinoma tumors (n=92) is shown. A two-sided Wilcoxon rank-sum test is used for comparison. (G) The observed/expected immunoediting score is shown by number of unique HLAs present in the tumor (patients heterozygous at HLA-A, -B, and -C will have six unique HLA alleles) (n=90). For all boxplots, minima and maxima indicated by extreme points of the plot. Medians are indicated by thick horizontal line. First and third quartiles are indicated by box edges. (H) The odds ratio and 95% CI of transcriptional neoantigen depletion is shown for strongly binding neoantigens, calculated with Fisher’s exact test. Values <1 indicate that putative neoantigens are less likely to be expressed as compared to non-synonymous mutations that are not putative neoantigens. Tumors are broken down by HLA LOH status and their immune classification. (I) The enrichment for neoantigens and strongly binding neoantigens to occur in non-expressed genes as compared to non-synonymous non-neoantigens is shown, calculated with Fisher’s exact test. No corrections were made for multiple comparisons.
Extended Data Fig. 7
Extended Data Fig. 7. Components of immune evasion mechanisms in NSCLC.
(A) Each of the potential immune evasion mechanisms explored in Figure 4 are shown broken down by their component genes. Patients are split according to their immune evasion capacity status. Copy number losses are shown in blue and mutations are shown in green. (B) A schematic of how LOH of the HLA-C locus in HLA-C1/C2 heterozygous tumors may lead to NK cell-mediated destruction is shown. (C) The level of Danaher estimated NK cell infiltration / Total TIL estimate is shown for tumor regions with (n=45) and without (n=90) HLA-C LOH according to their HLA-C1/C2 heterozygosity status. A two-sided Wilcoxon rank-sum test is used for comparison.
Extended Data Fig. 8
Extended Data Fig. 8. Relationship between clonal neoantigen burden, immune infiltration, and patient prognosis.
(A, C, E) Kaplan-Meier curves are shown for lung adenocarcinoma and lung squamous cell carcinoma. The curves are split based on the upper quartile of clonal neoantigen burden (A), on the upper quartile of subclonal neoantigen burden (C), and on the upper quartile of total neoantigen burden (E). For all survival curves, the number of patients in each group for every time point is indicated below the time point and significance is determined using a log-rank test. (B, D) The hazard ratio is shown for each threshold value of clonal neoantigen (B) and subclonal neoantigen (D) load, indicating that a high clonal neoantigen burden remains significantly prognostic across a wide range of thresholds. Significant associations are indicated in red, whereas non-significant associations are plotted in black. (F) Both clonal neoantigen load and immune infiltration classification are incorporated in a multivariate analysis, becoming more significant when the variables are combined as compared to either metric individually. Other tumor and clinical characteristics are also controlled for in the multivariate analysis. Hazard ratios of each variable with a 95% CI are shown on the horizontal axis. Significance is calculated using a Cox proportional hazards model. All statistical tests were two-sided.
Figure 1
Figure 1. Heterogeneity of immune infiltration in NSCLC.
(A-B) TRACERx regions from lung adenocarcinoma (A) and lung squamous cell carcinoma (B) are shown, clustered by the level of estimated immune infiltrate. Each row represents an immune cell population, as estimated by the Danaher method. Immune populations are: B cells, CD4+ T-cells, CD8+ T-cells, exhausted CD8+ T-cells, helper T-cells, regulatory T-cells, CD45+ cells, NK cells, NK CD56- cells, dendritic cells, mast cells, macrophages, neutrophils, cytotoxic cells, total T-cells, and total TIL score. Each column represents a tumor region. Regions classified as having low immune infiltration are shown in blue, whereas regions classified as having high immune infiltration are shown in red. If all regions from a patient’s tumor are classified as low immune, that patient is indicated in blue. If all regions from a patient’s tumor are classified as high immune, that patient is indicated in red. Patients with tumors containing heterogeneous immune infiltration are indicated in orange. Below each heatmap, example pathology images from heterogeneous tumors are shown to display a region of high immune infiltration and a region of low immune infiltration from the same tumor.
Figure 2
Figure 2. Immune editing at the DNA level.
(A) Pairwise genomic and immune distances between every two tumor regions from the same patient are compared (lung adeno: p=3.5e-04, n=217 lung squam: p=0.002, n=186). (B-C) The Shannon diversity index for each tumor region is shown grouped by immune classification. Lung adenocarcinomas (n=159) (B) and lung squamous cell carcinomas (n=103) (C) are shown. Minima and maxima indicated by extreme points of boxplot. Median indicated by thick horizontal line. First and third quartiles indicated by box edges. A two-sided Wilcoxon rank-sum test is used. (D) The change in the observed/expected immunoediting score from clonal (C) to subclonal (S) is shown for each immune classification (high, n=24; hetero., n=25; low, n=33). A two-sided paired t-test is used. (E) Example of historically clonal neoantigens loss by subclonal copy number event. Neoantigens present in CRUK0071:R3 on one copy are shown in one panel (black). These neoantigens are lost in CRUK0071:R6 (red). (F) The number of historically clonal neoantigens on a region of copy number loss are shown per tumor. Below shows the proportion of clonal neoantigens lost subclonally through a copy number event. (G) The odds ratio and 95% CI of copy number neoantigen depletion is shown, calculated with Fisher’s exact test. Values >1 indicate neoantigens are more likely to be in regions of subclonal copy number loss as compared to non-synonymous mutations that are not neoantigens. Tumor regions are classified by immune cluster. (H) The change in immunoediting score is shown for immune low tumors by whether any neoantigens are subclonally lost through copy number events (CN-loss, n=17; no-CN-loss, n=16). A two-sided paired t-test is used. No corrections were made for multiple comparisons.
Figure 3
Figure 3. Transcriptional neoantigen depletion.
(A) The patient-level number of clonal and subclonal expressed neoantigens is shown. The fraction of clonal neoantigens that are ubiquitously detected is plotted below. The immune class is provided as high (red), low (blue), or heterogeneous (orange). (B) The fraction of clonal neoantigens that are ubiquitously detected in every region is plotted by immune classification of the tumor (n=63). Minima and maxima indicated by extreme points of boxplot. Median indicated by thick horizontal line. First and third quartiles indicated by box edges. A two-sided Wilcoxon rank-sum test is used. (C) The odds ratio and 95% CI of transcriptional neoantigen depletion is shown, calculated with Fisher’s exact test. Values <1 indicate that putative neoantigens are less likely to be expressed as compared to non-synonymous mutations that are not putative neoantigens. Tumors are plotted by HLA LOH status and immune classification. (D) The odds ratio and 95% CI of a neoantigen occurring in a gene that is consistently expressed among TCGA NSCLC tumors is shown, calculated with Fisher’s exact test. (E) CpG-methylation patterns across the LAMB1 promoter in tumor samples CRUK0057:R1 and CRUK0002:R1 and their matched normals. The locus encodes two non-expressed neoantigens and exhibits hypermethylation in CRUK0057:R1. The purity/ploidy-matched unmutated control sample CRUK0002:R1 shows no differential methylation. (F-H) Numbers of (non)-hypermethylated gene promoters for (F) expressed vs. non-expressed neoantigens, (G) non-expressed neoantigens vs. the same genes in purity/ploidy-matched controls and (H) non-expressed neoantigens vs. the same genes in purity/ploidy-matched controls. Odds ratios (OR) and p-values (χ2-test) are shown for each comparison. No corrections were made for multiple comparisons.
Figure 4
Figure 4. Immune evasion capacity in early-stage non-treated NSCLC.
(A-B) The number of clonal and subclonal neoantigens found in the tumor region, immune cluster, patient prognosis, immunoediting classification, HLA LOH status, and antigen presentation defects are plotted for every tumor region for each tumor. Patients are split according to their immune evasion capacity. (C) Immune evasion capacity is determined by the level of immune infiltration and presence of immune escape mechanisms. Patients whose tumors have low immune evasion capacity have prolonged disease-free survival times. (D) A Kaplan Meier curve is shown for tumors with low clonal neoantigen burden (lowest three quartiles) split by their immune evasion capacity. (E) A Kaplan Meier curve is shown that combines clonal neoantigen load (upper quartile) and immune evasion capacity. For all survival curves, the number of patients in each group for every time point is indicated below the time point and significance is determined using a two-sided log-rank test.

Comment in

Similar articles

Cited by

References

    1. Galon J, et al. Type, density, and location of immune cells within human colorectal tumors predict clinical outcome. Science (New York, N.Y. 2006;313:1960–1964. doi: 10.1126/science.1129139. - DOI - PubMed
    1. Charoentong P, et al. Pan-cancer Immunogenomic Analyses Reveal Genotype-Immunophenotype Relationships and Predictors of Response to Checkpoint Blockade. Cell reports. 2017;18:248–262. doi: 10.1016/j.celrep.2016.12.019. - DOI - PubMed
    1. Zhang AW, et al. Interfaces of Malignant and Immunologic Clonal Dynamics in Ovarian Cancer. Cell. 2018;173:1755–1769.e1722. doi: 10.1016/j.cell.2018.03.073. - DOI - PubMed
    1. Milo I, et al. The immune system profoundly restricts intratumor genetic heterogeneity. Sci Immunol. 2018;3 doi: 10.1126/sciimmunol.aat1435. - DOI - PubMed
    1. Jamal-Hanjani M, et al. Tracking the Evolution of Non-Small-Cell Lung Cancer. The New England journal of medicine. 2017;376:2109–2121. doi: 10.1056/NEJMoa1616288. - DOI - PubMed

Publication types

MeSH terms

Substances