. 2019 Mar 6:10:334.
doi: 10.3389/fimmu.2019.00334. eCollection 2019.

Naive and Stem Cell Memory T Cell Subset Recovery Reveals Opposing Reconstitution Patterns in CD4 and CD8 T Cells in Chronic Graft vs. Host Disease

Affiliations

Naive and Stem Cell Memory T Cell Subset Recovery Reveals Opposing Reconstitution Patterns in CD4 and CD8 T Cells in Chronic Graft vs. Host Disease

Maria V Soares et al. Front Immunol. .

Abstract

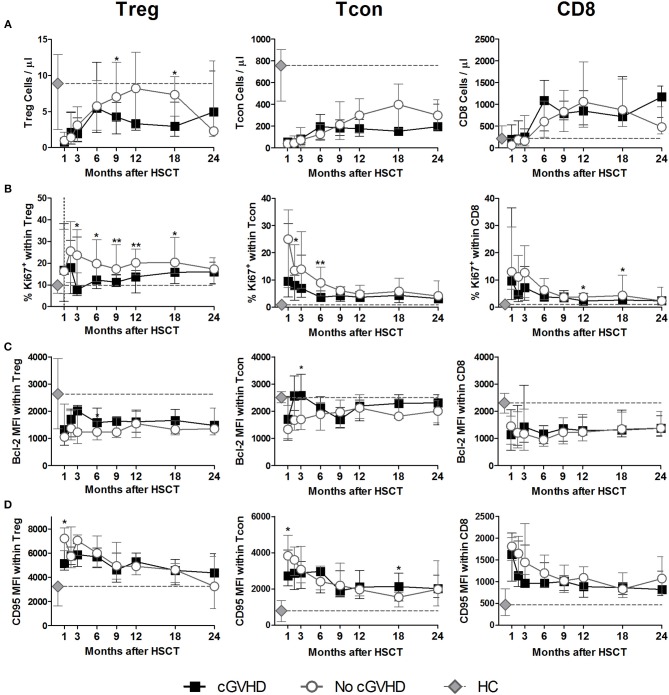
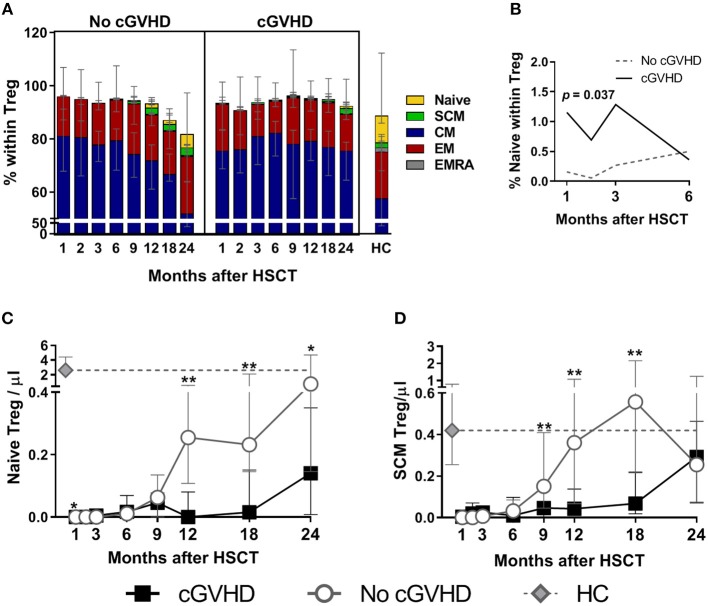
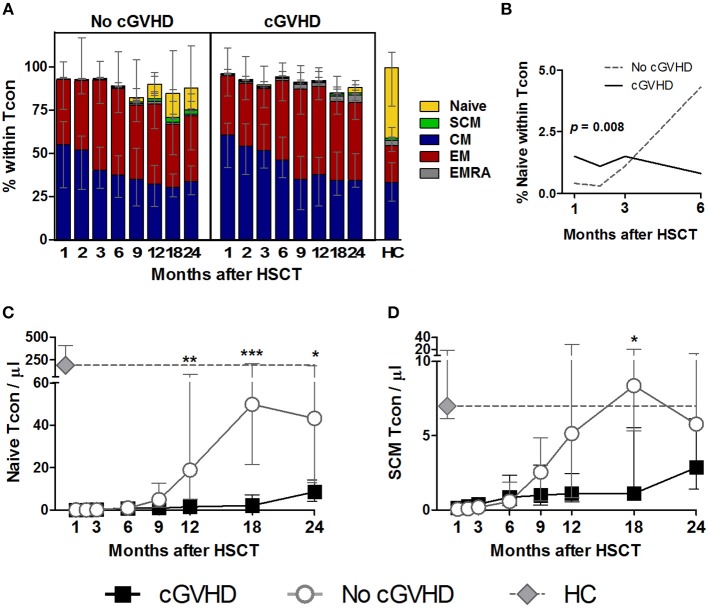
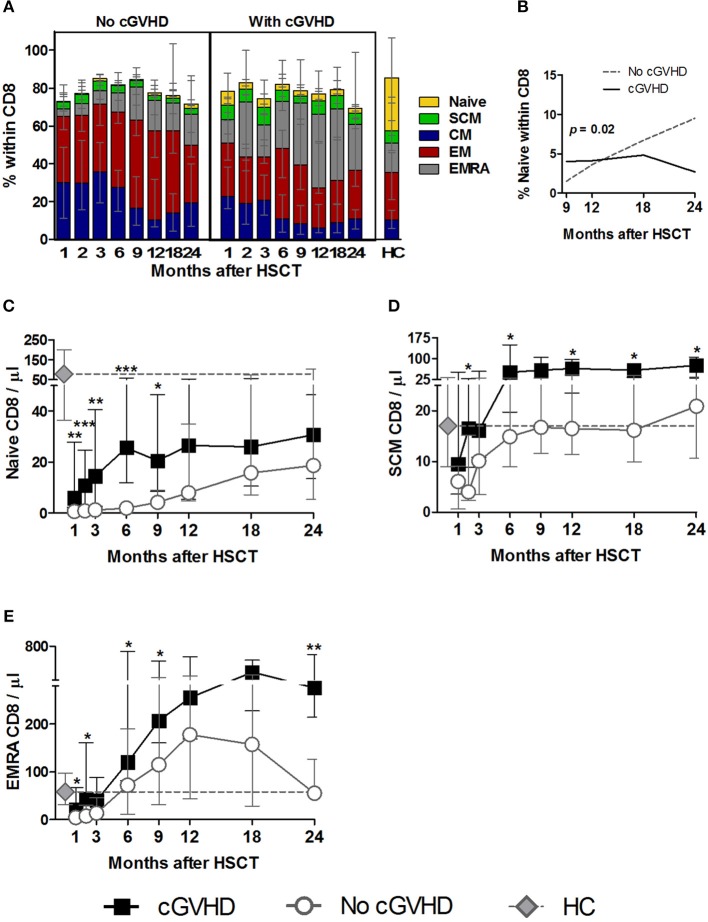
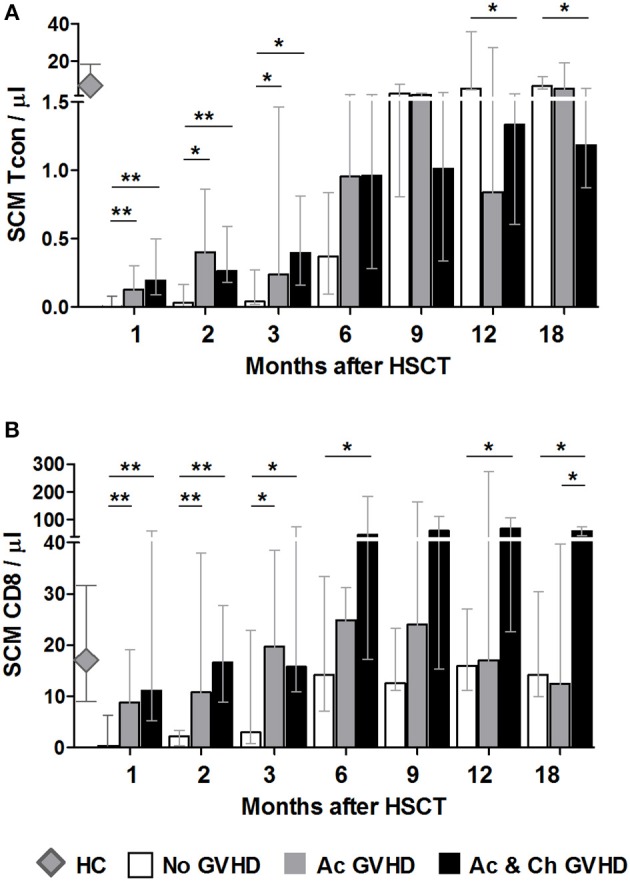
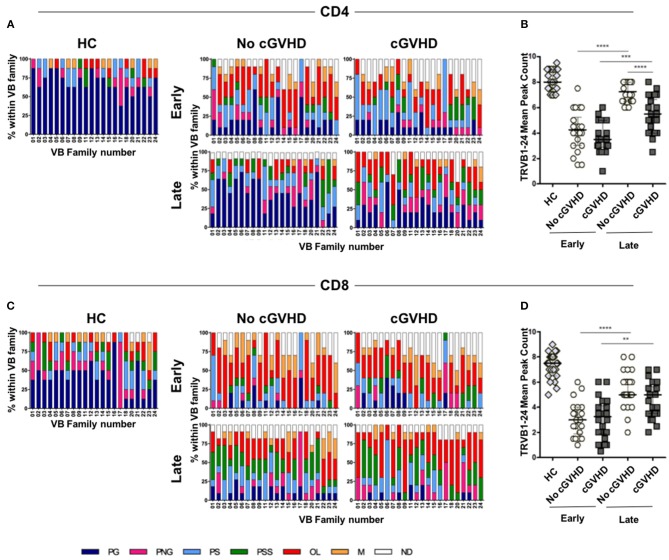
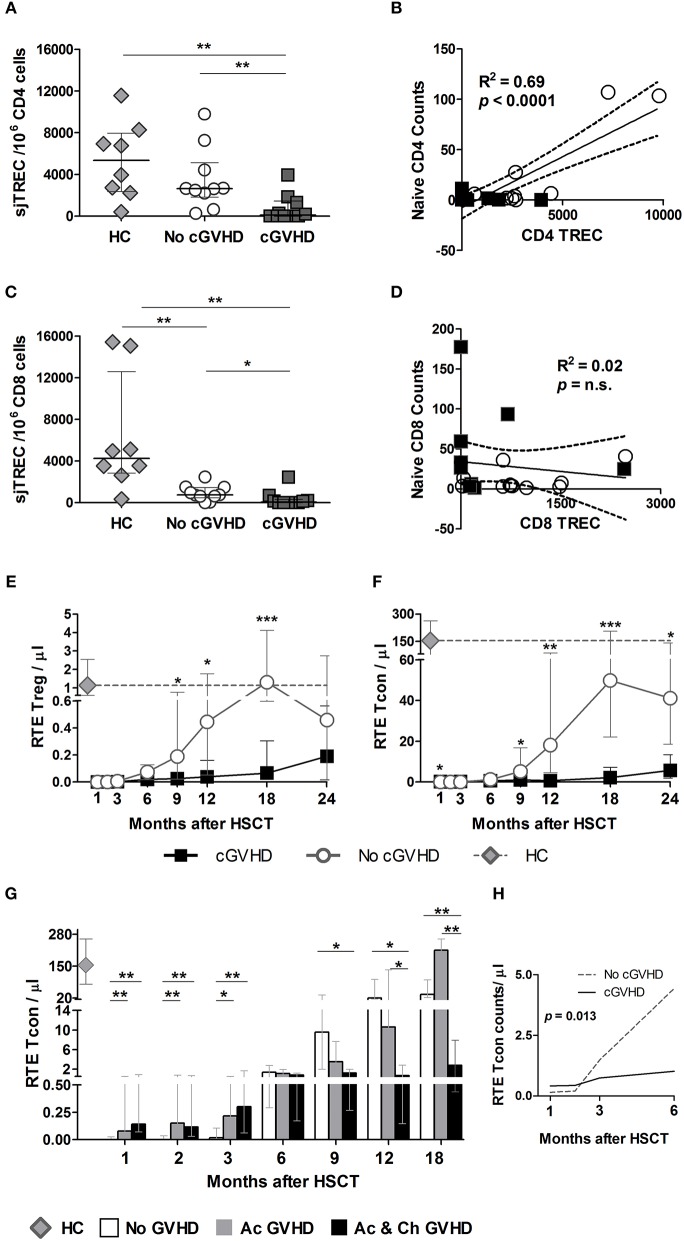
The success of allogeneic hematopoietic stem cell transplantation (allo-HSCT) in the treatment of hematological malignancies remains hampered by life-threatening chronic graft vs. host disease (cGVHD). Although multifactorial in nature, cGVHD has been associated with imbalances between effector and regulatory T cells (Treg). To further elucidate this issue, we performed a prospective analysis of patients undergoing unrelated donor allo-HSCT after a reduced intensity conditioning (RIC) regimen containing anti-thymocyte globulin (ATG) and the same GVHD prophylaxis, at a single institution. We studied T cell subset homeostasis over a 24-month follow-up after HSCT in a comparative analysis of patients with and without cGVHD. We also quantified naive and memory T cell subsets, proliferation and expression of the apoptosis-related proteins Bcl-2 and CD95. Finally, we assessed thymic function by T cell receptor excision circle (TREC) quantification and T cell receptor (TCR) diversity by TCRVβ spectratyping. While the total number of conventional CD4 (Tcon) and CD8 T cells was similar between patient groups, Treg were decreased in cGVHD patients. Interestingly, we also observed divergent patterns of Naive and Stem Cell Memory (SCM) subset recovery in Treg and Tcon compared to CD8. Patients with cGVHD showed impaired recovery of Naive and SCM Tcon and Treg, but significantly increased frequencies and absolute numbers of Naive and SCM were observed in the CD8 pool. Markedly increased EMRA CD8 T cells were also noted in cGVHD. Taken together, these results suggest that Naive, SCM and EMRA CD8 play a role in the emergence of cGHVD. Reduced Naive and recent thymic emigrant Tcon and Treg in cGVHD was likely due to impaired thymic output, as it was accompanied by decreased CD4 TREC and TCR diversity. On the other hand, CD8 TCR diversity was similar between patient groups. Furthermore, no correlation was observed between CD8 TREC content and Naive CD8 numbers, suggesting limited thymic production of Naive CD8 T cells in patients after transplant, especially in those developing cGVHD. The mechanisms behind the opposing patterns of CD4 and CD8 subset cell recovery in cGVHD remain elusive, but may be linked to thymic damage associated with the conditioning regimen and/or acute GVHD.

Keywords: Naive T cell; T lymphocyte; chronic graft vs. host disease; hematopoietic stem cell transplantation; immune reconstitution; stem cell memory.


Figures

Figure 1
Figure 1
Treg, Tcon and CD8 Homeostasis following HSCT. Patients were divided into No cGVHD (gray lines and open circles) and cGVHD (black lines and squares). Healthy controls (HC) are also shown (gray diamonds and dotted gray lines). (A) Absolute counts per microliter for Treg (CD3+ CD4+ CD25bright Foxp3+ CD127low), Tcon (CD3+ CD4+ Foxp3), and CD8 (CD3+ CD4) T cells. (B) Frequency of Ki-67+ cells within CD3+ CD4+ Foxp3+ Treg, Tcon, and CD8 T cells. Median fluorescence intensity (MFI) for Bcl-2 (C) and CD95 (D) within CD3+CD4+ Foxp3+ Treg, Tcon and CD8 T cells. Symbols represent median values and whiskers represent interquartile range (IQR). Asterisks denote statistically significant differences between patient groups (*p = 0.01 to 0.05; **p = 0.001 to 0.01).
Figure 2
Figure 2
Treg subset reconstitution in cGVHD. Treg were identified as CD4+ Foxp3+ within a CD3+ lymphocyte gate. Naive and memory subsets were identified as shown in Supplementary Figure 1. (A) The median percentage for each subset within Treg is shown for patients with and without cGVHD, as well as for HC. (B) Naive Treg percentages in the first 6 months after HSCT in patients with cGVHD (black line) and No cGVHD (dotted gray line), illustrating the results of the LME analysis for this subset. Absolute counts of Naive (C) and SCM (D) Treg in patients without cGVHD (gray lines and open circles), with cGVHD (black lines and squares) and HC (gray diamonds and dotted gray lines). Symbols represent median values and whiskers represent IQR. Asterisks denote statistically significant differences between patient groups (*p = 0.01 to 0.05; **p = 0.001 to 0.01).
Figure 3
Figure 3
Naive and memory Tcon reconstitution in cGVHD. Tcon were identified as CD4+ Foxp3 within a CD3+ lymphocyte gate. Naive and memory subsets were identified as shown in Supplementary Figure 1. (A) The percentage of each subset within Tcon cells is shown for patients with and without cGVHD, as well as HC. (B) Percentage of Naive within Tcon in the first 6 months after HSCT in patients with cGVHD (black line) and No cGVHD (dotted gray line), illustrating the results of the LME analysis for this subset. Naive (C) and SCM (D) Tcon absolute counts in patients without cGVHD (gray line and circles), patients with cGVHD (black line and squares) and HC (gray diamonds and dotted gray lines). Median values and IQR are shown. Asterisks denote statistically significant differences between patient groups (*p = 0.01 to 0.05; **p = 0.001 to 0.01; ***p = 0.0001 to 0.001).
Figure 4
Figure 4
Naive and memory CD8 reconstitution in cGVHD. CD8 T cells were identified as CD3+ CD4 lymphocytes. Naive and memory subsets were identified as shown in Supplementary Figure 1. (A) Percentage of each subset within CD8 cells for patients with and without cGVHD, as well as HC. (B) Naive CD8 percentages from month 9 to 24 after HSCT in patients with cGVHD (black line) and no cGVHD (dotted gray line), illustrating the results of the LME analysis for this subset. Absolute counts of Naive (C), SCM (D), and EMRA (E) CD8 cells in patients without cGVHD (gray circles and dotted lines), patients with cGVHD (black squares and lines) and HC (gray diamonds and dotted gray lines). Symbols represent median values and whiskers represent IQR. Asterisks denote statistically significant differences between patient groups (*p = 0.01 to 0.05; **p = 0.001 to 0.01; ***p = 0.0001 to 0.001).
Figure 5
Figure 5
The effect of acute GVHD on SCM Tcon and CD8 reconstitution. SCM absolute counts for Tcon (A) and CD8 (B) in patients without any form of GVHD (No GVHD, white bars), patients with acute GVHD only (Ac GVHD, gray bars), patients with acute and chronic GVHD (Ac & Ch GVHD, black bars) and healthy controls (HC, gray diamonds). Bar graphs shows median values and IQR. Asterisks denote statistically significant differences between patient groups (*p = 0.01 to 0.05; **p = 0.001 to 0.01).
Figure 6
Figure 6
TCR repertoire analysis in HSCT patients and controls. TCRVB diversity analysis was performed on purified CD4 and CD8 T cells from healthy controls (HC) and patients with (cGVHD) and without cGVHD (No cGVHD). Data shown represent values obtained from patient samples early (month 3) and late (months 9 or 12) after HSCT. Clonality analysis of TRB locus transcripts is displayed as profile frequencies of CDR3 spectratypes for TRVB1 to TRVB24 gene families. Profiles were classified on the basis of peak number, distribution shape and relative fluorescence intensity (RFI) as: polyclonal Gaussian (PG, ≥8 peaks with a Gaussian distribution), polyclonal non-Gaussian (PNG, ≥8 peaks with an uneven distribution), polyclonal skewed (PS, 6 peaks or 1 peak with RFI>40%), polyclonal severely skewed (PSS, 1 or 2 peaks with RFI>70%), oligoclonal (O, 2 to 3 peaks), monoclonal (M, 1 peak or a peak with RFI>90%), and not detected (ND). Color stacked columns represent the mean frequency for each of the clonality profiles in CD4 (A) and CD8 (C) in HC, as well as in patients with and without cGVHD early and late after HSCT. TRVB1-24 CDR3 median peak count in CD4 (B) and CD8 (D) T cells for HC and patient groups. Asterisks denote statistically significant differences between patient groups (**p = 0.001 to 0.01; ***p = 0.0001 to 0.001;****p < 0.0001).
Figure 7
Figure 7
sjTREC content and RTE analysis post-HSCT. sjTRECs were quantified in purified CD4 (A) and CD8 (C) T cells at months 9 and 12 post-HSCT. Median and IQR values for sjTREC content are shown per 106 CD8 or CD4 T cells in healthy controls (HC, gray diamonds), patients without cGVHD (No cGVHD, white circles), and patients with (cGVHD, dark gray squares). Linear regression analysis between Naive CD4 (B) or CD8 (D) absolute counts and sjTREC content where black squares represent cGVHD and while circles No cGVHD patients. Absolute counts of RTE Treg (E) and RTE Tcon (F) in patients with (black lines and squares) and without (gray lines and circles) cGVHD, as well as in HC (gray diamonds and gray dotted lines). (G) RTE Tcon counts in patients without GVHD (No GVHD, white bars), with acute GVHD only (Ac GVHD, gray bars), with acute and chronic GVHD (Ac & Ch GVHD, black bars), and in HC (gray diamond). (H) RTE Tcon counts on the first 6 months after HSCT in patients with (cGVHD, black line) and without (No cGVHD, dotted gray line) cGVHD, illustrating the results of the LME for these subsets. Median and IQR values are shown. Asterisks denote statistically significant differences between patient groups (*p = 0.01 to 0.05; **p = 0.001 to 0.01; ***p = 0.0001 to 0.001).

References

    1. Passweg JR, Baldomero H, Bader P, Basak GW, Bonini C, Duarte R, et al. . Is the use of unrelated donor transplantation leveling off in Europe? The 2016 European Society for Blood and Marrow Transplant activity survey report. Bone Marrow Transplant. (2018) 53:1139–48. 10.1038/s41409-018-0153-1 - DOI - PMC - PubMed
    1. D'Souza A, Lee S, Zhu X, Pasquini M. Current use and trends in hematopoietic cell transplantation in the United States. Biol Blood Marrow Transplant. (2017) 23:1417–21. 10.1016/J.BBMT.2017.05.035 - DOI - PMC - PubMed
    1. Riddell SR, Appelbaum FR. Graft-versus-host disease: a surge of developments. PLoS Med. (2007) 4:e198. 10.1371/journal.pmed.0040198 - DOI - PMC - PubMed
    1. Ghimire S, Weber D, Mavin E, Wang XN, Dickinson AM, Holler E. Pathophysiology of GvHD and other HSCT-related major complications. Front Immunol. (2017) 8:79 10.3389/fimmu.2017.00079 - DOI - PMC - PubMed
    1. Cutler CS, Koreth J, Ritz J. Mechanistic approaches for the prevention and treatment of chronic GVHD. Blood. (2017) 129:22–30. 10.1182/blood-2016-08-686659 - DOI - PMC - PubMed

Publication types

MeSH terms

Substances