. 2019 Mar 6:10:391.
doi: 10.3389/fimmu.2019.00391. eCollection 2019.

Altered Th17/Treg Ratio in Peripheral Blood of Systemic Lupus Erythematosus but Not Primary Antiphospholipid Syndrome

Affiliations

Altered Th17/Treg Ratio in Peripheral Blood of Systemic Lupus Erythematosus but Not Primary Antiphospholipid Syndrome

Lorena Álvarez-Rodríguez et al. Front Immunol. .

Abstract

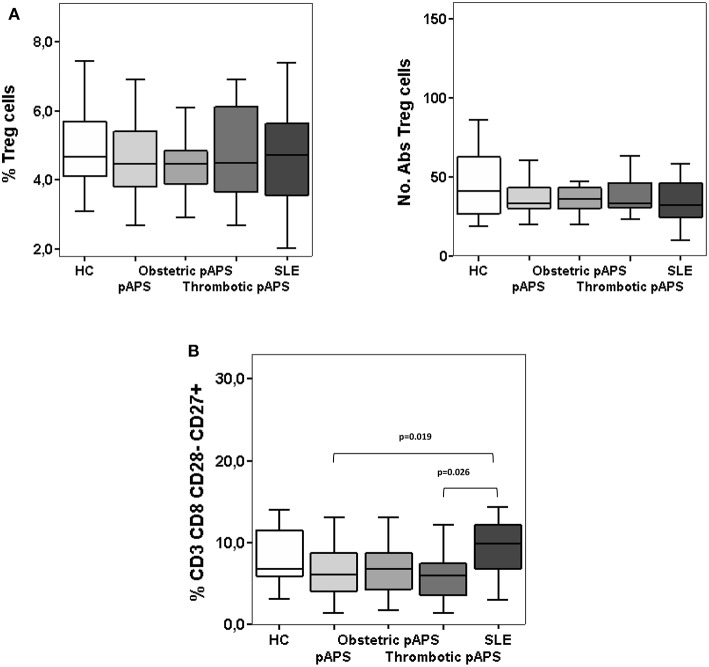
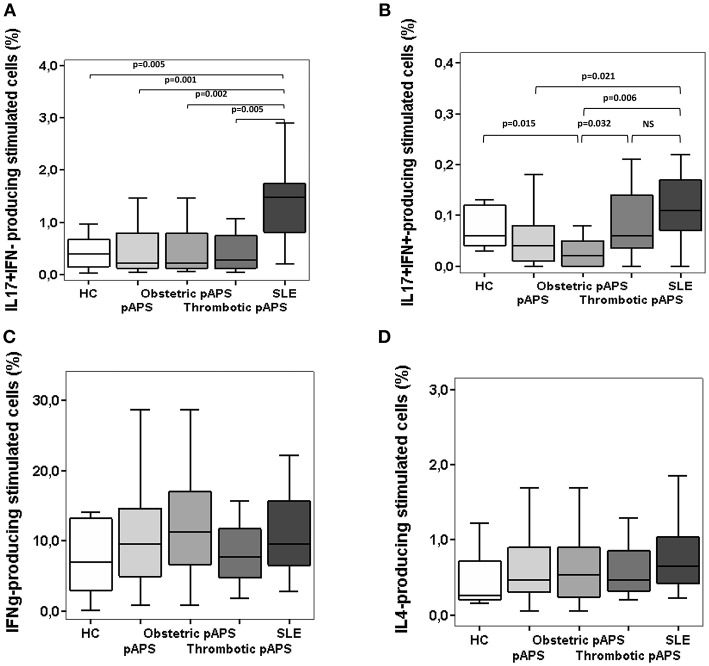
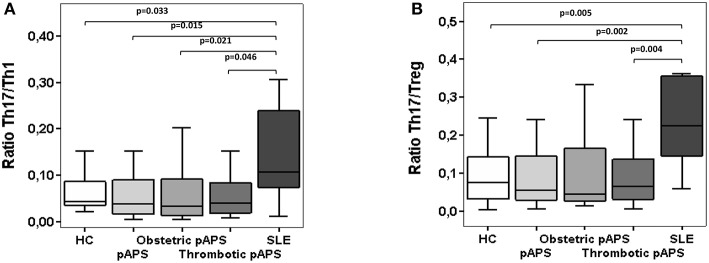
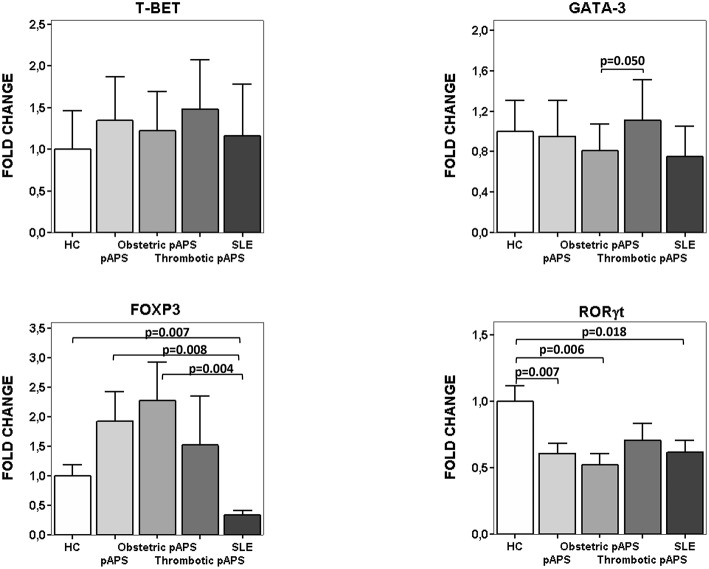
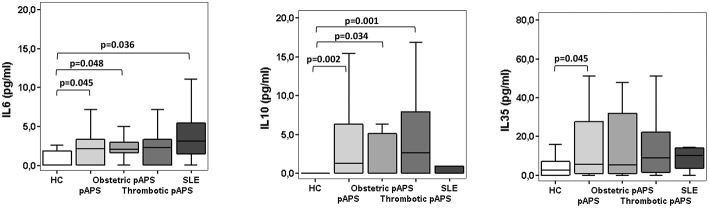
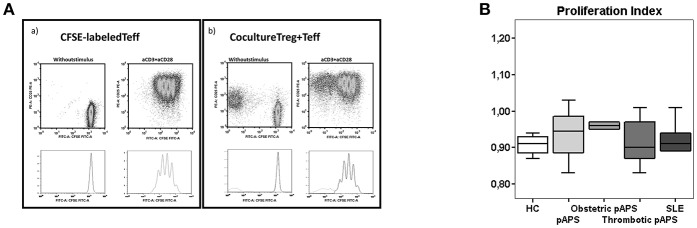
Introduction: The role of the immune response in the pathogenesis of antiphospholipid syndrome (APS) remains elusive. It is possible that differences in the frequencies of Th17 cells and/or defects in the immunoregulatory mechanisms are involved in the pathogenesis of APS. Our aim was to determine the peripheral blood Th cells phenotype and the circulating cytokine profile in patients with primary APS (pAPS) and compare it with systemic lupus erythemathosus (SLE) as disease control group. Methods: The frequencies of circulating regulatory T cells (Tregs) were determined in PBMCs from 36 patients with pAPS by flow cytometry. As control groups we included 21 age- and gender-matched healthy controls (HC) and 11 patients with SLE. The suppressive capacity of Tregs was evaluated in vitro by coculture assay. On the other hand, intracellular cytokine production was assessed in Th1, Th2, and Th17 cells and circulating IL-6, IL-10, and IL-35 were measured by Cytometric Bead Array and ELISA. The quantification of Th master gene expression levels was performed by real time quantitative PCR. Results: pAPS patients and SLE patients did not show differences in the percentage or number of Tregs compared to HC. The suppressive capacity of Tregs was also similar in the three study group. Instead, we found higher FoxP3·mRNA expression levels in pAPS patients and HC than SLE patients. Regarding the Th17 response, patients with pAPS and HC showed a significantly lower frequency of circulating Th17 cells than SLE. However, no differences were observed in the Th1 response between patients and controls. Thus, increased Th17/Th1 and Th17/Treg ratios were found in SLE patients but not in pAPS patients. pAPS and SLE patients had higher serum IL-6 levels than HC but there was not difference between both disease groups. Besides, a significant increase in the immunosuppressive cytokine levels was observed only in pAPS as compared to HC. Conclusions: Our data demonstrate an increased inflammatory profile of peripheral blood CD4+ T cells from SLE as compared with pAPS mostly due to an increased Th17 response. In conclusion, there seems not to be a direct pathogenic role for Th cells in pAPS but in SLE.

Keywords: SLE; Th1; Th17; Treg; inflammation; pAPS.


Figures

Figure 1
Figure 1
Frequencies and numbers of peripheral blood regulatory T cells: CD4+ CD25hi CD127−/low CD27+ CD62L+ CD45RO+ FoxP3+ (A) and CD8+CD28CD27+ (B) cells in patients with primary antiphospholipid syndrome (pAPS, n = 36) and systemic lupus erythematosus (SLE, n = 11) and healthy controls (HC, n = 21). Data of pAPS patients were also analyzed according to the two pAPS variants (lower panel of figures): obstetric (n = 17) and thrombotic (n = 19) variants. Frequencies of CD8+CD28CD27+ cells in pAPS patients were significantly lower than in SLE patients and mainly due to the thrombotic patients (B), calculated by Mann-Whitney U test. There was no significant difference for CD4+ Tregs (A). Data are expressed as the median and interquartile range. HC, healthy controls; pAPS, primary antiphospholipid syndrome; SLE, systemic lupus erythematosus.
Figure 2
Figure 2
Frequencies of Th17 cells (A,B), Th1 (C), and Th2 (D) cells in patients with primary antiphospholipid syndrome (pAPS, n = 37) and systemic lupus erythematosus (SLE, n = 11) and healthy controls (HC, n = 21). Th17 cells were divided in two subtypes: conventional Th17 (IL-17+ IFN-γ) and Th17Th1 (IL-17+ IFN-γ+). Data from pAPS patients were analyzed globally or separately by obstetric (n = 17) or thrombotic (n = 19) pAPS were analyzed. Only significant differences are displayed when p value was < 0.05 by Mann-Whitney U-test. Data are expressed as the median and interquartilic range and referred to the gate of CD4+ T cells. HC, healthy controls; pAPS, primary antiphospholipid syndrome; SLE, systemic lupus erythematosus.
Figure 3
Figure 3
Ratios of circulating Th17/Th1 (A) and Th17/Treg (B) cells in patients with primary antiphospholipid syndrome (pAPS, n = 36) and systemic lupus erythematosus (SLE, n = 11) and healthy controls (HC, n = 21). Th17 were considered as T CD4+ cells IL-17+ IFN-γ) whereas the Th1 cells were IL-17 IFN-γ+). Treg cells were defined as CD4+ CD25hi CD127−/low CD27+ CD62L+ CD45RO+ FoxP3+. Data of pAPS patients were also analyzed according to the two pAPS variants: obstetric (n = 17) and thrombotic (n = 19) variants. The level of significant differences between groups are indicated only when p value was < 0.05 by Mann-Whitney U-test. Data are expressed as the median and interquartilic range. HC, healthy controls; pAPS, primary antiphospholipid syndrome; SLE, systemic lupus erythematosus.
Figure 4
Figure 4
mRNA expression of transcription factors for Th differentiation. Relative fold change expression of mRNA quantified by real time quantitative PCR of T-bet, GATA-3, FoxP3, and RORγt in patients (15 pAPS patients: 8 obstetric and 7 arterial thrombosis; 10 SLE patients) and healthy controls (n: 10) is displayed. pAPS were subdivided into the main two variants: obstetric and thrombotic. Level of significance is only shown when p value was < 0.05 by Student-t test between groups for each gene. Data are expressed as the mean value. HC, healthy controls; pAPS, primary antiphospholipid syndrome; SLE, systemic lupus erythematosus.
Figure 5
Figure 5
Serum cytokines levels in patients with primary antiphospholipid syndrome (pAPS, n = 37) and systemic lupus erythematosus (SLE, n = 11) and healthy controls (HC, n = 21). Serum IL-6 and IL-10 levels were assessed by CBA whereas serum levels of IL-35 were measured by ELISA. The level of significant differences between groups are indicated only when p value was < 0.05 by Mann-Whitney U-test. Data are expressed as the median and interquartile range. HC, healthy controls; pAPS, primary antiphospholipid syndrome; SLE, systemic lupus erythematosus.
Figure 6
Figure 6
Suppression function of CD4+ Treg cells in in vitro culture with polyclonally stimulated CD4+ effector T cells. FACS-sorted Treg (CD4+ CD25hi CD127−/low) and effector (Teff, CD4+CD25CD127+) T cells of HC (n = 9), pAPS (n = 12), and SLE patients (n = 5) were setup in a coculture assay. Following sorting, effector T cells were labeled with 10 μM CFSE. CFSE-labeled Teff cells were cultured in vitro alone and cocultured with unlabeled Treg cells (1:1). Cells were either unstimulated or stimulated with anti-CD3+anti-CD28 antibodies at a bead to cell ratio 1:1 and incubated for 4 days. Then, cells were harvested and analyzed by flow cytometry. (A) Shows a representative experiment with only Teff cells stimulated (left) or with the addition of Treg cells to stimulated Teff cells (right). The suppressive capacity of Treg toward effector T cells in culture [ratio (1:1)/ Effect] was expressed as the proliferation index with respect to the proliferation of Teff cells stimulated without Treg cells. (B) Represents the median proliferation index in each group and interquartilic range.

References

    1. Miyakis S, Lockshin MD, Atsumi T, Branch DW, Brey RL, Cervera R, et al. International consensus statement on an update of the classification criteria for definite antiphospholipid syndrome (APS). J Thromb Haemost. (2006) 4:295–306. 10.1111/j.1538-7836.2006.01753.x - DOI - PubMed
    1. Manzi S, Ahearn JM, Salmon J. New insights into complement: a mediator of injury and marker of disease activity in systemic lupus erythematosus. Lupus. (2004) 13:298–303. 10.1191/0961203303lu1016oa - DOI - PubMed
    1. De Groot PG, Urbanus RT. Antiphospholipid syndrome – not a non inflammatory disease. Sem Thromb Hemost. (2015) 41:607–14. 10.1055/s-0035-1556725 - DOI - PubMed
    1. Abrahams VM, Chamley LW, Salmon JE. Emerging treatment models in rheumatology: antiphospholipid syndrome and pregnancy: pathogenesis to translation. Arthritis Rheumatol. (2017) 69:1710–21. 10.1002/art.40136 - DOI - PMC - PubMed
    1. Xiao J, Zhu F, Liu X, Xiong J. Th1/Th2/Th17/Treg expression in cultured PBMCs with antiphospholipid antibodies. Mol Med Rep. (2012) 6:1035–9. 10.3892/mmr.2012.1055 - DOI - PubMed