. 2019 Jul;23(7):908-919.
doi: 10.1007/s10157-019-01727-4. Epub 2019 Mar 20.

Effects of lactulose on renal function and gut microbiota in adenine-induced chronic kidney disease rats

Affiliations

Effects of lactulose on renal function and gut microbiota in adenine-induced chronic kidney disease rats

Miyu Sueyoshi et al. Clin Exp Nephrol. 2019 Jul.

Abstract

Background: Constipation is frequently observed in patients with chronic kidney disease (CKD). Lactulose is expected to improve the intestinal environment by stimulating bowel movements as a disaccharide laxative and prebiotic. We studied the effect of lactulose on renal function in adenine-induced CKD rats and monitored uremic toxins and gut microbiota.

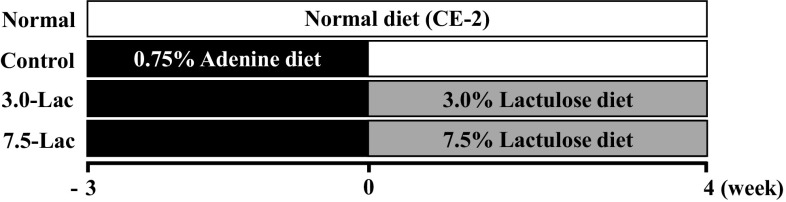
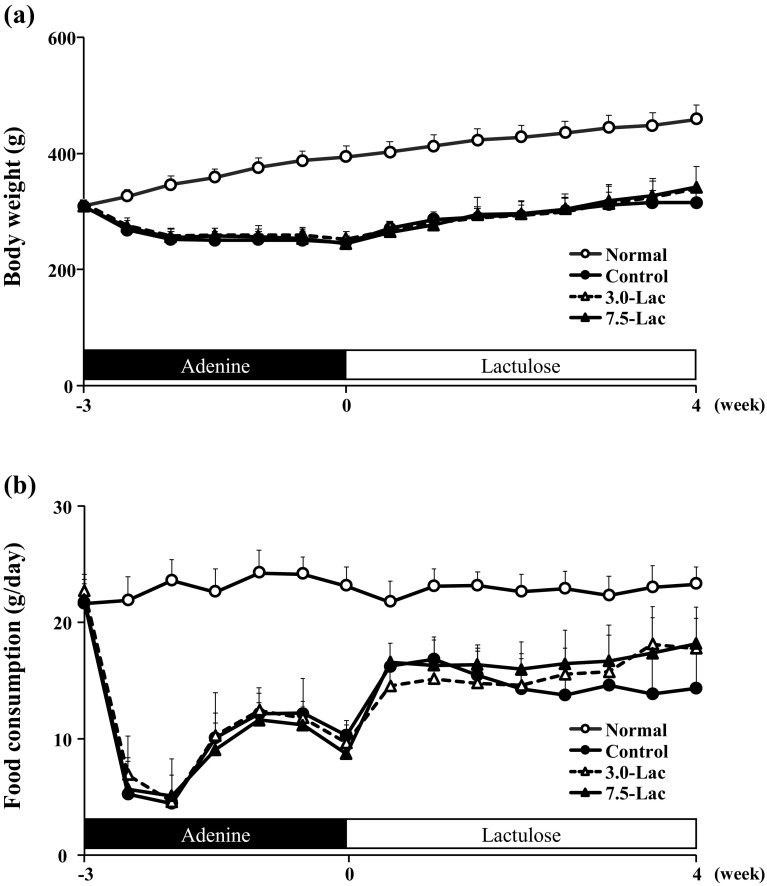
Methods: Wistar/ST male rats (10-week-old) were fed 0.75% adenine-containing diet for 3 weeks to induce CKD. Then, they were divided into three groups and fed as follows: control, normal diet; and 3.0- and 7.5-Lac, 3.0% and 7.5% lactulose-containing diets, respectively, for 4 weeks. Normal diet group was fed normal diet for 7 weeks. The rats were observed for parameters including renal function, uremic toxins, and gut microbiota.

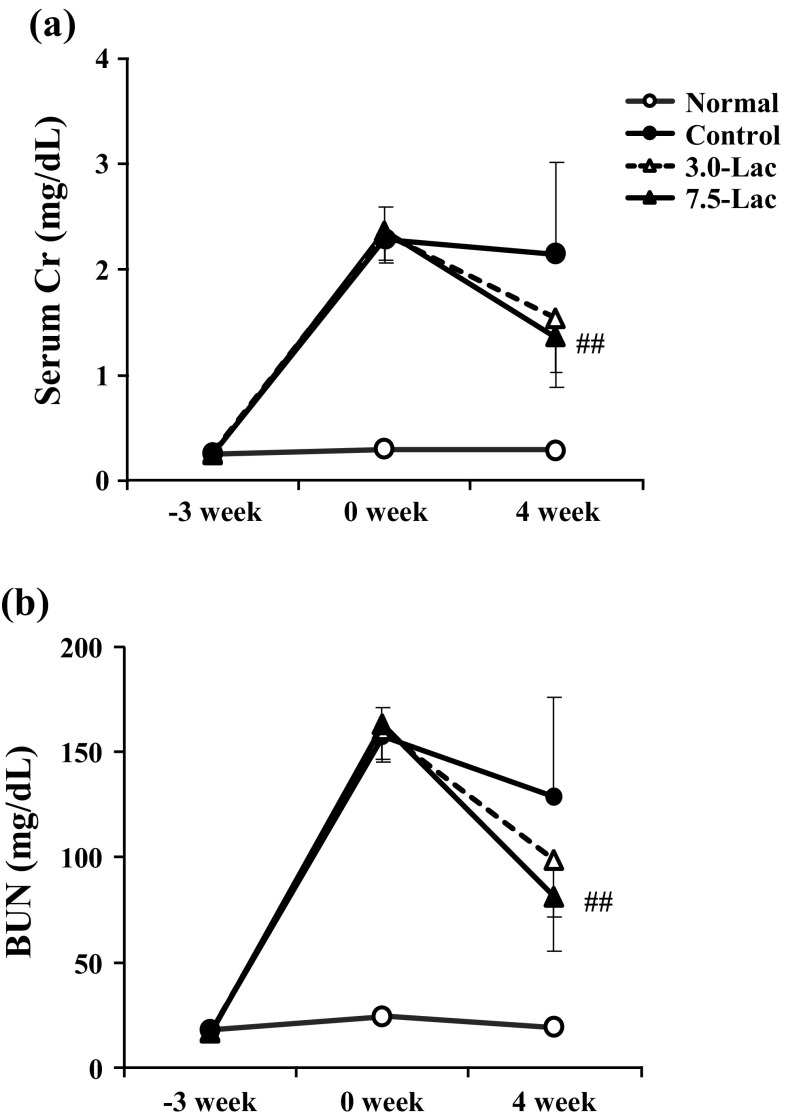
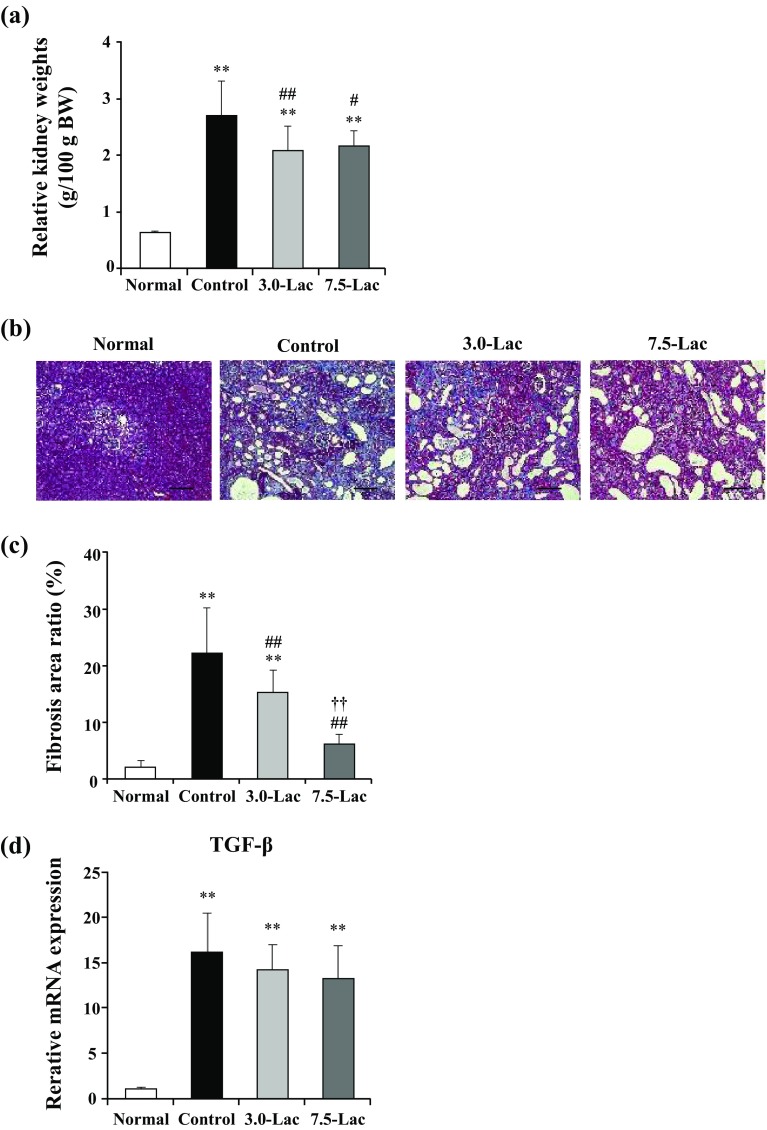
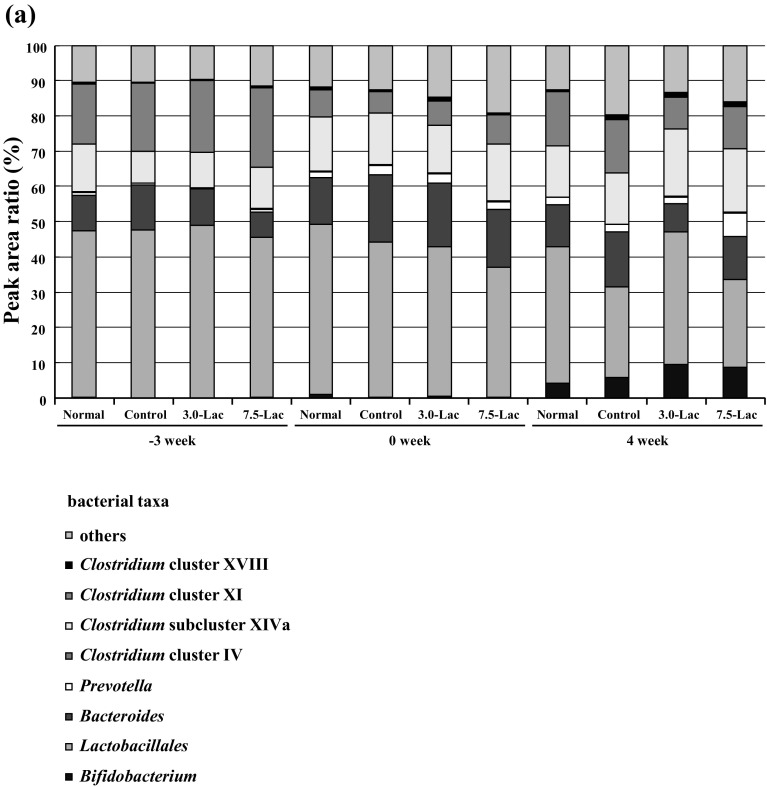
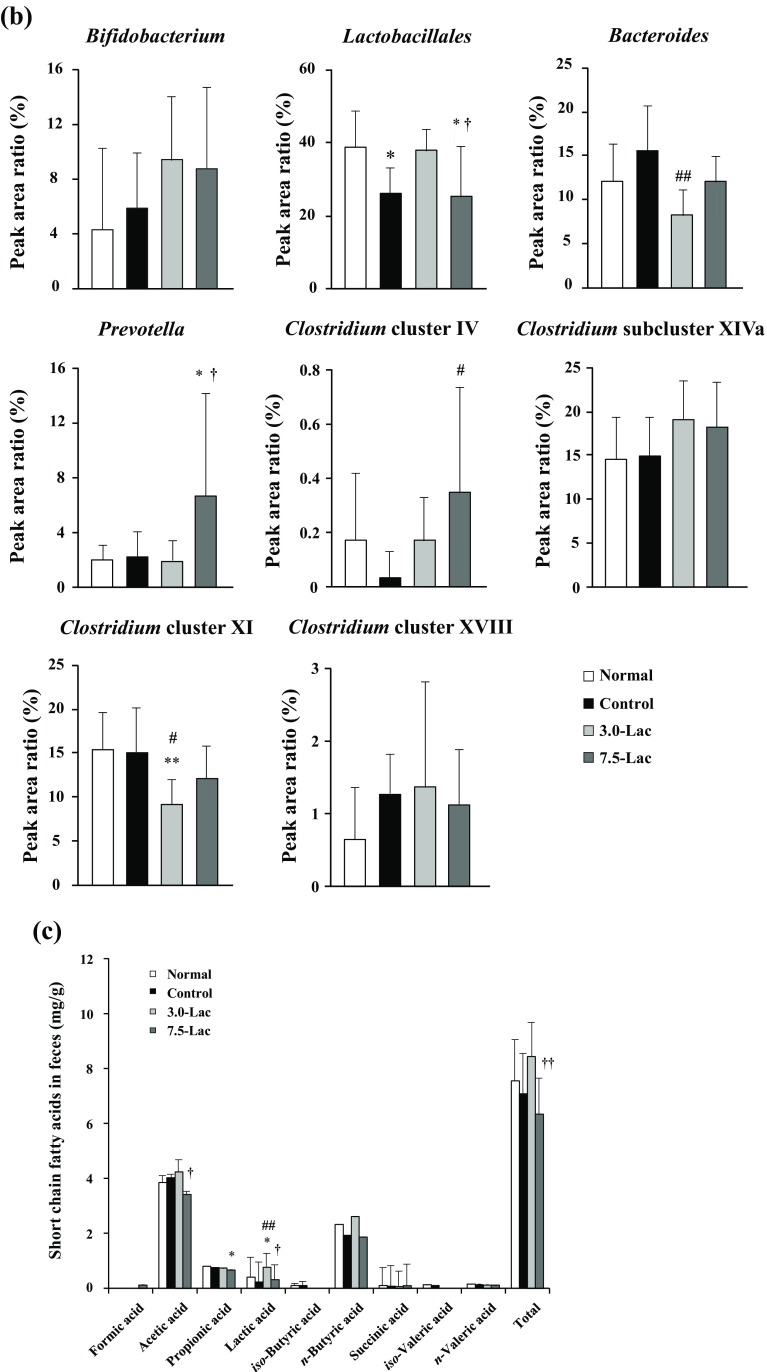
Results: The control group showed significantly higher serum creatinine (sCr) and blood urea nitrogen (BUN) 3 weeks after adenine feeding than at baseline, with a 8.5-fold increase in serum indoxyl sulfate (IS). After switching to 4 weeks of normal diet following adenine feeding, the sCr and BUN in control group remained high with a further increase in serum IS. In addition, tubulointerstitial fibrosis area was increased in control group. On the other hand, 3.0- and 7.5-Lac groups improved sCr and BUN levels, and suppressed tubulointerstitial fibrosis, suggesting preventing of CKD progression by lactulose. Lac groups also lowered level of serum IS and proportions of gut microbiota producing IS precursor.

Conclusion: Lactulose modifies gut microbiota and ameliorates CKD progression by suppressing uremic toxin production.

Keywords: CKD; Gut microbiota; Lactulose; Renal function; Uremic toxin.


Conflict of interest statement

The authors declare that they have no competing interests.

Figures

Fig. 1
Fig. 1
Experimental design
Fig. 2
Fig. 2
Effects of lactulose on body weight and food consumption of adenine-induced chronic kidney disease (CKD) rats. Changes of body weight (a) and food consumption (b) during adenine feeding and normal or lactulose feeding period in adenine-induced CKD rats. Values are expressed as the mean ± SD; n = 10–12/group
Fig. 3
Fig. 3
Effects of lactulose on renal functions of adenine-induced chronic kidney disease (CKD) rats. Serum creatinine (a) and blood urea nitrogen (BUN, b) in adenine-induced CKD rats. Values are expressed as the mean ± SD; n = 10–12/group. ##p < 0.01 vs. control group at week 4
Fig. 4
Fig. 4
Effects of lactulose on uremic toxins of adenine-induced chronic kidney disease (CKD) rats. Serum concentration of indoxyl sulfate (IS. a), p-cresyl sulfate (PCS, b) and trimethylamine N-oxide (TMAO, c) levels in adenine-induced CKD rats. Relationship between serum IS and serum creatinine (Cr, d) or blood urea nitrogen (BUN) levels (e) in adenine-induced CKD rats; n = 33. Values are expressed as the mean ± SD; n = 10–12/group. **p < 0.01 vs. normal group. ##p < 0.01 vs. control group
Fig. 5
Fig. 5
Effects of lactulose on oxidative stress markers (a, b) or antioxidant capacity (ce) in adenine-induced chronic kidney disease (CKD) rats. Serum advanced oxidation protein products. (AOPPs, a), serum malondialdehyde (MDA, b), serum thiol continent (c), serum reduced glutathione (GSH, d) and GSH/oxidized glutathione (GSSG) ratio (e). Values are expressed as mean ± SD; n = 9–12/group. *p < 0.05 and **p < 0.01 vs. normal group and ##p < 0.01 vs. control group
Fig. 6
Fig. 6
Effects of lactulose on relative kidney weights (a) and renal fibrosis (b–d) in adenine-induced chronic kidney disease (CKD) rats. Representative micrographs showing Masson’s trichrome (MT) staining (b). Scale bar, 200 µm. Fibrosis was digitally quantified and is shown as percentage of blue area of MT stain in kidney section (c). TGF-β mRNA expression was examined with quantitative PCR (d). The expression levels were normalized to the levels in the kidney from the normal rats. Values are expressed as mean ± SD; n = 10–12/group. **p < 0.01 vs. normal group, #p < 0.05 and ##p < 0.01 vs. control group, and ††p < 0.01 vs. 3.0-Lac group
Fig. 7
Fig. 7
Effects of lactulose on relative abundance of microbiota (a, b) and short-chain fatty acid (c) in adenine-induced chronic kidney disease (CKD) rats. Alteration of composition of intestinal bacterial flora analyzed using terminal fragment length polymorphism (T-RFLP) analysis. Relative abundance of microbiota based on the average number of each subfamily at the order and genus levels (a). Each subfamily is represented in separate graphs (b). Concentrations of short-chain fatty acids (c) in cecal contents were measured using post-column pH-buffered electroconductivity detection. Values are expressed as mean ± SD; n = 10–12/group. *p < 0.05 and **p < 0.01 vs. normal group, #p < 0.05 and ##p < 0.01 vs. control group, and p < 0.05 and ††p < 0.01 vs. 3.0-Lac group
Fig. 7
Fig. 7
Effects of lactulose on relative abundance of microbiota (a, b) and short-chain fatty acid (c) in adenine-induced chronic kidney disease (CKD) rats. Alteration of composition of intestinal bacterial flora analyzed using terminal fragment length polymorphism (T-RFLP) analysis. Relative abundance of microbiota based on the average number of each subfamily at the order and genus levels (a). Each subfamily is represented in separate graphs (b). Concentrations of short-chain fatty acids (c) in cecal contents were measured using post-column pH-buffered electroconductivity detection. Values are expressed as mean ± SD; n = 10–12/group. *p < 0.05 and **p < 0.01 vs. normal group, #p < 0.05 and ##p < 0.01 vs. control group, and p < 0.05 and ††p < 0.01 vs. 3.0-Lac group

References

    1. Jha V, Garcia-Garcia G, Iseki K, Li Z, Naicker S, Plattner B, et al. Chronic kidney disease: global dimension and perspectives. Lancet. 2013;382:260–272. doi: 10.1016/S0140-6736(13)60687-X. - DOI - PubMed
    1. Imai E, Horio M, Watanabe T, et al. Prevalence of chronic kidney disease in the Japanese general population. Clin Exp Nephrol. 2009;13:621–630. doi: 10.1007/s10157-009-0199-x. - DOI - PubMed
    1. Yasuda G, Shibata K, Takizawa T, Ikeda Y, Tokita Y, Umemura S, et al. Prevalence of constipation in continuous ambulatory peritoneal dialysis patients and comparison with hemodialysis patients. Am J Kidney Dis. 2002;39:1292–1299. doi: 10.1053/ajkd.2002.33407. - DOI - PubMed
    1. Mishima E, Fukuda S, Shima H, Hirayama A, Akiyama Y, Takeuchi Y, et al. Alteration of the intestinal environment by lubiprostone is associated with amelioration of adenine-induced CKD. J Am Soc Nephrol. 2015;26:1787–1794. doi: 10.1681/ASN.2014060530. - DOI - PMC - PubMed
    1. Ford AC, Suares NC. Effect of laxatives and pharmacological therapies in chronic idiopathic constipation: systematic review and meta-analysis. Gut. 2011;60:209–218. doi: 10.1136/gut.2010.227132. - DOI - PubMed

MeSH terms