Clinical Trial
. 2019 Mar 21;129(6):2210-2221.
doi: 10.1172/JCI126397.

B cell maturation antigen-specific CAR T cells are clinically active in multiple myeloma

Affiliations
Clinical Trial

B cell maturation antigen-specific CAR T cells are clinically active in multiple myeloma

Adam D Cohen et al. J Clin Invest. .

Abstract

Background: Chimeric antigen receptor (CAR) T cells are a promising therapy for hematologic malignancies. B-cell maturation antigen (BCMA) is a rational target in multiple myeloma (MM).

Methods: We conducted a phase I study of autologous T cells lentivirally-transduced with a fully-human, BCMA-specific CAR containing CD3ζ and 4-1BB signaling domains (CART-BCMA), in subjects with relapsed/refractory MM. Twenty-five subjects were treated in 3 cohorts: 1) 1-5 x 10⁸ CART-BCMA cells alone; 2) Cyclophosphamide (Cy) 1.5 g/m2 + 1-5 x 10⁷ CART-BCMA cells; and 3) Cy 1.5 g/m2 + 1-5 x 10⁸ CART-BCMA cells. No pre-specified BCMA expression level was required.

Results: CART-BCMA cells were manufactured and expanded in all subjects. Toxicities included cytokine release syndrome and neurotoxicity, which were grade 3-4 in 8 (32%) and 3 (12%) subjects, respectively, and reversible. One subject died at day 24 from candidemia and progressive myeloma, following treatment for severe CRS and encephalopathy. Responses (based on treated subjects) were seen in 4/9 (44%) in cohort 1, 1/5 (20%) in cohort 2, and 7/11 (64%) in cohort 3, including 5 partial, 5 very good partial, and 2 complete responses, 3 of which were ongoing at 11, 14, and 32 months. Decreased BCMA expression on residual MM cells was noted in responders; expression increased at progression in most. Responses and CART-BCMA expansion were associated with CD4:CD8 T cell ratio and frequency of CD45RO-CD27+CD8+ T cells in the pre-manufacturing leukapheresis product.

Conclusion: CART-BCMA infusions with or without lymphodepleting chemotherapy are clinically active in heavily-pretreated MM patients.

Trial registration: NCT02546167.

Funding: University of Pennsylvania-Novartis Alliance and NIH.

Keywords: Cancer immunotherapy; Clinical Trials; Oncology.


Conflict of interest statement

Conflict of interest: ADC reports research funding from Novartis, research funding and personal fees from Bristol-Meyers Squibb, and personal fees from Celgene, Kite Pharma, Janssen, Seattle Genetics, Oncopeptides, Takeda, Array Biopharma, and GlaxoSmithKline. ALG reports research funding from Novartis and Amgen, personal fees from Kite Pharma, and research funding and personal fees from Tmunity. EAS reports research funding from AbbVie and personal fees from Celgene, Takeda, Janssen, and Amgen. SFL reports research funding and other from Novartis and research funding from Tmunity. EL reports research funding from Grifols Inc. and personal fees from Merck Inc. and Novartis Inc. DTV reports personal fees from Karyopharm, Amgen, Millennium/Takeda, and Celgene, and research funding from GlaxoSmithKline. BMW reports research funding from Novartis, personal fees from Novartis and Alnylam, and research funding from Janssen and Prothena. BMW became an employee of Janssen Research and Development in October 2017. JJM, GP, RMY, and MCM report research funding from Novartis. JLB, RI, and IPM are employees of Novartis. DLS reports other from Poseida Therapeutics. BLL reports research funding from Novartis, personal fees from Avectas, Brammer Bio, Incysus, CRC Oncology/Cure Genetics, Novartis, Terumo, and Draper Labs, and other from Tmunity Therapeutics. CHJ reports research funding from Novartis, and he is a scientific founder of Tmunity Therapeutics, for which he has founders stock but no income. ADC, ALG, EAS, JJM, SFL, EL, GP, FC, MMD, BLL, CHJ, and MCM hold or have pending patents (15/757,123, 17/042,129, 16/050,112, 62/586,834, 62/593,043, 62/752,010, 62/588,836) related to intellectual property licensed by the University of Pennsylvania to Novartis.

Figures

Figure 1
Figure 1. Treatment schema.
Cytoxan indicates cyclophosphamide. *Patients may receive therapy during manufacturing to maintain disease control. **After first 28 days, follow-up is every 4 weeks up to 6 months, then every 3 months up to 2 years. *** Pre-tx, pretreatment, 3 to 7 days before CART cell infusion.
Figure 2
Figure 2. Clinical outcomes.
(A) Swimmer’s plot showing best response and progression-free survival (PFS) for each subject in cohort 1 (1 × 10⁸ to 5 × 10⁸ CART-BCMA cells alone), cohort 2 (Cy plus 1 × 10⁷ to 5 × 10⁷ CART-BCMA cells), and cohort 3 (Cy plus 1 × 10⁸ to 5 × 10⁸ CART-BCMA cells). Arrow indicates ongoing response. Blue bars represent PR or better; red bars, MR; black bars, no response (SD or PD). *Minimal residual disease (MRD), negative by flow cytometry (estimated sensitivity 1 in 10–5 cells). **Has negative serum and urine immunofixation and negative bone marrow biopsy but residual retroperitoneal lymph nodes (LN), known to contain myeloma by prior biopsy, that decreased in size by more than 50% and became FDG-negative on PET/CT but did not disappear. Repeat LN biopsy not performed. (B) PET/CT scan images for subject 03 showing resolution of extramedullary disease (arrows) and malignant pleural effusion after treatment. (C) Overall survival (OS) based on cohort, Kaplan-Meier plot. CR, complete response; MR, minimal response; PR, partial response; VGPR, very good partial response; PD, progressive disease; sCR, stringent complete response; SD, stable disease.
Figure 3
Figure 3. CART-BCMA expansion and persistence.
(AC) CART-BCMA cell levels over time in peripheral blood for each cohort are depicted, as measured by quantitative PCR for CAR sequence. (D) Peak CART-BCMA levels by qPCR for each subject are shown (except subject 34, for whom peak data were not available). Median peak CART-BCMA levels (red bars) were not significantly different between cohorts (Kruskal-Wallis test, P = 0.19).
Figure 4
Figure 4. Serum cytokines associated with CRS severity and neurotoxicity.
Serum cytokine concentrations (in pg/ml) through day 28 were measured by Luminex assay. (AD) The median peak fold-increase over baseline for each cytokine was compared between subjects with no CRS, grade 1 CRS, or grade 2 CRS not receiving tocilizumab (CRS grade 0–2) and those with grade 3–4 CRS or grade 2 CRS receiving tocilizumab (CRS grade 3–4 or grade 2 + toci). The cytokines most significantly associated with CRS severity were (A) IFN-γ, (B) IL-2Rα, (C) MIP-1α, and (D) IL-15. (EG) Median peak fold-increase over baseline for each cytokine was compared between subjects with no neurotoxicity (No Ntx) and those with any grade of neurotoxicity (Any Ntx). The cytokines most significantly associated with neurotoxicity were (E) IFN-γ, (F) IL-1RA, and (G) MIP-1α. (HI) Peak fold-increase in IL-6 was less significantly associated with severe CRS (H) or neurotoxicity (I) when only pretocilizumab/siltuximab values were included. Stars depict subjects with grade 3–4 neurotoxicity. Exact P value by Mann-Whitney test is shown. Because the statistical analyses performed here are exploratory and hypothesis-generating in nature, no adjustment of the P values was made for multiple comparisons. Horizontal lines depict medians. IFN-γ, interferon gamma; IL-1RA, interleukin 1 receptor antagonist; IL-2Rα, interleukin 2 receptor alpha; IL-6, interleukin 6; IL-15, interleukin 15; MIP-1α, macrophage inflammatory protein 1 alpha.
Figure 5
Figure 5. Soluble BCMA (sBCMA), BAFF, and APRIL concentration, and BCMA expression on MM cells before and after CART-BCMA infusions.
(A) Baseline peripheral blood serum concentration of sBCMA and APRIL for subjects (sub) were significantly increased and decreased, respectively, compared with a panel of healthy donors (HD, n = 6) (P = 0.017, and P < 0.001, respectively, Mann-Whitney). Baseline BAFF concentrations were not significantly different. Median concentrations are depicted by red lines. (B) Serial sBCMA concentrations decline after CART-BCMA infusions more significantly in hematologic responders (PR/VGPR/CR/sCR) than in nonresponders (MR/SD/PD) before day 28 (P < 0.001). After day 28 the slopes of the curves are not significantly different between groups (P = 0.429). The estimation was based on a linear random intercept mixed effects model on log10-transform sBCMA that included 2 piecewise linear splines connected at day 28; P values were determined based on z test for the regression coefficient of interest or a linear combination of the coefficients. Mean concentration (ng/ml) + SEM are depicted. (C) Representative examples of BCMA expression on MM cells by flow cytometry. See Supplemental Figure 9 for gating strategy. FMO, fluorescence minus one. (D) BCMA mean fluorescence intensity (MFI) on MM cells over time in 18 subjects with evaluable serial bone marrow aspirates. Median MFI was significantly different between pretreatment (pre-tx) and day 28 (D28) for responders (4000 vs. 944, P = 0.02, paired t test) but not for nonresponders (2704 vs. 2140, P = 0.19). Median MFI was not significantly different between pre-tx and day 90 (D90) for responders (4000 vs. 2022, P = 0.26). *Subject 15 had no detectable MM cells at D28. #Subject 03 had no detectable MM cells at D45 (D28 not done) and too few MM cells to characterize at D90. D164 marrow is depicted at D90 time point.
Figure 6
Figure 6. Predictors of in vivo CART-BCMA expansion and response.
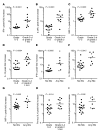
(A) Peak blood CART-BCMA expansion, as measured by qPCR, as well as (B) total CART-BCMA expansion over first 28 days (calculated as AUC), were both associated with clinical response. Greater peak CART-BCMA expansion (C) and response (D) were also associated with more severe CRS, defined as grade 3–4 or grade 2 requiring tocilizumab. A higher ratio of CD4+ to CD8+ T cells (CD4/CD8 ratio) within the leukopheresis product, as determined by flow cytometry, also correlated with both peak expansion (E) and response (F), while in vitro proliferation, measured as fold-increase of seeded cells during manufacturing, correlated only with peak expansion (G), but not response (P = 0.54, Mann-Whitney test, data not shown). (HI) A higher proportion of CD8+ T cells within the leukapheresis product with a CD45ROCD27+ phenotype was significantly associated with peak CART-BCMA expansion (H) and to a lesser degree, response (I). For A, B, C, F, and I, analysis was performed using Mann-Whitney test; lines represent median values. For D, analysis was by Fisher’s exact test. For E, G, and H, analysis was done using Spearman correlation.

Comment in

References

    1. Rickert RC, Jellusova J, Miletic AV. Signaling by the tumor necrosis factor receptor superfamily in B-cell biology and disease. Immunol Rev. 2011;244(1):115–133. doi: 10.1111/j.1600-065X.2011.01067.x. - DOI - PMC - PubMed
    1. Frigyesi I, et al. Robust isolation of malignant plasma cells in multiple myeloma. Blood. 2014;123(9):1336–1340. doi: 10.1182/blood-2013-09-529800. - DOI - PubMed
    1. Tai YT, et al. Novel anti-B-cell maturation antigen antibody-drug conjugate (GSK2857916) selectively induces killing of multiple myeloma. Blood. 2014;123(20):3128–3138. doi: 10.1182/blood-2013-10-535088. - DOI - PMC - PubMed
    1. Carpenter RO, et al. B-cell maturation antigen is a promising target for adoptive T-cell therapy of multiple myeloma. Clin Cancer Res. 2013;19(8):2048–2060. doi: 10.1158/1078-0432.CCR-12-2422. - DOI - PMC - PubMed
    1. Seckinger A, et al. Target expression, generation, preclinical activity, and pharmacokinetics of the BCMA-T cell bispecific antibody EM801 for multiple myeloma treatment. Cancer Cell. 2017;31(3):396–410. doi: 10.1016/j.ccell.2017.02.002. - DOI - PubMed

Publication types

MeSH terms

Associated data