

Selection Bias When Estimating Average Treatment Effects Using One-sample Instrumental Variable Analysis
- PMID: 30896457
- PMCID: PMC6525095
- DOI: 10.1097/EDE.0000000000000972
Selection Bias When Estimating Average Treatment Effects Using One-sample Instrumental Variable Analysis
Abstract
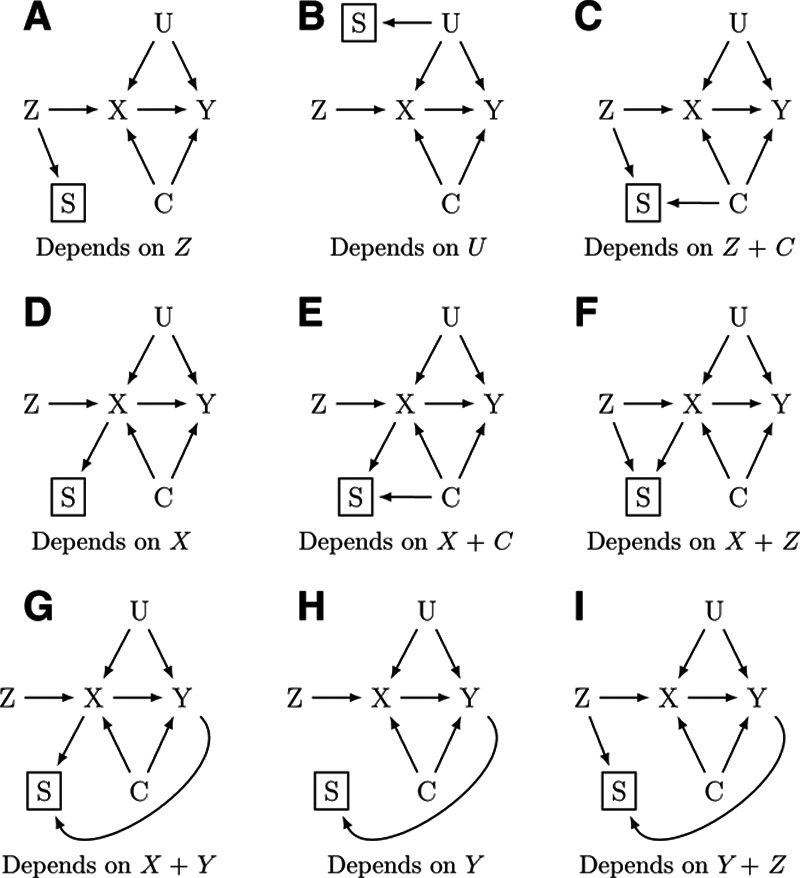
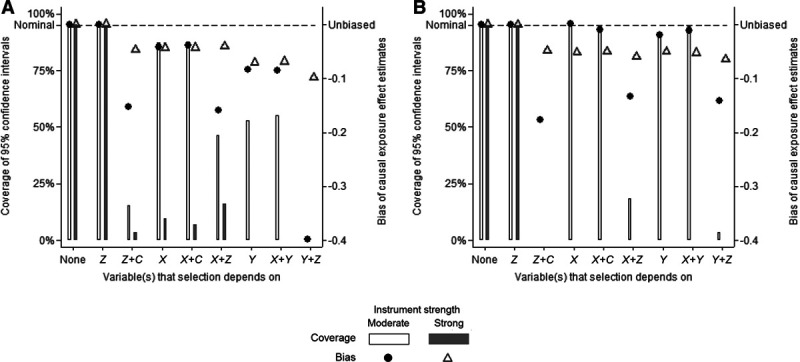
Participants in epidemiologic and genetic studies are rarely true random samples of the populations they are intended to represent, and both known and unknown factors can influence participation in a study (known as selection into a study). The circumstances in which selection causes bias in an instrumental variable (IV) analysis are not widely understood by practitioners of IV analyses. We use directed acyclic graphs (DAGs) to depict assumptions about the selection mechanism (factors affecting selection) and show how DAGs can be used to determine when a two-stage least squares IV analysis is biased by different selection mechanisms. Through simulations, we show that selection can result in a biased IV estimate with substantial confidence interval (CI) undercoverage, and the level of bias can differ between instrument strengths, a linear and nonlinear exposure-instrument association, and a causal and noncausal exposure effect. We present an application from the UK Biobank study, which is known to be a selected sample of the general population. Of interest was the causal effect of staying in school at least 1 extra year on the decision to smoke. Based on 22,138 participants, the two-stage least squares exposure estimates were very different between the IV analysis ignoring selection and the IV analysis which adjusted for selection (e.g., risk differences, 1.8% [95% CI, -1.5%, 5.0%] and -4.5% [95% CI, -6.6%, -2.4%], respectively). We conclude that selection bias can have a major effect on an IV analysis, and further research is needed on how to conduct sensitivity analyses when selection depends on unmeasured data.
Conflict of interest statement
The authors report no conflicts of interest.
Figures
Similar articles
-
Combining directed acyclic graphs and the change-in-estimate procedure as a novel approach to adjustment-variable selection in epidemiology.BMC Med Res Methodol. 2012 Oct 11;12:156. doi: 10.1186/1471-2288-12-156. BMC Med Res Methodol. 2012. PMID: 23058038 Free PMC article.
-
Assessing causal treatment effect estimation when using large observational datasets.BMC Med Res Methodol. 2019 Nov 14;19(1):207. doi: 10.1186/s12874-019-0858-x. BMC Med Res Methodol. 2019. PMID: 31726969 Free PMC article.
-
Instrumental Variable Analyses and Selection Bias.Epidemiology. 2017 May;28(3):396-398. doi: 10.1097/EDE.0000000000000639. Epidemiology. 2017. PMID: 28169934 Free PMC article.
-
Folic acid supplementation and malaria susceptibility and severity among people taking antifolate antimalarial drugs in endemic areas.Cochrane Database Syst Rev. 2022 Feb 1;2(2022):CD014217. doi: 10.1002/14651858.CD014217. Cochrane Database Syst Rev. 2022. PMID: 36321557 Free PMC article.
-
Using directed acyclic graphs to guide analyses of neighbourhood health effects: an introduction.J Epidemiol Community Health. 2008 Sep;62(9):842-6. doi: 10.1136/jech.2007.067371. J Epidemiol Community Health. 2008. PMID: 18701738 Review.
Cited by
-
Searching for the causal effects of body mass index in over 300 000 participants in UK Biobank, using Mendelian randomization.PLoS Genet. 2019 Feb 1;15(2):e1007951. doi: 10.1371/journal.pgen.1007951. eCollection 2019 Feb. PLoS Genet. 2019. PMID: 30707692 Free PMC article.
-
Associations between insomnia and pregnancy and perinatal outcomes: Evidence from mendelian randomization and multivariable regression analyses.PLoS Med. 2022 Sep 6;19(9):e1004090. doi: 10.1371/journal.pmed.1004090. eCollection 2022 Sep. PLoS Med. 2022. PMID: 36067251 Free PMC article.
-
Investigating causal relations between sleep duration and risks of adverse pregnancy and perinatal outcomes: linear and nonlinear Mendelian randomization analyses.BMC Med. 2022 Sep 12;20(1):295. doi: 10.1186/s12916-022-02494-y. BMC Med. 2022. PMID: 36089592 Free PMC article.
-
The causal effects of health conditions and risk factors on social and socioeconomic outcomes: Mendelian randomization in UK Biobank.Int J Epidemiol. 2020 Oct 1;49(5):1661-1681. doi: 10.1093/ije/dyaa114. Int J Epidemiol. 2020. PMID: 32808034 Free PMC article.
-
Age-specific effects of weight-based body size on fracture risk in later life: a lifecourse Mendelian randomisation study.Eur J Epidemiol. 2023 Jul;38(7):795-807. doi: 10.1007/s10654-023-00986-6. Epub 2023 May 3. Eur J Epidemiol. 2023. PMID: 37133737 Free PMC article.
References
-
- Angrist JD, Imbens GW, Rubin DB. Identification of causal effects using instrumental variables. J Am Stat Assoc. 1996;91:444–455.
-
- Greenland S. An introduction to instrumental variables for epidemiologists. Int J Epidemiol. 2000;29:722–729. - PubMed
-
- Hernán MA, Robins JM. Instruments for causal inference. An epidemiologist’s dream? Epidemiology. 2006;17:360–372. - PubMed
-
- Hernán MA, Robins JM. Causal Inference. 2019Boca Raton, Fla.: Chapman & Hall/CRC, forthcoming.
Publication types
MeSH terms
Grants and funding
LinkOut - more resources
Full Text Sources
