Isobaric tags for relative and absolute quantitation‑based proteomics reveals potential novel biomarkers for the early diagnosis of acute myocardial infarction within 3 h
- PMID: 30896787
- PMCID: PMC6443345
- DOI: 10.3892/ijmm.2019.4137
Isobaric tags for relative and absolute quantitation‑based proteomics reveals potential novel biomarkers for the early diagnosis of acute myocardial infarction within 3 h
Abstract
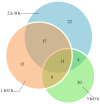
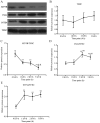
Acute myocardial infarction (AMI) is one of the most common and life‑threatening cardiovascular diseases. However, the ability to diagnose AMI within 3 h is currently lacking. The present study aimed to identify the differentially expressed proteins of AMI within 3 h and to investigate novel biomarkers using isobaric tags for relative and absolute quantitation (ITRAQ) technology. A total of 30 beagle dogs were used for establishing the MI models successfully by injecting thrombin powder and a polyethylene microsphere suspension. Serum samples were collected prior to (0 h) and following MI (1, 2 and 3 h). ITRAQ‑coupled liquid chromatography‑mass spectrometry (LC‑MS) technology was used to identify the differentially expressed proteins. The bioinformatics analysis selected several key proteins in the initiation of MI. Further analysis was performed using STRING software. Finally, western blot analysis was used to evaluate the results obtained from ITRAQ. In total, 28 proteins were upregulated and 23 were downregulated in the 1 h/0 h group, 28 proteins were upregulated and 26 were downregulated in the 2 h/0 h group, and 24 proteins were upregulated and 19 were downregulated in the 3 h/0 h group. The Gene Ontology (GO) annotation and functional enrichment analysis identified 19 key proteins. Protein‑protein interactions (PPIs) were investigated using the STRING database. GO enrichment analysis revealed that a number of key proteins, including ATP synthase F1 subunit β (ATP5B), cytochrome c oxidase subunit 2 and cytochrome c, were components of the electron transport chain and were involved in energy metabolism. The western blot analysis demonstrated that the expression of ATP5B decreased significantly at all three time points (P<0.01), which was consistent with the ITRAQ results, whereas the expression of fibrinogen γ chain increased at 2 and 3 h (P<0.01) and the expression of integrator complex subunit 4 increased at all three time points (P<0.01), which differed from the ITRAQ results. According to the proteomics of the beagle dog MI model, ATP5B may serve as the potential biomarkers of AMI. Mitochondrial dysfunction and disruption of the electron transport chain may be critical indicators of early MI within 3 h. These finding may provide a novel direction for the diagnosis of AMI.
Figures


Similar articles
-
Differential urinary proteomics analysis of myocardial infarction using iTRAQ quantification.Mol Med Rep. 2019 May;19(5):3972-3988. doi: 10.3892/mmr.2019.10088. Epub 2019 Mar 26. Mol Med Rep. 2019. PMID: 30942401 Free PMC article.
-
Quantitative proteomics analysis by isobaric tags for relative and absolute quantitation identified Lumican as a potential marker for acute aortic dissection.J Biomed Biotechnol. 2011;2011:920763. doi: 10.1155/2011/920763. Epub 2011 Dec 20. J Biomed Biotechnol. 2011. PMID: 22228989 Free PMC article.
-
Isobaric Tagging for Relative and Absolute Protein Quantification (iTRAQ)-Based Quantitative Proteomics Analysis of Differentially Expressed Proteins 1 Week After Spinal Cord Injury in a Rat Model.Med Sci Monit. 2020 Nov 4;26:e924266. doi: 10.12659/MSM.924266. Med Sci Monit. 2020. PMID: 33144554 Free PMC article.
-
[Research advances in application of isobaric tags for relative and absolute quantitation in proteomics of hepatocellular carcinoma].Zhonghua Gan Zang Bing Za Zhi. 2016 Dec 20;24(12):952-955. doi: 10.3760/cma.j.issn.1007-3418.2016.12.018. Zhonghua Gan Zang Bing Za Zhi. 2016. PMID: 28073423 Review. Chinese.
-
Analysis of the plasma proteome using iTRAQ and TMT-based Isobaric labeling.Mass Spectrom Rev. 2018 Sep;37(5):583-606. doi: 10.1002/mas.21550. Epub 2017 Nov 9. Mass Spectrom Rev. 2018. PMID: 29120501 Review.
Cited by
-
Proteomic and metabolomic characterization of cardiac tissue in acute myocardial ischemia injury rats.PLoS One. 2020 May 4;15(5):e0231797. doi: 10.1371/journal.pone.0231797. eCollection 2020. PLoS One. 2020. PMID: 32365112 Free PMC article.
-
A Tutorial Review of Labeling Methods in Mass Spectrometry-Based Quantitative Proteomics.ACS Meas Sci Au. 2024 Apr 15;4(4):315-337. doi: 10.1021/acsmeasuresciau.4c00007. eCollection 2024 Aug 21. ACS Meas Sci Au. 2024. PMID: 39184361 Free PMC article. Review.
-
Recent advances in isobaric labeling and applications in quantitative proteomics.Proteomics. 2022 Oct;22(19-20):e2100256. doi: 10.1002/pmic.202100256. Epub 2022 Jun 22. Proteomics. 2022. PMID: 35687565 Free PMC article. Review.
-
Protein Expression Profile in Rat Silicosis Model Reveals Upregulation of PTPN2 and Its Inhibitory Effect on Epithelial-Mesenchymal Transition by Dephosphorylation of STAT3.Int J Mol Sci. 2020 Feb 11;21(4):1189. doi: 10.3390/ijms21041189. Int J Mol Sci. 2020. PMID: 32054021 Free PMC article.
-
MicroRNA-381-3p signatures as a diagnostic marker in patients with sepsis and modulates sepsis-steered cardiac damage and inflammation by binding HMGB1.Bioengineered. 2021 Dec;12(2):11936-11946. doi: 10.1080/21655979.2021.2006967. Bioengineered. 2021. PMID: 34784841 Free PMC article.
References
-
- Wei M, Wu X, Li J. Value of measuring TpP, hs-CRP, CKMB and cTnI in patients with acute myocardial infarction. Chin J Cardiouascular Rev. 2005;3:86–87.
-
- Young GP, Gibler WB, Hedges JR, Hoekstra JW, Slovis C, Aghababian R, Smith M, Rubison M, Ellis J. Serial creatine kinase-MB results are a sensitive indicator of acute myocardial infarction in chest pain patients with nondiagnostic electrocardiograms: The second Emergency Medicine Cardiac Research Group Study. Acad Emerg Med. 1997;4:869–877. doi: 10.1111/j.1553-2712.1997.tb03812.x. - DOI - PubMed
MeSH terms
Substances
LinkOut - more resources
Full Text Sources
Medical
Miscellaneous

