Higher tumor mass and lower adipose mass are associated with colon‑26 adenocarcinoma‑induced cachexia in male, female and ovariectomized mice
- PMID: 30896836
- PMCID: PMC6448095
- DOI: 10.3892/or.2019.7079
Higher tumor mass and lower adipose mass are associated with colon‑26 adenocarcinoma‑induced cachexia in male, female and ovariectomized mice
Abstract
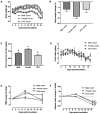
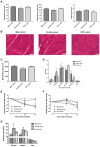
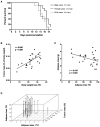
Cachexia is responsible for nearly 20% of all cancer‑related deaths, yet effective therapies to prevent or treat the disease are lacking. Clinical studies have shown that male patients lose weight at a faster rate than females. Additionally, an 'obesity paradox' may exist where excess adiposity may confer survival to patients with cancer cachexia. To further explore these phenomena, the aim of this study was to evaluate the role of changes of adipose tissue mass, sex status, and tumor mass on outcomes of male, female and ovariectomized (OVX) mice with C‑26 adenocarcinoma‑induced cachexia. We used EchoMRI to assess body composition and grip strength to measure muscle function. Body weights and food intake were measured daily. Mice were euthanized 19 days post‑-inoculation. Post‑necropsy, muscle fiber cross‑sectional areas were quantified and real‑time PCR was performed for genes relating to proteolysis. Survival curve, correlation and multiple linear regression analyses were performed to identify predictors of cachexia. Female and OVX tumor mice developed cachexia similarly to males, as evidenced by loss of skeletal and adipose masses, decreased grip strength, and increased proteolytic gene expression. Notably, female and OVX tumor mice had earlier onset of cachexia (≥5% weight loss) than male tumor mice. Larger tumor mass and lower adipose mass were the strongest predicting factors for increased severity of cachexia, regardless of sex or ovariectomy status. These results indicated that the impact of sex status may be subtle in comparison to the predictive effect of tumor and adipose mass in mice with C‑26‑induced cachexia.
Figures


Similar articles
-
Aerobic and resistance training dependent skeletal muscle plasticity in the colon-26 murine model of cancer cachexia.Metabolism. 2016 May;65(5):685-698. doi: 10.1016/j.metabol.2016.01.014. Epub 2016 Feb 4. Metabolism. 2016. PMID: 27085776
-
Role of NF-kappaB and cytokine in experimental cancer cachexia.World J Gastroenterol. 2003 Jul;9(7):1567-70. doi: 10.3748/wjg.v9.i7.1567. World J Gastroenterol. 2003. PMID: 12854165 Free PMC article.
-
Evidence for the contribution of insulin resistance to the development of cachexia in tumor-bearing mice.Int J Cancer. 2010 Feb 1;126(3):756-63. doi: 10.1002/ijc.24784. Int J Cancer. 2010. PMID: 19634137
-
Insulin resistance and body composition in cancer patients.Ann Oncol. 2018 Feb 1;29(suppl_2):ii18-ii26. doi: 10.1093/annonc/mdx815. Ann Oncol. 2018. PMID: 29506229 Review.
-
Cancer cachexia.Curr Opin Gastroenterol. 2010 Mar;26(2):146-51. doi: 10.1097/MOG.0b013e3283347e77. Curr Opin Gastroenterol. 2010. PMID: 19918173 Review.
Cited by
-
A Ketogenic Diet in Combination with Gemcitabine Mitigates Pancreatic Cancer-Associated Cachexia in Male and Female KPC Mice.Int J Mol Sci. 2023 Jun 28;24(13):10753. doi: 10.3390/ijms241310753. Int J Mol Sci. 2023. PMID: 37445930 Free PMC article.
-
Early-Onset Physical Inactivity and Metabolic Dysfunction in Tumor-bearing Mice Is Associated with Accelerated Cachexia.Med Sci Sports Exerc. 2022 Jan 1;54(1):77-88. doi: 10.1249/MSS.0000000000002772. Med Sci Sports Exerc. 2022. PMID: 34431825 Free PMC article.
-
Females display relatively preserved muscle quality compared with males during the onset and early stages of C26-induced cancer cachexia.J Appl Physiol (1985). 2023 Sep 1;135(3):655-672. doi: 10.1152/japplphysiol.00196.2023. Epub 2023 Aug 3. J Appl Physiol (1985). 2023. PMID: 37535708 Free PMC article.
-
Administration of adiponectin receptor agonist AdipoRon relieves cancer cachexia by mitigating inflammation in tumour-bearing mice.J Cachexia Sarcopenia Muscle. 2024 Jun;15(3):919-933. doi: 10.1002/jcsm.13454. Epub 2024 Apr 4. J Cachexia Sarcopenia Muscle. 2024. PMID: 38572511 Free PMC article.
-
Dietary Naringenin Preserves Insulin Sensitivity and Grip Strength and Attenuates Inflammation but Accelerates Weight Loss in a Mouse Model of Cancer Cachexia.Mol Nutr Food Res. 2021 Nov;65(22):e2100268. doi: 10.1002/mnfr.202100268. Epub 2021 Sep 27. Mol Nutr Food Res. 2021. PMID: 34499400 Free PMC article.
References
-
- Fouladiun M, Korner U, Bosaeus I, Danaeryd P, Hyltander A, Lundholm KG. Body composition and time course changes in regional distribution of fat and lean tissue in unselected cancer patients on palliative care - correlations with food intake, metabolism, exercise capacity, and hormones. Cancer. 2005;103:2189–2198. doi: 10.1002/cncr.21013. - DOI - PubMed

