Downregulation of Keap1 contributes to poor prognosis and Axitinib resistance of renal cell carcinoma via upregulation of Nrf2 expression
- PMID: 30896860
- PMCID: PMC6443340
- DOI: 10.3892/ijmm.2019.4134
Downregulation of Keap1 contributes to poor prognosis and Axitinib resistance of renal cell carcinoma via upregulation of Nrf2 expression
Abstract
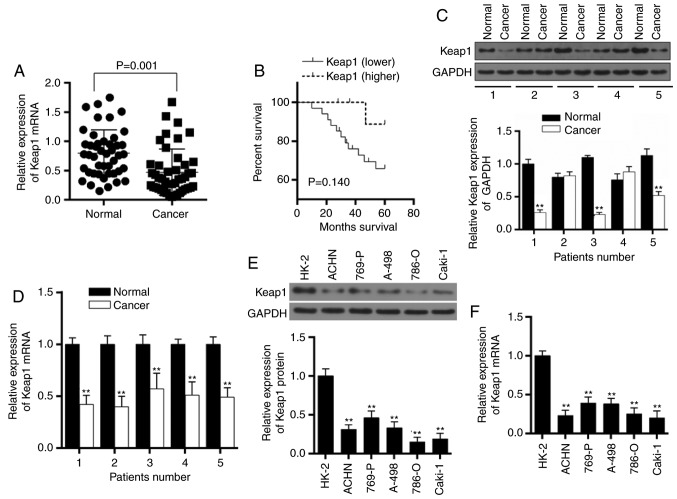
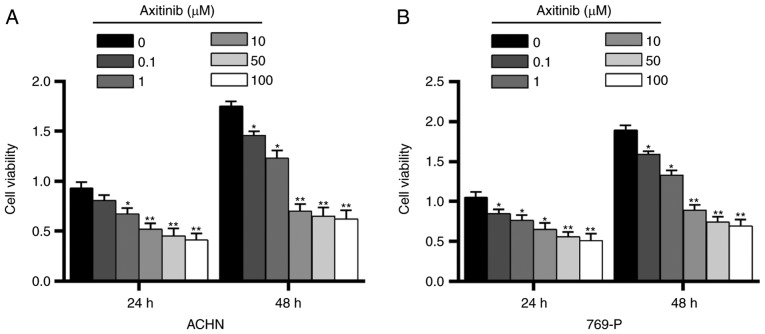
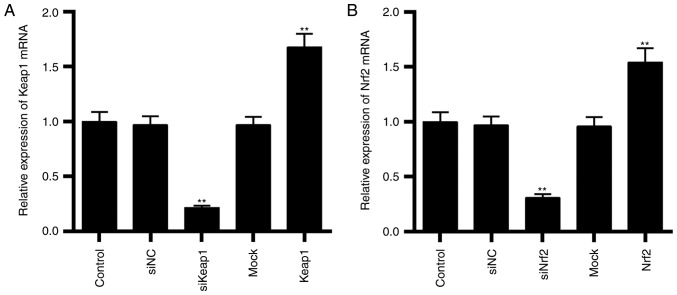
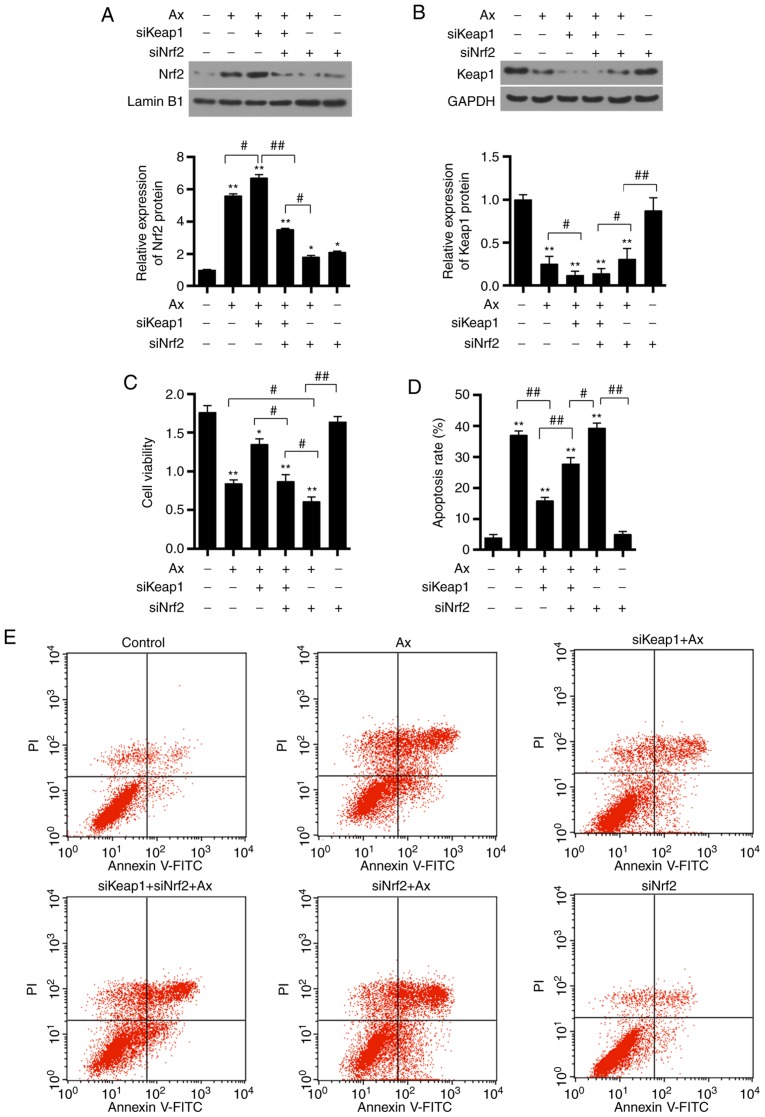
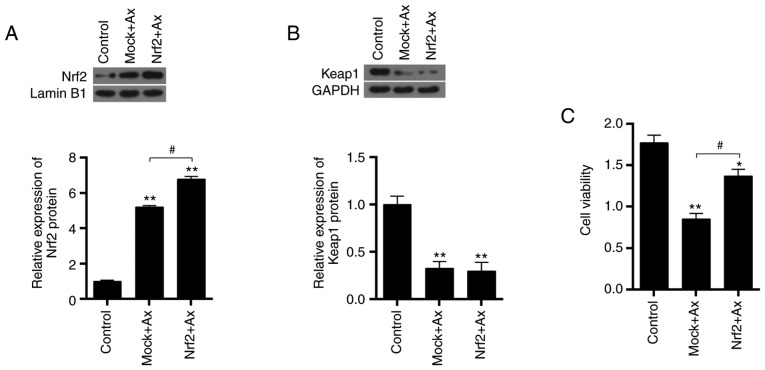
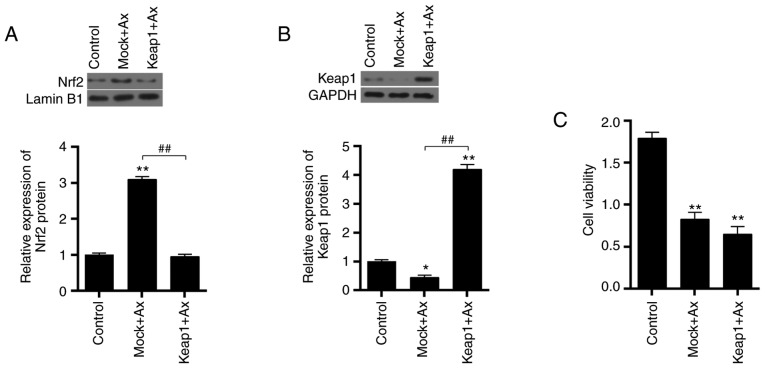
Kelch‑like ECH‑associated protein 1 (Keap1)/nuclear factor erythroid 2‑related factor 2 (Nrf2) signaling has a protective effect on normal cells. A number of previous studies demonstrated that Keap1/Nrf2 signaling is associated with drug resistance in numerous tumors. The aim of the present study was to investigate the roles of Keap1 in renal cell carcinoma (RCC) and its effect on sensitivity to chemotherapy. Reverse transcription‑quantitative polymerase chain reaction was used to detect the mRNA expression of Keap1 in 45 cases of RCC tumors and adjacent normal tissues. A total of five randomly selected patients with RCC, five RCC cell lines and normal renal tubular cells were examined to detect the protein and mRNA expressions of Keap1. The 5‑year survival rate was analyzed by Kaplan‑Meier analysis. The cell viability was assessed by a Cell Counting kit‑8 assay. The cell apoptosis and reactive oxygen species (ROS) were determined by flow cytometry. The expressions of associated proteins were determined by western blot analysis. It was identified that in RCC tissues and RCC cell lines, the expression of Keap1 was downregulated, which was considered to be associated with poor prognosis. In total, 1 µM Axitinib significantly decreased cell viability, promoted ROS release and induced cell apoptosis in ACHN cells. Silencing Keap1 was able to reverse the inhibitory effect of Axitinib and enhance the protein expressions of Nrf2, NAD(P)H dehydrogenase [quinone] 1 and heme oxygenase 1. However, silencing Nrf2 increased the cell sensitivity to Axitinib. Under Axitinib condition, overexpressing Nrf2 was able to increase cell viability; however, overexpressing Keap1 resulted in an opposite effect. Keap1 serves as a tumor suppressor; its low expression was associated with poor prognosis and a decreased sensitivity of RCC cells to Axitinib. A possible mechanism underlying Axitinib resistance may involve Nrf2 overexpression.
Figures

Similar articles
-
FXR1 facilitates axitinib resistance in clear cell renal cell carcinoma via regulating KEAP1/Nrf2 signaling pathway.Anticancer Drugs. 2023 Feb 1;34(2):248-256. doi: 10.1097/CAD.0000000000001416. Epub 2023 Nov 16. Anticancer Drugs. 2023. PMID: 36730618
-
Keap1/Nrf2 pathway in kidney cancer: frequent methylation of KEAP1 gene promoter in clear renal cell carcinoma.Oncotarget. 2017 Feb 14;8(7):11187-11198. doi: 10.18632/oncotarget.14492. Oncotarget. 2017. PMID: 28061437 Free PMC article.
-
Overexpression of miR-200a protects cardiomyocytes against hypoxia-induced apoptosis by modulating the kelch-like ECH-associated protein 1-nuclear factor erythroid 2-related factor 2 signaling axis.Int J Mol Med. 2016 Oct;38(4):1303-11. doi: 10.3892/ijmm.2016.2719. Epub 2016 Aug 26. Int J Mol Med. 2016. PMID: 27573160
-
Nrf2 Signaling in Renal Cell Carcinoma: A Potential Candidate for the Development of Novel Therapeutic Strategies.Int J Mol Sci. 2024 Dec 10;25(24):13239. doi: 10.3390/ijms252413239. Int J Mol Sci. 2024. PMID: 39769005 Free PMC article. Review.
-
Controversy about pharmacological modulation of Nrf2 for cancer therapy.Redox Biol. 2017 Aug;12:727-732. doi: 10.1016/j.redox.2017.04.013. Epub 2017 Apr 8. Redox Biol. 2017. PMID: 28411557 Free PMC article. Review.
Cited by
-
MT1DP loaded by folate-modified liposomes sensitizes erastin-induced ferroptosis via regulating miR-365a-3p/NRF2 axis in non-small cell lung cancer cells.Cell Death Dis. 2020 Sep 14;11(9):751. doi: 10.1038/s41419-020-02939-3. Cell Death Dis. 2020. PMID: 32929075 Free PMC article.
-
Anti-angiogenic and antioxidant effects of axitinib in human retinal endothelial cells: implications in diabetic retinopathy.Front Pharmacol. 2024 Jun 17;15:1415846. doi: 10.3389/fphar.2024.1415846. eCollection 2024. Front Pharmacol. 2024. PMID: 38953109 Free PMC article.
-
Kidney cancer biomarkers and targets for therapeutics: survivin (BIRC5), XIAP, MCL-1, HIF1α, HIF2α, NRF2, MDM2, MDM4, p53, KRAS and AKT in renal cell carcinoma.J Exp Clin Cancer Res. 2021 Aug 12;40(1):254. doi: 10.1186/s13046-021-02026-1. J Exp Clin Cancer Res. 2021. PMID: 34384473 Free PMC article. Review.
-
Keap1-Nrf2 Pathway Regulates ALDH and Contributes to Radioresistance in Breast Cancer Stem Cells.Cells. 2021 Jan 6;10(1):83. doi: 10.3390/cells10010083. Cells. 2021. PMID: 33419140 Free PMC article.
-
Exploring the multifaceted antitumor activity of axitinib in lung carcinoids.Front Endocrinol (Lausanne). 2024 Jul 10;15:1433707. doi: 10.3389/fendo.2024.1433707. eCollection 2024. Front Endocrinol (Lausanne). 2024. PMID: 39050569 Free PMC article.
References
MeSH terms
Substances
LinkOut - more resources
Full Text Sources
Other Literature Sources
Medical
Research Materials