

Exon prediction based on multiscale products of a genomic-inspired multiscale bilateral filtering
- PMID: 30897105
- PMCID: PMC6428306
- DOI: 10.1371/journal.pone.0205050
Exon prediction based on multiscale products of a genomic-inspired multiscale bilateral filtering
Abstract
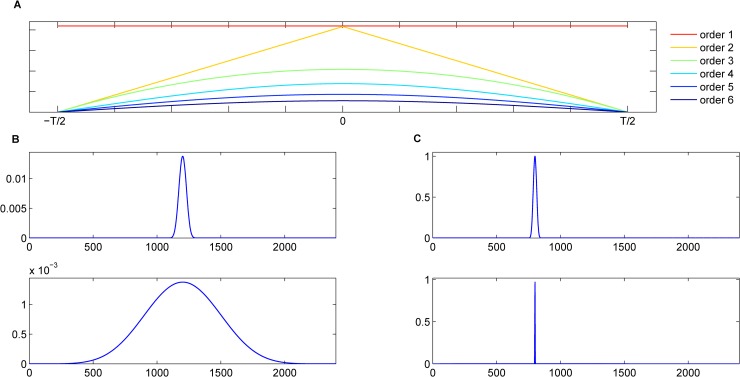
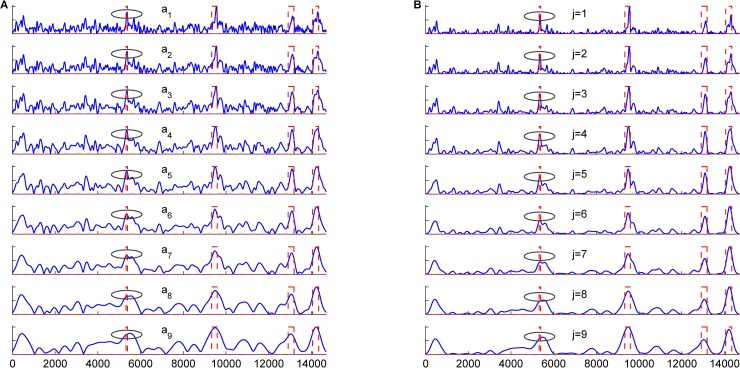
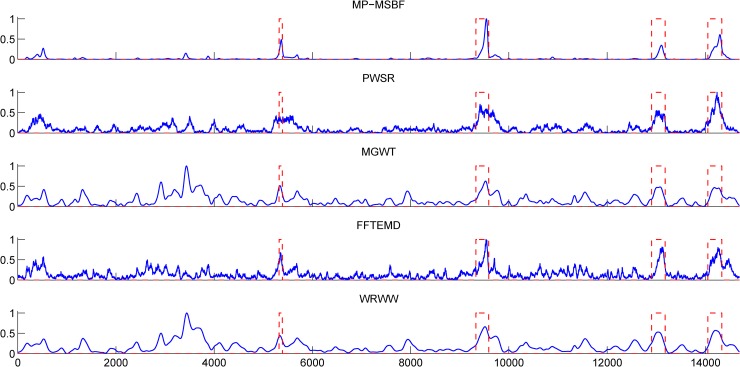
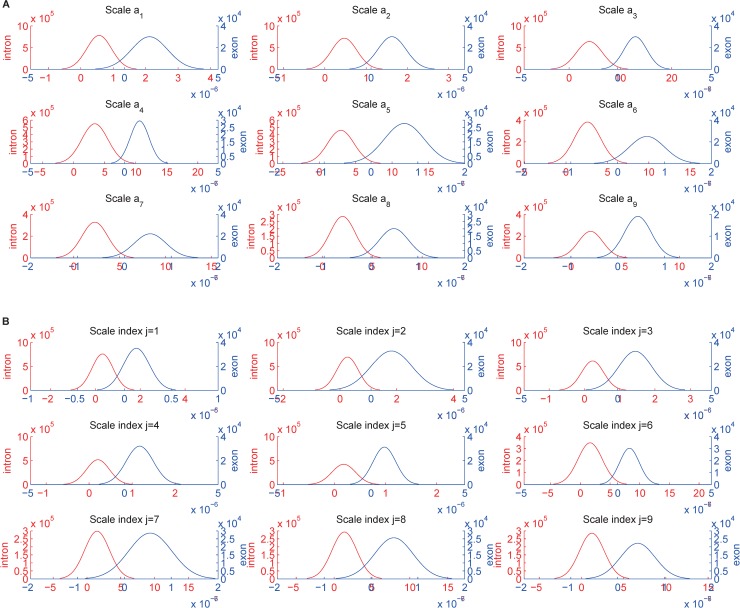
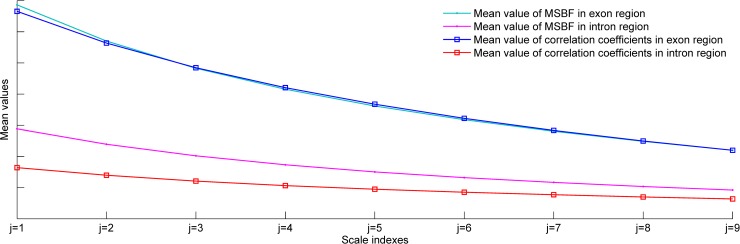
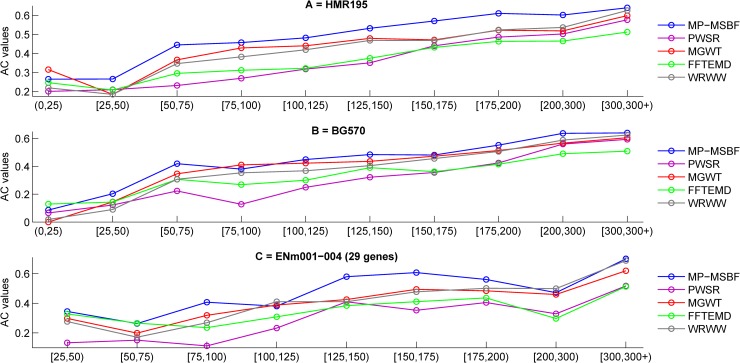
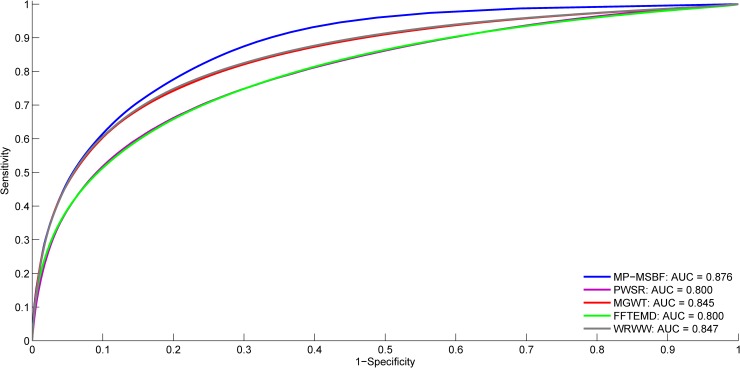
Multiscale signal processing techniques such as wavelet filtering have proved to be particularly successful in predicting exon sequences. Traditional wavelet predictor is domain filtering, and enforces exon features by weighting nucleotide values with coefficients. Such a measure performs linear filtering and is not suitable for preserving the short coding exons and the exon-intron boundaries. This paper describes a prediction framework that is capable of non-linearly processing DNA sequences while achieving high prediction rates. There are two key contributions. The first is the introduction of a genomic-inspired multiscale bilateral filtering (MSBF) which exploits both weighting coefficients in the spatial domain and nucleotide similarity in the range. Similarly to wavelet transform, the MSBF is also defined as a weighted sum of nucleotides. The difference is that the MSBF takes into account the variation of nucleotides at a specific codon position. The second contribution is the exploitation of inter-scale correlation in MSBF domain to find the inter-scale dependency on the differences between the exon signal and the background noise. This favourite property is used to sharp the important structures while weakening noise. Three benchmark data sets have been used in the evaluation of considered methods. By comparison with four existing techniques, the prediction results demonstrate that: the proposed method reveals at least improvement of 4.1%, 50.5%, 25.6%, 2.5%, 10.8%, 15.5%, 11.1%, 12.3%, 9.2% and 2.4% on the exons length of 1-24, 25-49, 50-74, 75-99, 100-124, 125-149, 150-174, 175-199, 200-299 and 300-300+, respectively. The MSBF of its nonlinear nature is good at energy compaction, which makes it capable of locating the sharp variations around short exons. The direct scale multiplication of coefficients at several adjacent scales obviously enhanced exon features while the noise contents were suppressed. We show that the non-linear nature and correlation-based property achieved in proposed predictor is greater than that for traditional filtering, which leads to better exon prediction performance. There are some possible applications of this predictor. Its good localization and protection of sharp variations will make the predictor be suitable to perform fault diagnosis of aero-engine.
Conflict of interest statement
The authors have declared that no competing interests exist.
Figures
Similar articles
-
Short Exon Detection via Wavelet Transform Modulus Maxima.PLoS One. 2016 Sep 16;11(9):e0163088. doi: 10.1371/journal.pone.0163088. eCollection 2016. PLoS One. 2016. PMID: 27635656 Free PMC article.
-
Representation of DNA sequences in genetic codon context with applications in exon and intron prediction.J Bioinform Comput Biol. 2015 Apr;13(2):1550004. doi: 10.1142/S0219720015500043. Epub 2014 Dec 10. J Bioinform Comput Biol. 2015. PMID: 25491390
-
Detection of exon location in eukaryotic DNA using a fuzzy adaptive Gabor wavelet transform.Genomics. 2020 Nov;112(6):4406-4416. doi: 10.1016/j.ygeno.2020.07.020. Epub 2020 Jul 24. Genomics. 2020. PMID: 32717319
-
Advances in the Exon-Intron Database (EID).Brief Bioinform. 2006 Jun;7(2):178-85. doi: 10.1093/bib/bbl003. Epub 2006 Mar 9. Brief Bioinform. 2006. PMID: 16772261 Review.
-
DNA numerical encoding schemes for exon prediction: a recent history.Nucleosides Nucleotides Nucleic Acids. 2021;40(10):985-1017. doi: 10.1080/15257770.2021.1966797. Epub 2021 Aug 28. Nucleosides Nucleotides Nucleic Acids. 2021. PMID: 34455915 Review.
Cited by
-
Consistent Clustering Pattern of Prokaryotic Genes Based on Base Frequency at the Second Codon Position and its Association with Functional Category Preference.Interdiscip Sci. 2022 Jun;14(2):349-357. doi: 10.1007/s12539-021-00493-w. Epub 2021 Nov 24. Interdiscip Sci. 2022. PMID: 34817803 Free PMC article.
References
-
- Wu Y, Liew AW-C, Yan H, Yang M. Classification of short human exons and introns based on statistical features. Phys Rev E. 2003;67(6):061916. - PubMed
-
- Jiang R, Yan H. Studies of spectral properties of short genes using the wavelet subspace Hilbert–Huang transform (WSHHT). Physica A: Statistical Mechanics and its Applications. 2008;387(16):4223–47.
-
- Jiang R, Yan H. Segmentation of short human exons based on spectral features of double curves. Int J Data Min Bioinform. 2008;2(1):15–35. - PubMed
Publication types
MeSH terms
Substances
LinkOut - more resources
Full Text Sources
