. 2019 Mar 21;14(3):e0214072.
doi: 10.1371/journal.pone.0214072. eCollection 2019.

Two-photon fluorescence and second harmonic generation characterization of extracellular matrix remodeling in post-injury murine temporomandibular joint osteoarthritis

Affiliations

Two-photon fluorescence and second harmonic generation characterization of extracellular matrix remodeling in post-injury murine temporomandibular joint osteoarthritis

David A Reed et al. PLoS One. .

Abstract

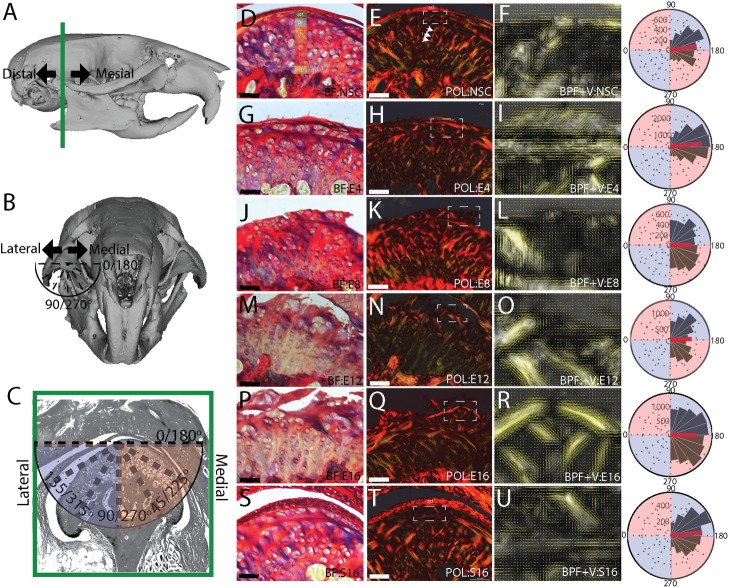
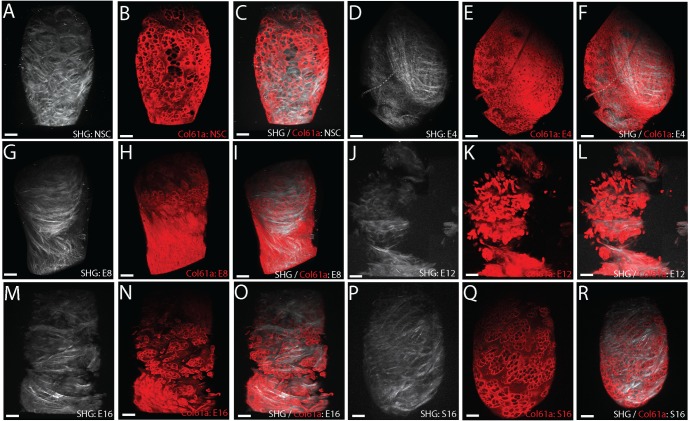
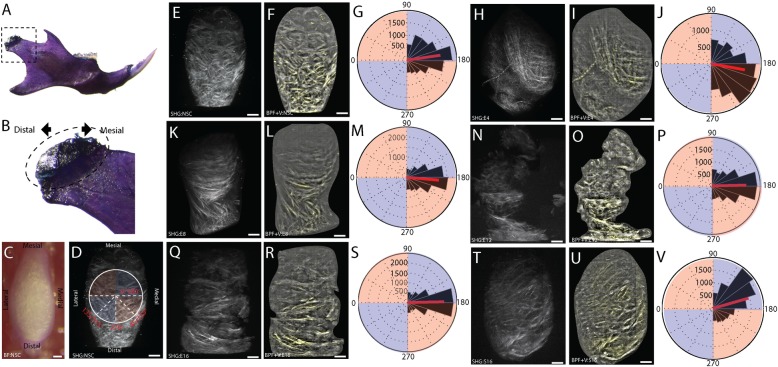
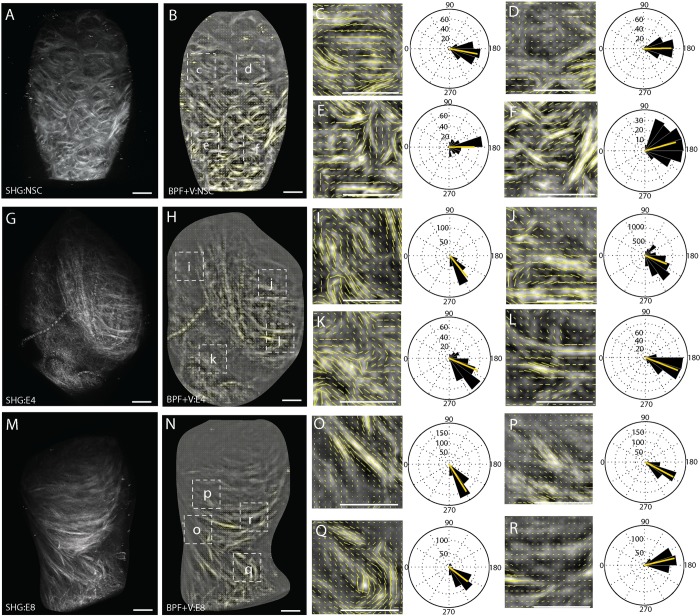
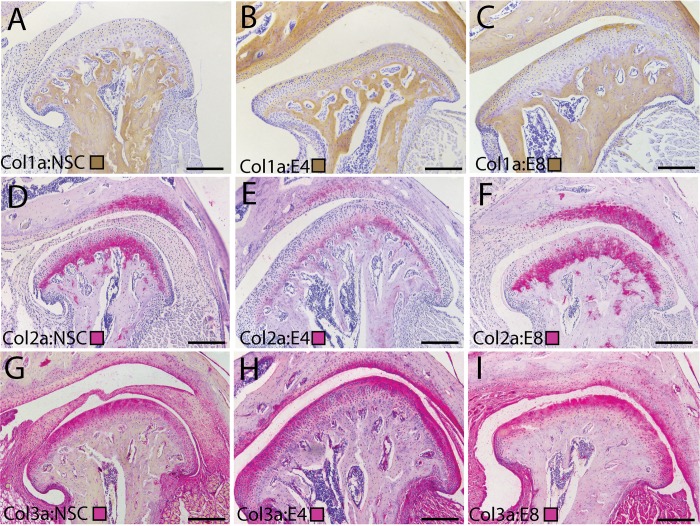
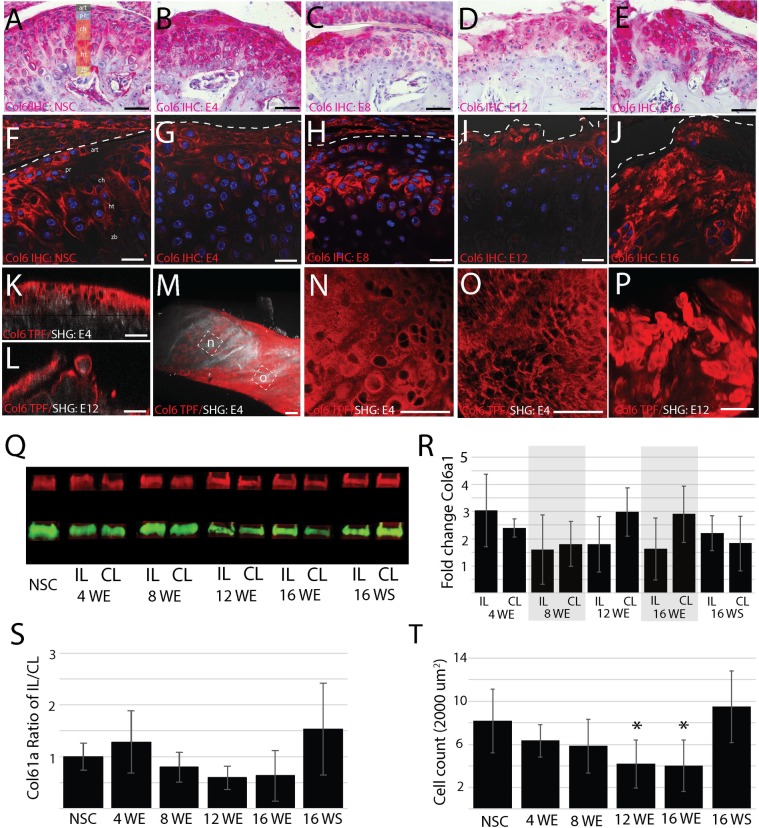
End stage temporomandibular joint osteoarthritis (TMJ-OA) is characterized by fibrillations, fissures, clefts, and erosion of the mandibular condylar cartilage. The goal of this study was to define changes in pericellular and interterritorial delineations of the extracellular matrix (ECM) that occur preceding and concurrent with the development of this end stage degeneration in a murine surgical instability model. Two-photon fluorescence (TPF) and second harmonic generation (SHG) microscopy was used to evaluate TMJ-OA mediated changes in the ECM. We illustrate that TPF/SHG microscopy reconstructs the three-dimensional network of key fibrillar and micro-fibrillar collagens altered during the progression of TMJ-OA. This method not only generates spatially distinct pericellular and interterritorial delineations of the ECM but distinguishes early and end stage TMJ-OA by signal organization, orientation, and composition. Early stage TMJ-OA at 4- and 8-weeks post-injury is characterized by two structurally distinct regions containing dense, large fiber collagens and superficial, small fiber collagens rich in types I, III, and VI collagen oriented along the mesiodistal axis of the condyle. At 8-weeks post-injury, type VI collagen is locally diminished on the central and medial condyle, but the type I/III rich superficial layer is still present. Twelve- and 16-weeks post-injury mandibular cartilage is characteristic of end-stage disease, with hypocellularity and fibrillations, fissures, and clefts in the articular layer that propagate along the mediolateral axis of the MCC. We hypothesize that the localized depletion of interterritorial and pericellular type VI collagen may signify an early marker for the transition from early to end stage TMJ-OA, influence the injury response of the tissue, and underlie patterns of degeneration that follow attritional modes of failure.


Conflict of interest statement

The authors have declared that no competing interests exist.

Figures

Fig 1
Fig 1. Picrosirius enhanced polarizing microscopy of TMJ-OA.
Changes in the organization and orientation of the superficial layer extracellular matrix associated with the progression of TMJ-OA. Reconstructions of a mouse cranium and mandible defining the mesiodistal axis, the mediolateral axis, and orientation of the vectors in the frontal anatomical plane (A-C). Tissue from a non-surgical control (D-F) is compared to 4 (G-I), 8 (J-L), 12 (M-O), and 16 (P-R) week post-injury and 16 week sham controls (S-U). The mandibular cartilage has a heterogenous cell population defined in D: articular (art), proliferative (pr), chondroblastic (ch), hypertrophic (ht) and the zone of bone formation (zb). BF labeled images are picrosirius enhanced bright field, POL labeled images are picrosirius enhanced circular polarizing light microscopy, BPF+V are band pass filtered POL images with vector field mapping of fiber orientation. All images are representative of the experimental group (E8 and S16 n = 3; all others n = 4). Rose plots illustrate the distribution of vector orientations from all samples in each group with vector orientations defined in C. The red line on the rose plot represents the population mean. Vector field is plotted from a quantitative orientation analysis from a region of interest defining the superficial layer cartilage defined in the BF image by a dashed box. All vector lengths are scaled to energy density. Scale bars equal 50 μm and BPF+V image are zoomed to a width of 50 μm. Medial is to the right in all images.
Fig 2
Fig 2. TFP and SHG microscopy of TMJ-OA.
Type VI collagen TPF and SHG reconstructions illustrating TMJ-OA associated changes in the organization of both the PCM and the underlying interterritorial ECM in the mandibular condylar cartilage that distinguish early and end stages of the disease. Non-surgical control tissue (A-C) is compared with 4 (D-F), 8 (G-I), 12 (J-L) and 16 (M-O) week post-injury tissue, and 16-week sham controls (P-R). SHG signal reconstructions are represented in white. Whole mount type VI collagen TPF reconstructions are represented in red. All images are superior views from three-dimensional reconstructions of the mandibular condylar cartilage. Scale bars equal 50 μm. Mesial is to the top and medial is to the right in all images. Consistent with the presentation of early stage TMJ-OA, note the presence of thin fiber collagens in the superficial layer cartilage in 4 (D) and 8 (G) week post-injury tissues. Consistent with the presentation of end stage TMJ-OA, note dislocations in the integrity of the SHG and TPF reconstructions in 12 (J-L) and 16 (M-O) week post injury tissues. All reconstructions are representative of experimental groups (E12 and S16 n = 3; all others n = 4).
Fig 3
Fig 3. Quantitative orientation analysis of SHG.
Quantitative orientation analysis from a band pass filtered SHG reconstructions illustrating TMJ-OA associated changes in the organization of interterritorial ECM in the mandibular condylar cartilage. The orientation of the mandibular condylar cartilage (MCC) is defined (A-B), with a bright field images of the embedded MCC (C) and the SHG scan of that sample defining the mesiodistal axis, the mediolateral axis, and orientation of the vectors. Mesial is to the top and medial is to the right in all images. Non-surgical control tissue (E-G) is compared with 4 (H-J), 8 (K-M), 12 (N-P), and 16 (Q-S) week post-injury and 16-week sham-control (T-V) tissues. All vectors lengths are scaled to energy density. All vector fields are representative of the experimental group (E12 and S16 n = 3; all others n = 4). The vector orientations of each reconstruction are compared using rose plots with the mean orientation plotted in red. 180° represents a mediolateral vector orientation. Scale bars equal 50 μm.
Fig 4
Fig 4. Regional quantitative orientation analysis of early stage TMJ OA.
Vector field analysis from a band pass filtered SHG reconstructions illustrating regional variations in the organization of interterritorial ECM in the mandibular condylar cartilage during TMJ-OA. Non-surgical control tissue (A-E) is compared with 4 (F-J) and 8 (K-O) week post-injury tissues. To quantify regional variations in the vector field, four distinct regions of interest are defined from the whole tissue SHG reconstruction as defined in A, F, and K. Cubic spline gradient defined vector field analysis was carried out for each region of interest with vector length scaled to energy density. Scale bars equal 50 μm. Mesial is to the top and medial is to the right in all images. The vector orientations of each reconstruction are compared using rose plots with the mean orientation plotted in red. 180° represents a mediolateral vector orientation.
Fig 5
Fig 5. Changes in superficial layer collagens during early stage TMJ OA.
Immunolabeling of fibrillar collagens in the TMJ illustrating changes in the composition of the superficial layer extracellular matrix that accompanies the progression of early stage TMJ-OA. Collagen I (A-C) is immunolabeled using a brown chromogen. Collagen II (D-F) and Collagen III (G-I) are immunolabeled using a pink chromogen. Cell nuclei are labeled in purple with hematoxylin. Tissues from non-surgical controls (A, D, G) are compared with 4 (B, E, H) and 8 (C, F, I) week post-injury tissues. All images are representative of their experimental group (n = 3) and taken from homologous regions of the mandibular condyle. Differences in the shape of the condylar reflect variable amounts of condylar flattening, typical of the surgical model. Medial is to the right in all joints. Scale bars equal 50 μm. Note strong staining for Collagens I/III in the superficial layer in post-injury tissues, with Collagen II restricted to the deeper chondroblastic/hypertrophic layers. Primary and secondary antibody controls were negative.
Fig 6
Fig 6. Changes in type VI collagen during TMJ OA.
Characterization of changes in the distribution, organization, and level of type VI collagen distinguishing early and late stage TMJ-OA. Chromogenic (A-E) and fluorescent immunohistochemistry (F-J) comparing non-surgical controls (A,F) to 4 (B, G), 8 (C, H), 12 (D, I), and 16 (E, J) week post-injury tissue. Note that the thickened superficial layer immediately below the dotted line in 4-week post-injury tissue is rich in type VI collagen in the interterritorial regions (B, G). The homologous region in 8-week tissue has lower levels of type VI collagen but the superficial layer remains intact (C, H). This superficial layer becomes disorganized, with dislocations and fibrillation in 12 (D, J) and 16 (E, J) week post-injury tissue. Dual type VI collagen TPF and SHG reconstructions illustrate a similar pattern, with high levels of type VI collagen present in the interterritorial matrix of 4-week post-injury tissue (K, M, N) and lose of matrix integrity at 12 weeks (L, P). Note that regional differences in the distribution of type VI collagen are observed in early stage TMJ-OA (M). Large diameter pericellular encapsulation are found near the center of the condyle (N) and small diameter pericellular encapsulation are found near the mesial edge of the condyle. Interterritorial staining is absent from 12-week post-injury tissue (P) Scale bars equal 50 μm. Western blot analysis illustrates that the amount of type VI collagen ipsilateral to injury increases at 4 weeks and then lowers (Q-S). Cell count in the superficial layer also lowers relative to non-surgical controls in late stage TMJ-OA at 12- and 16-weeks post-injury (T).

Similar articles

Cited by

References

    1. Chen Y-J, Shih TT-F, Wang J-S, Wang H-Y, Shiau Y-Y. Magnetic resonance images of the temporomandibular joints of patients with acquired open bite. Oral Surgery, Oral Medicine, Oral Pathology, Oral Radiology, and Endodontology. 2005;99(6):734–42. 10.1016/j.tripleo.2004.10.020 - DOI - PubMed
    1. Tanaka E, Detamore M, Mercuri L. Degenerative disorders of the temporomandibular joint: etiology, diagnosis, and treatment. J Dent Res. 2008;87(4):296–307. 10.1177/154405910808700406 - DOI - PubMed
    1. Helmy E, Bays R, Sharawy M. Osteoarthrosis of the temporomandibular joint following experimental disc perforation in Macaca fascicularis. J Oral Maxillofac Surg. 1988;46(11):979–90. - PubMed
    1. Li L, Wang L, Sun Y, Yang C, He D. Establishment and histological evaluation of a goat traumatic temporomandibular joint model. J Oral Maxillofac Surg. 2015;73(5):943–50. 10.1016/j.joms.2014.12.038 - DOI - PubMed
    1. Israel HA, Langevin C-J, Singer MD, Behrman DA. The relationship between temporomandibular joint synovitis and adhesions: pathogenic mechanisms and clinical implications for surgical management. J Oral Maxillofac Surg. 2006;64(7):1066–74. 10.1016/j.joms.2006.03.012 - DOI - PubMed

Publication types

MeSH terms