. 2019 Mar 21;14(3):e0213917.
doi: 10.1371/journal.pone.0213917. eCollection 2019.

Sphingosine kinase and sphingosine-1-phosphate regulate epithelial cell architecture by the modulation of de novo sphingolipid synthesis

Affiliations

Sphingosine kinase and sphingosine-1-phosphate regulate epithelial cell architecture by the modulation of de novo sphingolipid synthesis

Bruno Jaime Santacreu et al. PLoS One. .

Abstract

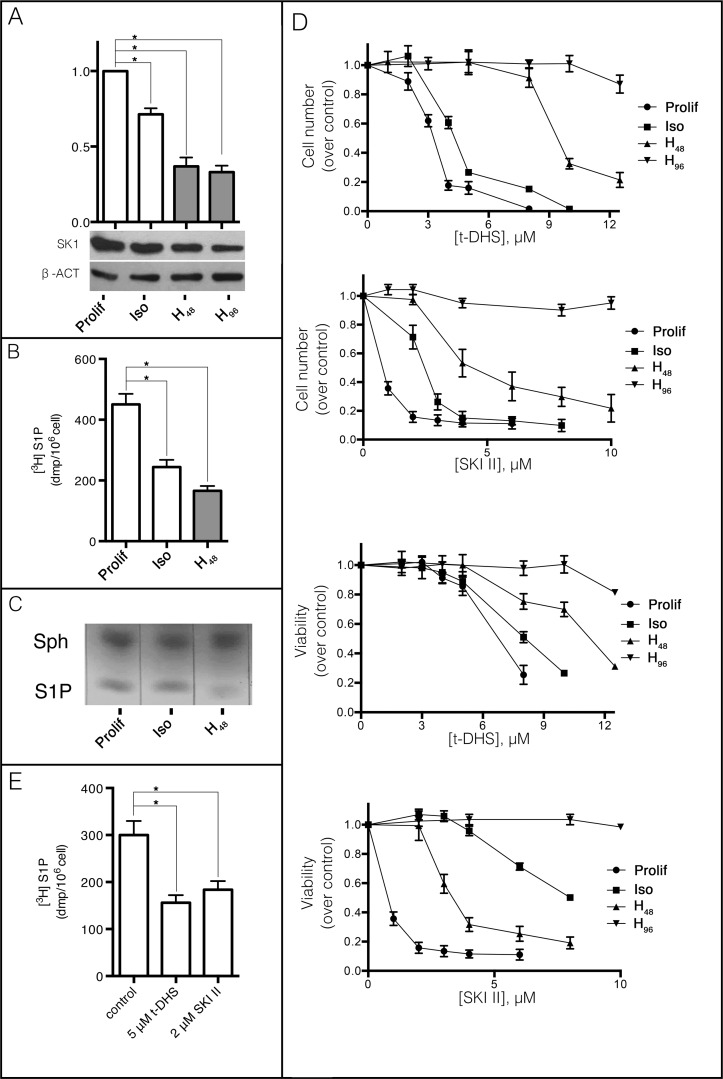
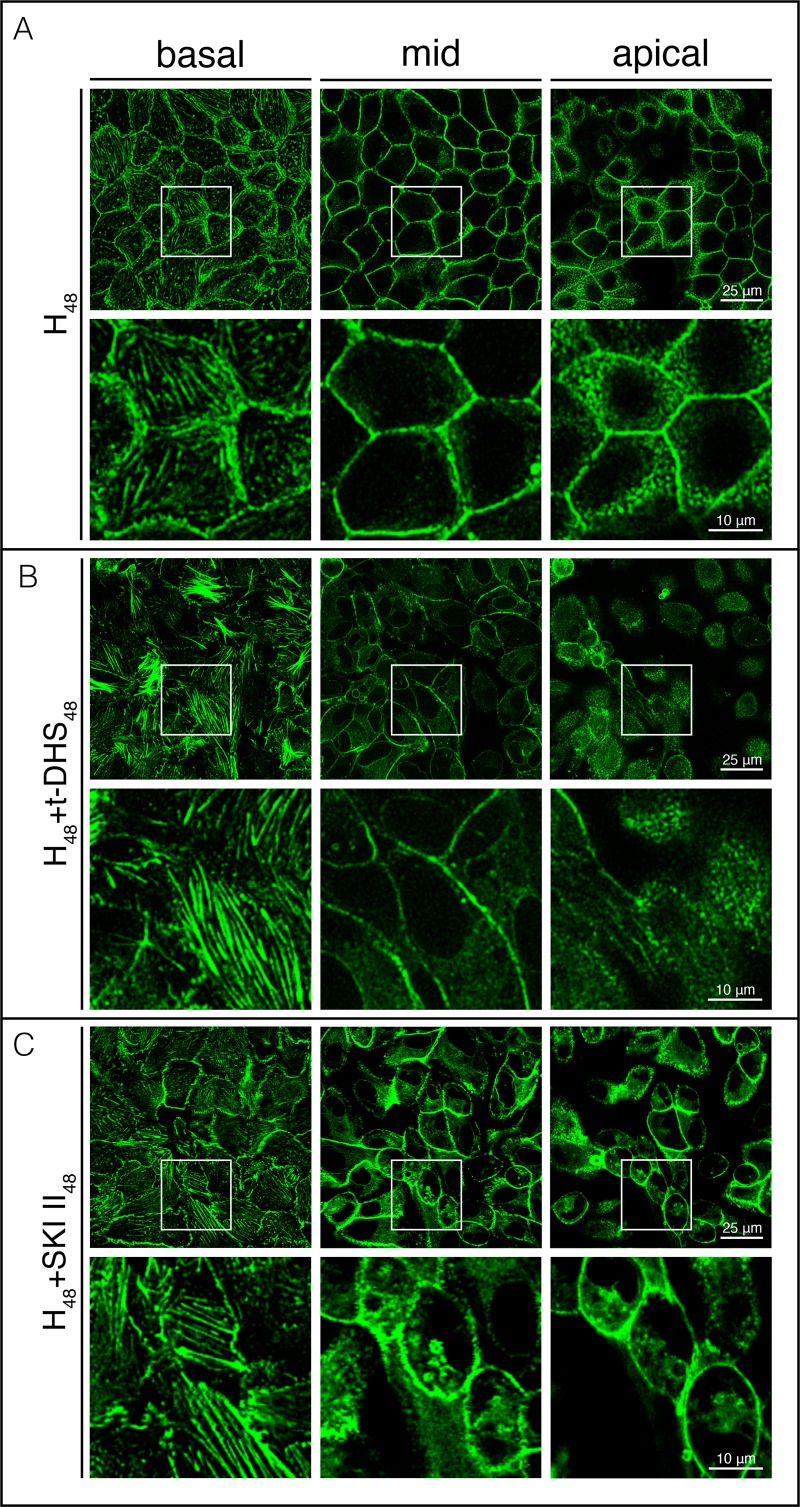
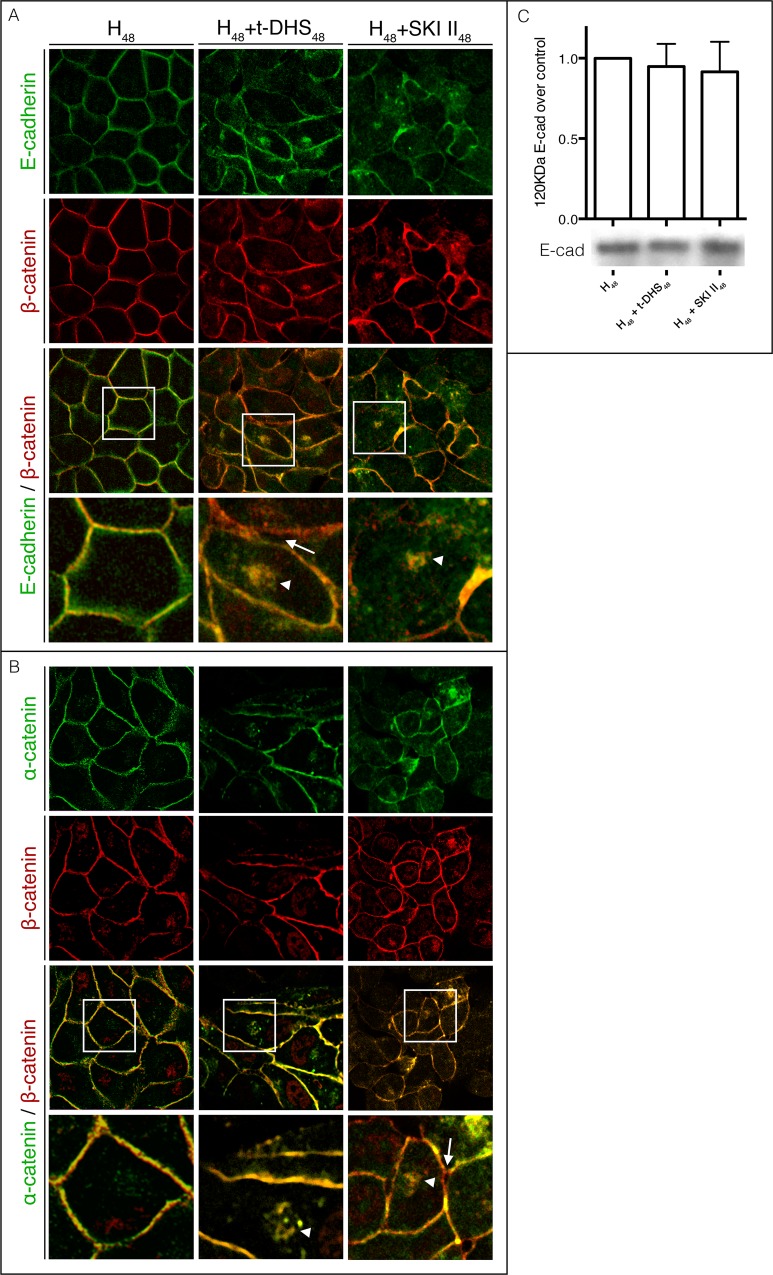
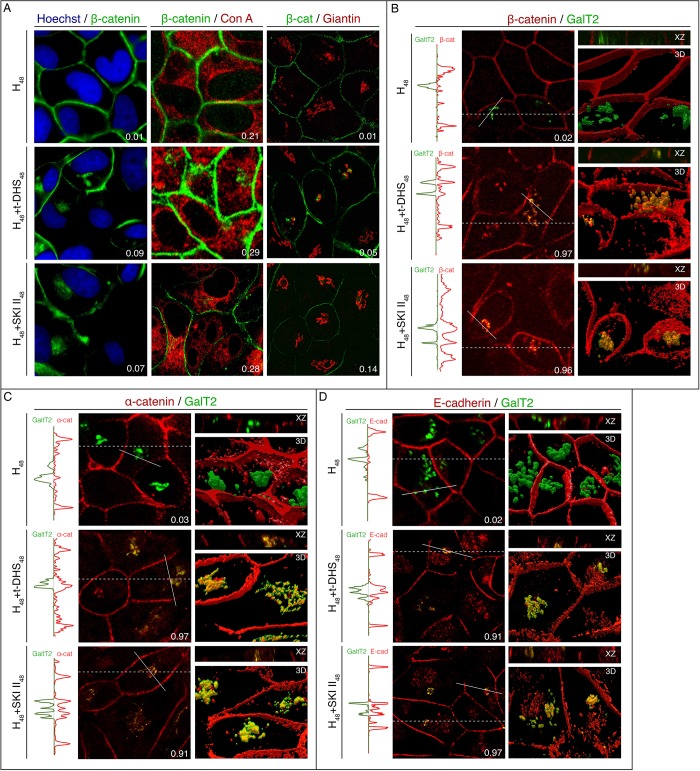
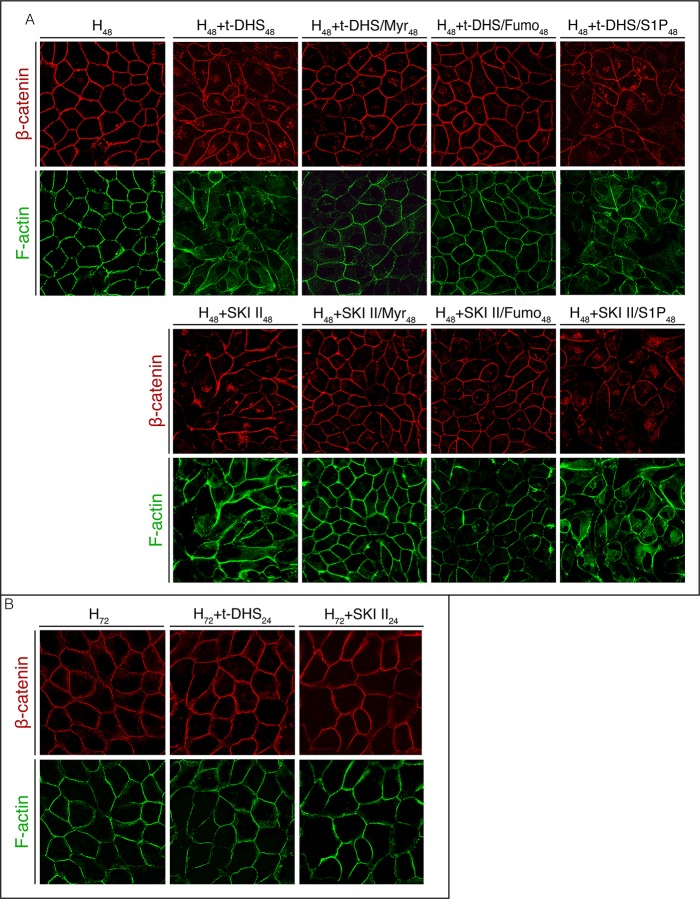
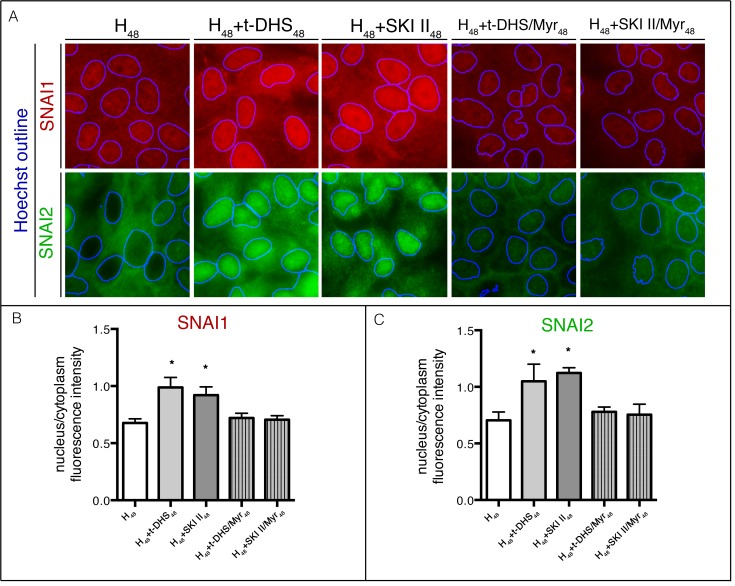
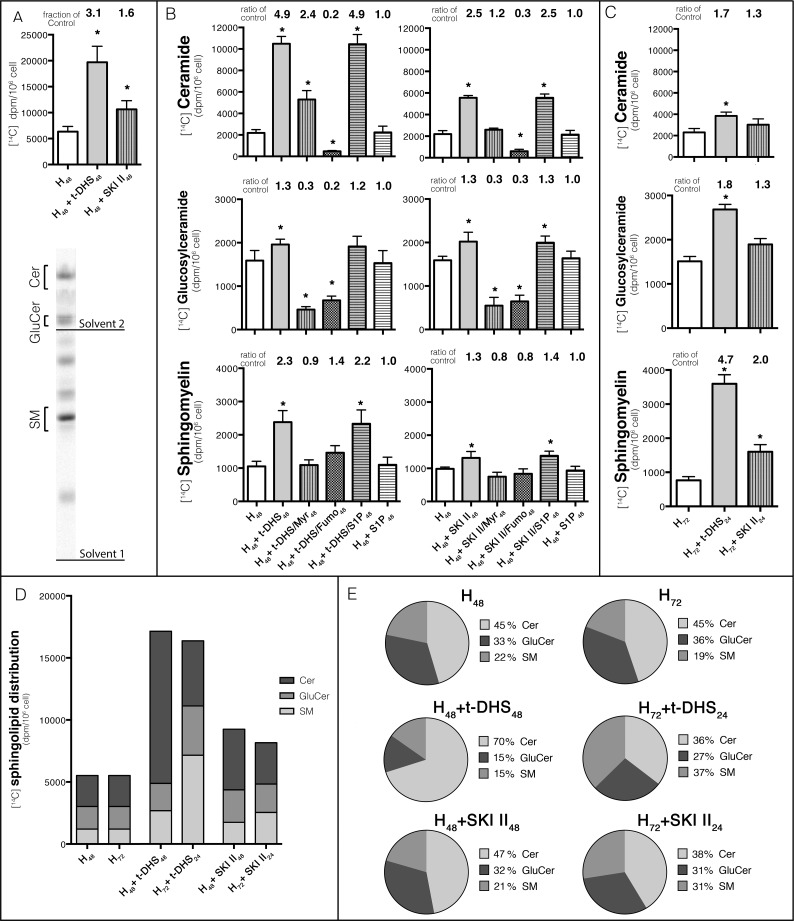
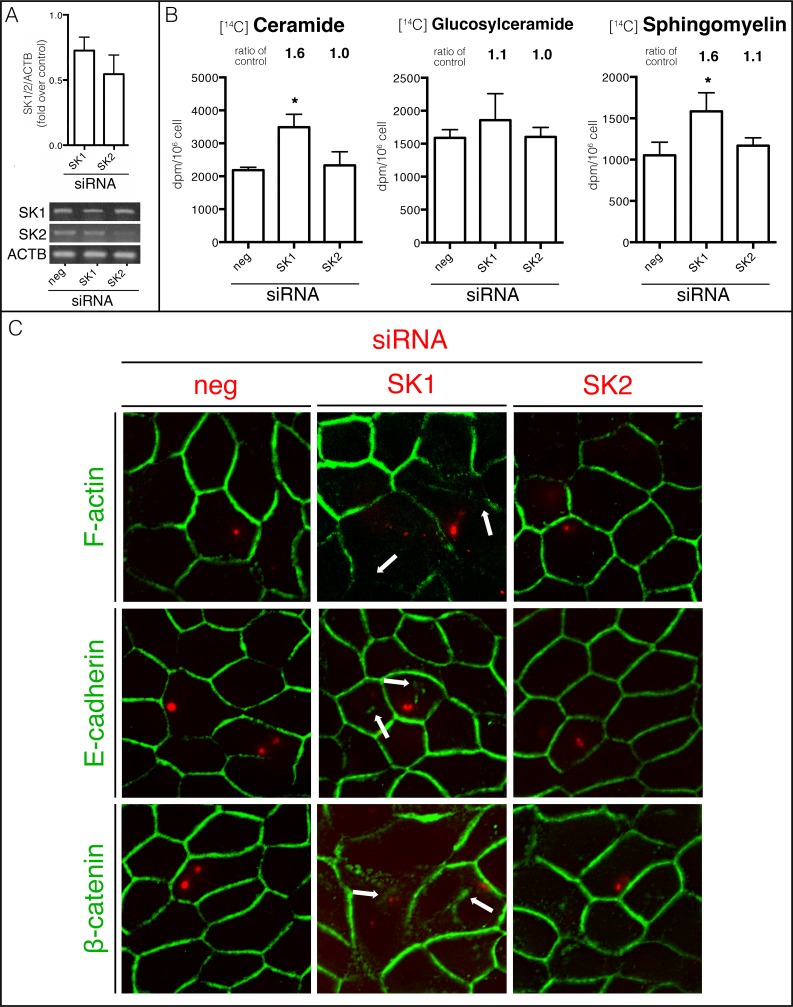
Sphingolipids regulate several aspects of cell behavior and it has been demonstrated that cells adjust their sphingolipid metabolism in response to metabolic needs. Particularly, sphingosine-1-phosphate (S1P), a final product of sphingolipid metabolism, is a potent bioactive lipid involved in the regulation of various cellular processes, including cell proliferation, cell migration, actin cytoskeletal reorganization and cell adhesion. In previous work in rat renal papillae, we showed that sphingosine kinase (SK) expression and S1P levels are developmentally regulated and control de novo sphingolipid synthesis. The aim of the present study was to evaluate the participation of SK/S1P pathway in the triggering of cell differentiation by external hypertonicity. We found that hypertonicity evoked a sharp decrease in SK expression, thus activating the de novo sphingolipid synthesis pathway. Furthermore, the inhibition of SK activity evoked a relaxation of cell-cell adherens junction (AJ) with accumulation of the AJ complex (E-cadherin/β-catenin/α-catenin) in the Golgi complex, preventing the acquisition of the differentiated cell phenotype. This phenotype alteration was a consequence of a sphingolipid misbalance with an increase in ceramide levels. Moreover, we found that SNAI1 and SNAI2 were located in the cell nucleus with impairment of cell differentiation induced by SK inhibition, a fact that is considered a biochemical marker of epithelial to mesenchymal transition. So, we suggest that the expression and activity of SK1, but not SK2, act as a control system, allowing epithelial cells to synchronize the various branches of sphingolipid metabolism for an adequate cell differentiation program.


Conflict of interest statement

The authors have declared that no competing interests exist.

Figures

Fig 1
Fig 1. Decrease in SK expression and activity during MDCK cell differentiation.
(A) SK protein levels in proliferative (Prolif), polarized (Iso) and differentiated for 48 (H48) or 96 h (H96) MDCK cells. β-actin was used as endogenous control. (B) SK activity was measured using [3-3H] sphingosine as substrate. Prolif, Iso or H48 MDCK cells were incubated with 0.6 μCi [3-3H] sphingosine for 4 h. Radioactive spots corresponding to [3H] S1P on the TLC were scraped and quantified as described under Materials and Methods. (C) S1P from sphingolipid extract derived from Prolif, Iso and H48 cells was resolved by TLC and visualized by iodine staining. (D) Cell number and viability were obtained after 48 h in continued SK inhibition conditions with t-DHS or SKI II in Prolif, Iso, H48 and H96. (E) During MDCK hypertonicity-induced cell differentiation, SK activity was determined by incubation with [3H] sphingosine in the presence or absence of SK inhibitors (t-DHS, SKI II). Data are given as mean ± SD with n = 3, *p < 0.05.
Fig 2
Fig 2. SK inhibition induces actin cytoskeleton reorganization.
During MDCK cell differentiation by hypertonicity (Control: Hyper) (A), monolayers were subjected to SK inhibition by t-DHS (B) or SKI II (C). Fixed-cell monolayers were labeled for F-actin with phalloidin-FITC and images were taken by confocal microscopy in 4-μm sections, determining basal, middle (mid) and apical cell planes. High magnification insets of the open rectangles are shown below each image.
Fig 3
Fig 3. SK inhibition during cell differentiation causes AJ alterations.
During MDCK cell differentiation by hypertonicity, monolayers were submitted to SK inhibition (t-DHS or SKI II). Middle confocal planes of monolayers labeled for (A) E-cad (green) and β-cat (red) or (B) α-cat (green) and β-cat (red) and the corresponding merge are shown. High magnification insets of the open rectangles in merge images are shown below each panel. (C) E-cad protein level was determined by Western Blot in differentiated cells (H48), or cells treated with t-DHS or SKI (H48+t-DHS48 or H48+SKI II48). White arrows indicate zones where cell-cell junction appears separated. White arrowheads indicate intracellular accumulation of AJ complex proteins. The pre-treatment with t-DHS or SKI II caused a deterioration of AJs, evidenced by the appearance of zones where cell-cell separation (arrow) and loss of E-cad and β-cat colocalization accompanied by dissipation from the cell limits were evident, especially in SKI II-treated cells. It is interesting to note the presence of intracellular accumulation of colocalized E-cad and β-cat when cells were treated with the SK inhibitors (arrowhead). Fig 3B shows the localization of α-cat in relationship with β-cat. As before, in differentiated MDCK cells, both proteins colocalized in the periphery of the cells, but the inhibition of SK by t-DHS or SKI II impaired the cell-cell contact denoted by zones where cells lost their contacts and some cells appeared completely separated (arrow), which is more evident in the magnified images. Again, α-cat appeared intracellularly accumulated, colocalizing with β-cat (arrowhead). Taken together, these results demonstrate that the E-cad, β-cat and α-cat complex delocalized from the cell-cell contact and accumulated intracellularly when SK activity was blocked, with the consequent impairment of cell-cell adhesion. Interestingly, although there was a change in the distribution of E-cad, the immunoblot showed no changes between control cells (H48) and cells treated with t-DHS or SKI II (H48+t-DHS48 or H48+SKI II48) (Fig 3C).
Fig 4
Fig 4. SK inhibition causes accumulation of the AJ protein complex in the TGN.
Optical confocal sections perpendicular to the apico-basal axis of the monolayer showing β-cat, nucleus, endoplasmic reticulum and Golgi markers. Dual-color immunofluorescence colocalization was performed on MDCK cells grown on glass coverslips and treated with t-DHS or SKI II. (A) Cells were stained with anti-β-cat (green), and Hoechst for the nucleus (blue), concanavalin A for the endoplasmic reticulum (red) or anti-giantin for the cis/medial-Golgi (red). (B, C, D) MDCK cells transfected with GalT2-YFP (TGN marker) were treated with t-DHS or SKI II for 48 h, fixed and labeled in red for β-cat (B), α-cat (C) or E-cad (D). To the right of each panel, a XZ plane (dotted line in XY plane images) and 3D reconstruction are shown. To the left of each panel, line profiles are displayed in vertical format (solid line in XY plane images). (A-D) Manders’ coefficients (m1) are shown in the right inferior angle of each XY image.
Fig 5
Fig 5. Blocking de novo sphingolipid synthesis protects from the impact of SK inhibition.
The acquisition of the differentiated phenotype was visualized. (A) SK inhibition (H48+t-DHS48 or H48+SKI II48) was combined with Myr, Fumo (H48+t-DHS/Myr48 or H48+SKI II/Fumo48) or exogenous S1P(H48+t-DHS/S1P48 or H48+SKI II/S1P48). (B) After 48 h of hypertonicity, cells were treated with t-DHS or SKI II for 24 additional hours in hypertonic medium (H72, H72+t-DHS24, H72+SKI II24).
Fig 6
Fig 6. Endogenous SNAI1 and SNAI2 are distributed in the nucleus of SK-inhibited cells.
(A) MDCK cells under hypertonicity (H48) in the presence of t-DHS, SKI II and t-DHS or SKI II in combination with Myr were labeled for SNAI1 (red) or SNAI2 (green) and the nucleus by Hoechst. Nuclei are shown as outlines of the Hoechst-positive pixels. Quantification of SNAI1 (B) or SNAI2. (C) Fluorescence intensity quantification is shown as the nucleus/cytoplasm ratio. Data are given as mean ± SD with n = 3, *p< 0.05.
Fig 7
Fig 7. SK inhibition induces an increase in de novo sphingolipid synthesis.
MDCK cells were labeled with [14C] palmitic acid for 4 hours before trypsinization. Sphingolipids were developed in two solvent systems: first in butanol:acetic acid:water (60:20:20, v/v/v; solvent 1), and the top portion of the TLC was run in solvent 2 (chloroform:methanol, 50:1.5, v/v) and detected by autoradiograph. The radioactivity associated with the cells and culture medium was quantified using liquid scintillation for all spots. (A) Total [14C] palmitic acid incorporation in H48 and t-DHS- and SKI II-treated cells (above), representative TLC plate (below). (B) Incorporation of [14C] palmitic acid to Cer, GluCer and SM in cells subjected to hypertonicity (H48) in the presence of t-DHS or SKI II and combination with Myr, Fumo and S1P. (C) [14C] palmitic acid incorporation to Cer, GluCer and SM in cells that were differentiated for 48 hours in the presence of hypertonicity and then treated with t-DHS or SKI II for 24 additional hours under hypertonicity (H72, H72+t-DHS24, H72+SKI II24). (D) Total and (E) relative [14C] palmitic incorporation to Cer, GluCer and SM are shown for the different conditions. Data are given as mean ± SD with n = 3, *p < 0.05.
Fig 8
Fig 8. SK1 participates in MDCK cell differentiation.
MDCK cells were transfected with 100 nM double-stranded siRNAs for SK1, SK2 or negative sequence. (A) SK1- or SK2-specific siRNA knockdown were checked by RT-PCR analysis (ACTB serves as internal control). (B) Cells were labeled with [14C] palmitic acid for 4 hours before trypsinization. Sphingolipids were developed by TLC and [14C] palmitic acid incorporation to Cer, GluCer and SM were quantified using liquid scintillation. (C) To identify transfected cells, monolayers were cotransfected with an Alexa546-labeled non-targeting siRNA whose signal is shown as red spots in the transfected cells. After treatment, fixed-cell monolayers were labeled for F-actin with phalloidin-FITC, E-cad and β-cat. Data are given as mean ± SD with n = 3, *p < 0.05.

Similar articles

Cited by

References

    1. Bartke N, Hannun YA. Bioactive sphingolipids: metabolism and function. J Lipid Res. American Society for Biochemistry and Molecular Biology; 2009;50: S91–S96. 10.1194/jlr.R800080-JLR200 - DOI - PMC - PubMed
    1. van Echten G, Birk R, Brenner-Weiss G, Schmidt RR, Sandhoff K. Modulation of sphingolipid biosynthesis in primary cultured neurons by long chain bases. J Biol Chem. United States; 1990;265: 9333–9339. - PubMed
    1. Merrill AHJ. Sphingolipid and glycosphingolipid metabolic pathways in the era of sphingolipidomics. Chem Rev. United States; 2011;111: 6387–6422. 10.1021/cr2002917 - DOI - PMC - PubMed
    1. Hanada K. Serine palmitoyltransferase, a key enzyme of sphingolipid metabolism. Biochim Biophys Acta. Netherlands; 2003;1632: 16–30. - PubMed
    1. Hannun YA, Obeid LM. Principles of bioactive lipid signalling: lessons from sphingolipids. Nature Publishing Group; 2008;9: 139 10.1038/nrm2329 - DOI - PubMed

Publication types

MeSH terms