

Transcriptional profiles in the chicken ductus arteriosus during hatching
- PMID: 30897181
- PMCID: PMC6428269
- DOI: 10.1371/journal.pone.0214139
Transcriptional profiles in the chicken ductus arteriosus during hatching
Abstract
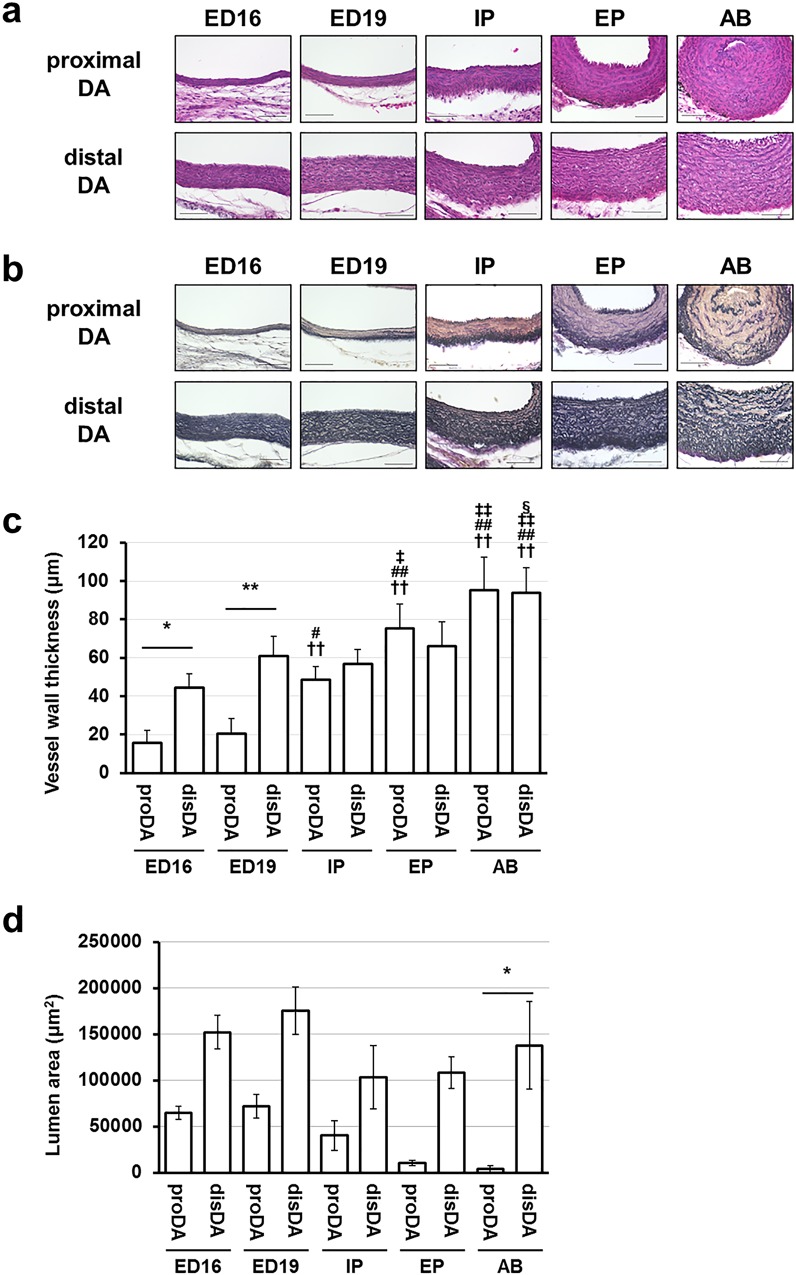
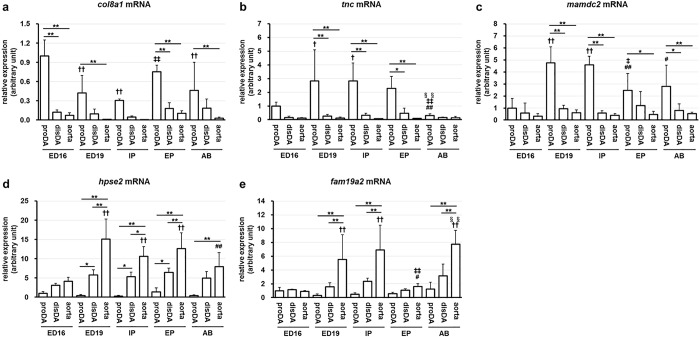
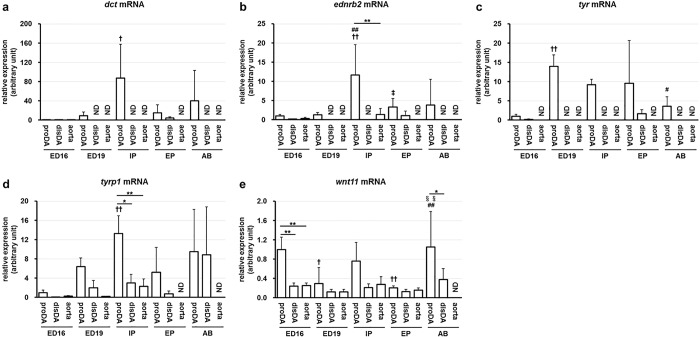
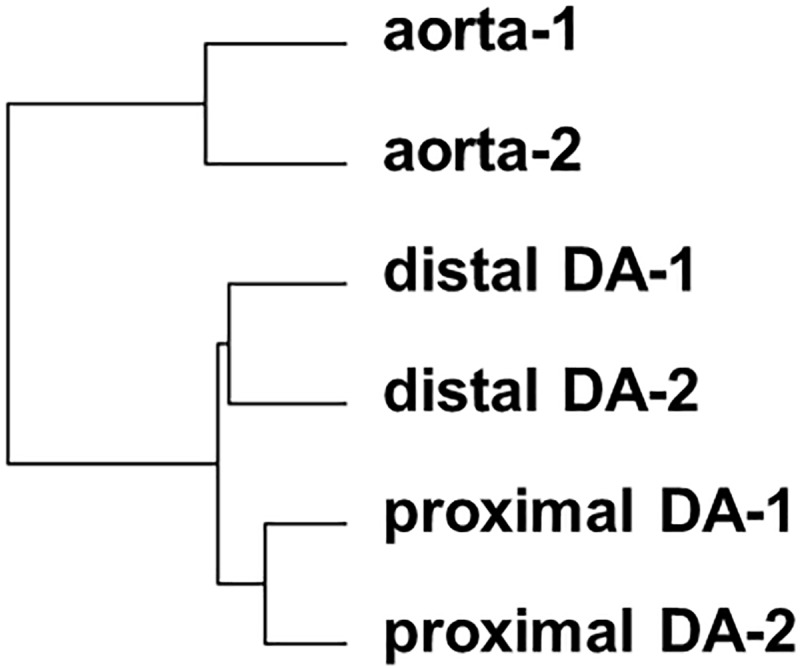
The ductus arteriosus, an essential embryonic blood vessel between the pulmonary artery and the descending aorta, constricts after birth or hatching and eventually closes to terminate embryonic circulation. Chicken embryos have two long ductus arteriosi, which anatomically differ from mammal ductus arteriosus. Each long ductus arteriosus is divided into two parts: the pulmonary artery-sided and descending aorta-sided ductus arteriosi. Although the pulmonary artery-sided and descending aorta-sided ductus arteriosi have distinct functional characteristics, such as oxygen responsiveness, the difference in their transcriptional profiles has not been investigated. We performed a DNA microarray analysis (GSE 120116 at NCBI GEO) with pooled tissues from the chicken pulmonary artery-sided ductus arteriosus, descending aorta-sided ductus arteriosus, and aorta at the internal pipping stage. Although several known ductus arteriosus-dominant genes such as tfap2b were highly expressed in the pulmonary artery-sided ductus arteriosus, we newly found genes that were dominantly expressed in the chicken pulmonary artery-sided ductus arteriosus. Interestingly, cluster analysis showed that the expression pattern of the pulmonary artery-sided ductus arteriosus was closer to that of the descending aorta-sided ductus arteriosus than that of the aorta, whereas the morphology of the descending aorta-sided ductus arteriosus was closer to that of the aorta than that of the pulmonary artery-sided ductus arteriosus. Subsequent pathway analysis with DAVID bioinformatics resources revealed that the pulmonary artery-sided ductus arteriosus showed enhanced expression of the genes involved in melanogenesis and tyrosine metabolism compared with the descending aorta-sided ductus arteriosus, suggesting that tyrosinase and the related genes play an important role in the proper differentiation of neural crest-derived cells during vascular remodeling in the ductus arteriosus. In conclusion, the transcription profiles of the chicken ductus arteriosus provide new insights for investigating the mechanism of ductus arteriosus closure.
Conflict of interest statement
The authors have declared that no competing interests exist.
Figures
Similar articles
-
Morphological changes in the chicken ductus arteriosi during closure at hatching.Anat Rec (Hoboken). 2008 Aug;291(8):1007-15. doi: 10.1002/ar.20720. Anat Rec (Hoboken). 2008. PMID: 18521894
-
Cytokeratin expression in human arteries pertinent to intimal thickening formation in the ductus arteriosus.Differentiation. 1997 Aug;61(5):305-11. doi: 10.1046/j.1432-0436.1997.6150305.x. Differentiation. 1997. PMID: 9342841
-
Prenatal diagnosis of left-sided aortic arch, right descending aorta and right-sided ductus arteriosus associated with anomalous origin of left pulmonary artery from ascending aorta.Echocardiography. 2020 Sep;37(9):1506-1508. doi: 10.1111/echo.14821. Epub 2020 Aug 10. Echocardiography. 2020. PMID: 32777111
-
Comparative physiology of the ductus arteriosus among vertebrates.Semin Perinatol. 2018 Jun;42(4):203-211. doi: 10.1053/j.semperi.2018.05.002. Epub 2018 May 10. Semin Perinatol. 2018. PMID: 29937096 Review.
-
Molecular Mechanisms for Regulating Postnatal Ductus Arteriosus Closure.Int J Mol Sci. 2018 Jun 25;19(7):1861. doi: 10.3390/ijms19071861. Int J Mol Sci. 2018. PMID: 29941785 Free PMC article. Review.
Cited by
-
Pulmonary ductal coarctation and left pulmonary artery interruption; pathology and role of neural crest and second heart field during development.PLoS One. 2020 May 15;15(5):e0228478. doi: 10.1371/journal.pone.0228478. eCollection 2020. PLoS One. 2020. PMID: 32413023 Free PMC article.
-
The molecular mechanisms of oxygen-sensing in human ductus arteriosus smooth muscle cells: A comprehensive transcriptome profile reveals a central role for mitochondria.Genomics. 2021 Sep;113(5):3128-3140. doi: 10.1016/j.ygeno.2021.07.006. Epub 2021 Jul 8. Genomics. 2021. PMID: 34245829 Free PMC article.
References
-
- White PT. Experimental studies on the circulatory system of the late chick embryo. The Journal of experimental biology. 1974;61(3):571–92. - PubMed
-
- Harms D. [On the occlusion of the ductus arteriosus of Gallus domesticus]. Zeitschrift fur Zellforschung und mikroskopische Anatomie. 1967;81(3):433–44. - PubMed
Publication types
MeSH terms
LinkOut - more resources
Full Text Sources
Molecular Biology Databases
