. 2019 Mar 21;14(3):e0214156.
doi: 10.1371/journal.pone.0214156. eCollection 2019.

Amelioration of Huntington's disease phenotype in astrocytes derived from iPSC-derived neural progenitor cells of Huntington's disease monkeys

Affiliations

Amelioration of Huntington's disease phenotype in astrocytes derived from iPSC-derived neural progenitor cells of Huntington's disease monkeys

In Ki Cho et al. PLoS One. .

Abstract

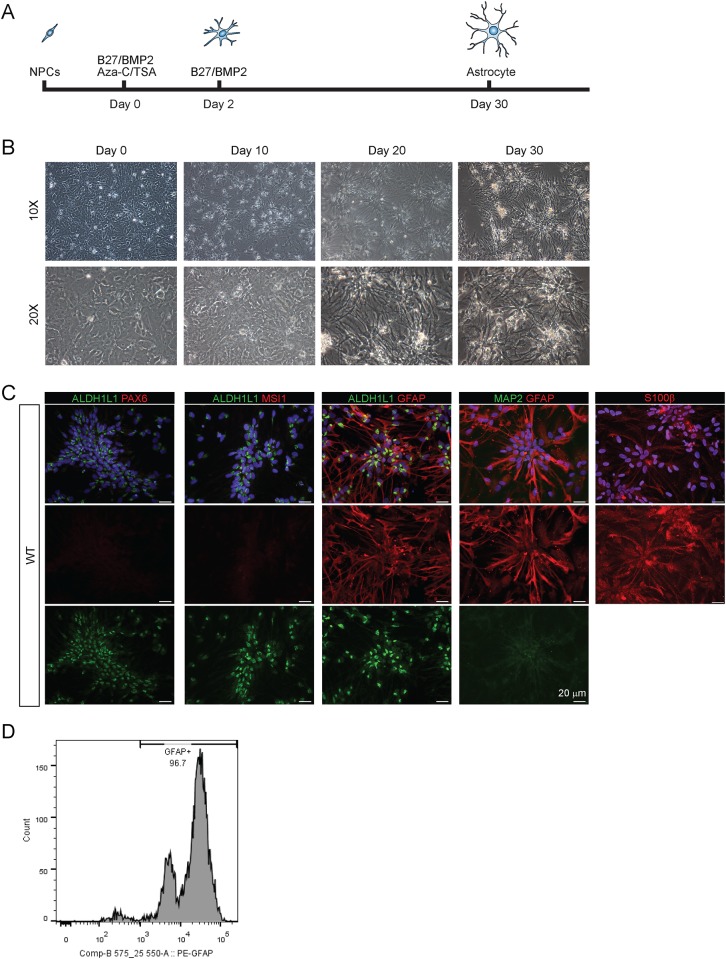
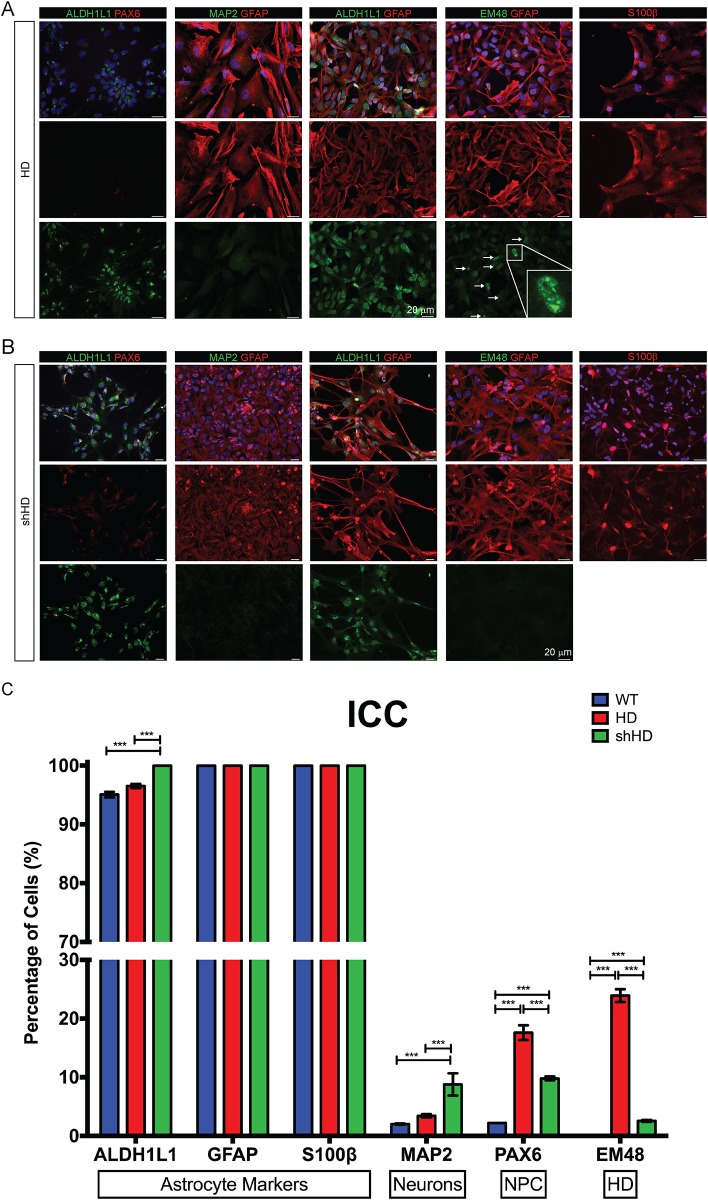
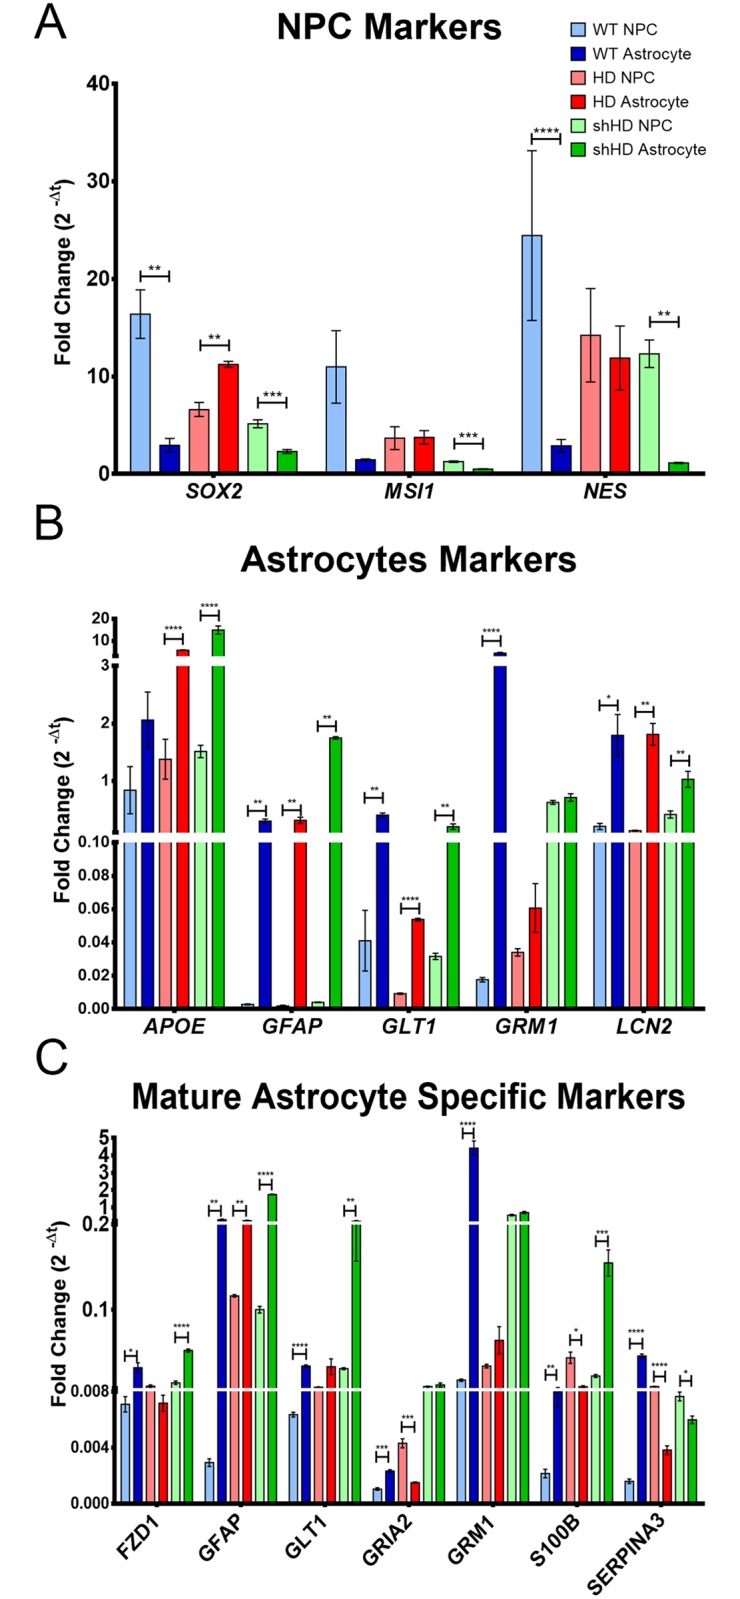
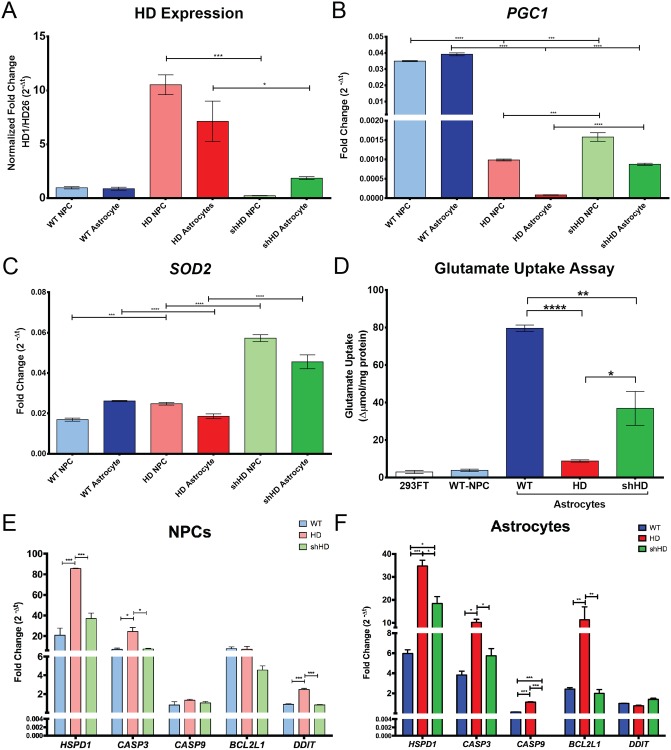
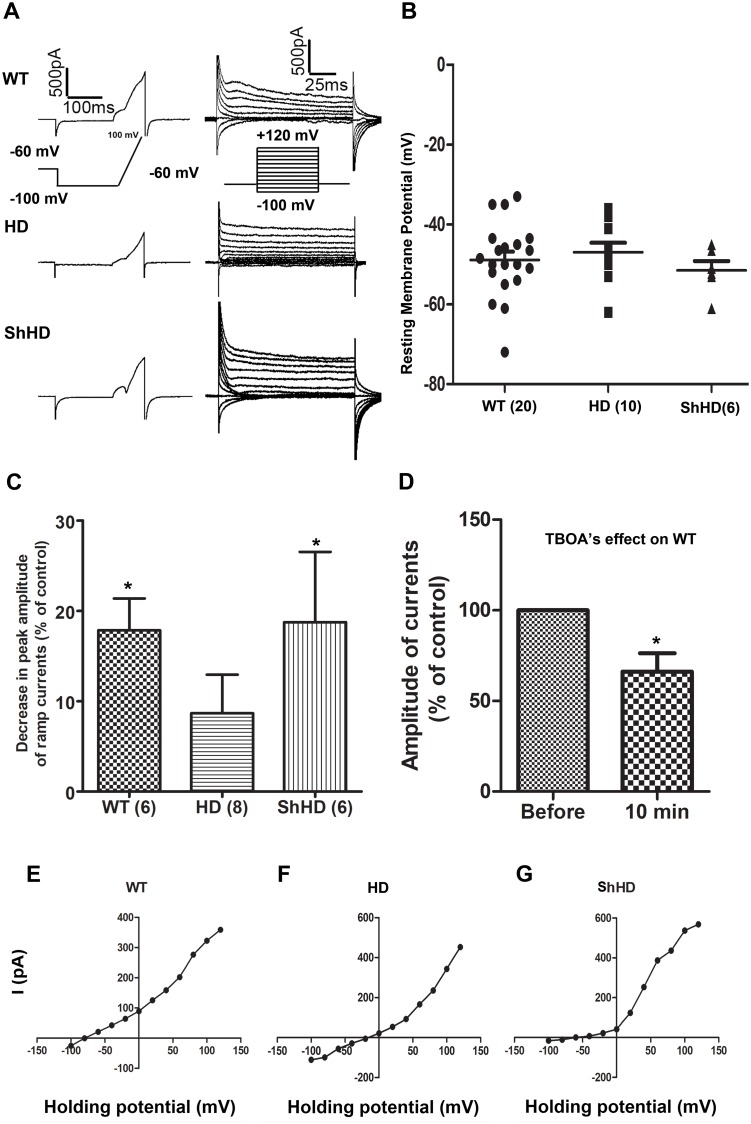
Huntington's disease (HD) is a devastating monogenic, dominant, hereditary, neurodegenerative disease. HD is caused by the expansion of CAG repeats in exon 1 of the huntingtin (HTT) gene, IT15, resulting in an expanded polyglutamine (polyQ) residue in the N-terminus of the HTT protein. HD is characterized by the accumulation of mutant HTT (mHTT) in neural and somatic cells. Progressive brain atrophy occurs initially in the striatum and extends to different brain regions with progressive decline in cognitive, behavioral and motor functions. Astrocytes are the most abundant cell type in the brain and play an essential role in neural development and maintaining homeostasis in the central nervous system (CNS). There is increasing evidence supporting the involvement of astrocytes in the development of neurodegenerative diseases such as Parkinson's disease (PD), Huntington's disease (HD), Alzheimer's disease (AD), and amyotrophic lateral sclerosis (ALS). We have generated neural progenitor cells (NPCs) from induced pluripotent stem cells (iPSCs) of transgenic HD monkeys as a model for studying HD pathogenesis. We have reported that NPCs can be differentiated in vitro into mature neural cells, such as neurons and glial cells, and are an excellent tool to study the pathogenesis of HD. To better understand the role of astrocytes in HD pathogenesis and discover new therapies to treat HD, we have developed an astrocyte differentiation protocol and evaluated the efficacy of RNAi to ameliorate HD phenotypes in astrocytes. The resultant astrocytes expressed canonical astrocyte-specific markers examined by immunostaining and real-time PCR. Flow cytometry (FACS) analysis showed that the majority of the differentiated NPCs (95.7%) were positive for an astrocyte specific marker, glial fibrillary acidic protein (GFAP). Functionalities of astrocytes were evaluated by glutamate uptake assay and electrophysiology. Expression of mHTT in differentiated astrocytes induced cytosolic mHTT aggregates and nuclear inclusions, suppressed the expression of SOD2 and PGC1, reduced ability to uptake glutamate, decreased 4-aminopyridine (4-AP) response, and shifted I/V plot measured by electrophysiology, which are consistent with previous reports on HD astrocytes and patient brain samples. However, expression of small-hairpin RNA against HTT (shHD) ameliorated and reversed aforementioned HD phenotypes in astrocytes. This represents a demonstration of a novel non-human primate (NHP) astrocyte model for studying HD pathogenesis and a platform for discovering novel HD treatments.


Conflict of interest statement

The authors have declared that no competing interests exist.

Figures

Fig 1
Fig 1. Differentiation of NHP NPCs to astrocytes in vitro.
(A) Graphical description of differentiation protocol. NPCs were treated with BMP2, bFGF, Aza-C, and TSA for two days. After initial treatment, Aza-C and TSA were removed, and only BMP2 and bFGF were supplemented in the media. (B) Morphological changes during differentiation process showing development and elongation of processes. (C) Wild-type astrocytes are expressing astrocyte-specific proteins GFAP (red), ALDH1L1 (green) and S100β (red), while no detectable NPC (PAX6 and MSI1) (red) and neuronal (MAP2) (green) specific proteins were expressed. (D) Fluorescence-Activated Cell Sorting showing the population of cells that positive for GFAP.
Fig 2
Fig 2. Differentiation of HD-NPC and shHD-NPC into astrocytes.
(A) Astrocytes differentiated from HD-NPC expressing canonical astrocyte-specific markers, GFAP, ALDH1L1, and S100β. Staining with mEM48 showed nuclear and cytoplasmic aggregates of mHTT. (B) Astrocytes differentiated from shHD-NPC expressing canonical astrocyte-specific markers: GFAP, ALDH1L1, and S100β. Staining with mEM48 showed a lower number of cells that are positive for mEM48. (C) Quantification of ICC results showing all three cell lines expressed high percentage of cells with astrocyte specific markers ALDH1L1, GFAP, and S100β. HD cells showed significantly higher percentage of cells with PAX6-positive cells (17.6% vs. 2.20% WT and 9.8% shHD, P < 0.0001). shHD cells showed significantly higher percentage of cells with MAP2-positive cells (8.77% vs. 2.02% WT and 3.42%, P < 0.0001). In HD, mEM48 positive cell counts of HD and shHD astrocytes showing the significant reduced number of mEM48 positive cells in shHD astrocyte population (P < 0.0001, 23.9% and 2.56% respectively). For quantifications, minimum of 5 images and maximum of 24 images were counted in cellSens V2.1 (Olympus) with cell numbers ranging from 181 to 489 for each marker. A total of 2,167 cells of WT, 1,517 cells of HD, 1,727 cells of shHTT cells were counted.
Fig 3
Fig 3. Gene expression profile of before and after astrocyte differentiation (day 30).
(A) Before and after gene expression of NPC specific markers: SOX2, MSI1, and NES. WT and shHD showed a significant decrease in SOX2 and NES expression. shHD showed a significant decrease in MSI1 expression. (B) Before and after gene expression of astrocyte-specific markers: APOE, GFAP, GLT1, GRM1, and LCN2. All three cell lines showed a significant increase in GFAP, GLT1, and LNC2 expression. HD and shHD showed a significant increase in APOE expression while only WT showed a significant increase in GRM1 expression. (C) Mature astrocyte-specific marker expressions before and after the differentiation. All three cell lines showed significant increase in GFAP expression (WT P = 0.002, HD P = 0.003, shHD P < 0.0001), while only WT and shHD showed significant increase in FZD1 (P = 0.012, P < 0.0001) and S100β (P = 0.006, P 0.001). HD showed significant decrease in GRIA2 (P = 0.001), S100β (P = 0.008), and SERPINA3 (P < 0.0001) expression. shHD showed significant decrease in SERPINA3 (P = 0.016). At least two biological replicates and three technical replicates were analyzed for this study. Statistical significance was determined by ANOVA (asterisks denote following * P ≤ 0.05, ** P ≤ 0.01, *** P ≤ 0.001, and **** P ≤ 0.0001).
Fig 4
Fig 4. Expression of shHD showed a reversal of HD phenotype.
(A) Expression of shHD in HD cells showed a reduction in HTT expression in astrocytes (P < 0.033). (B) Expression of shHD in HD cells induced expression of PGC1 in astrocytes (P < 0.0001). (C) Expression of shHD in HD cells induced the expression of SOD2 in astrocytes (P < 0.0001). (D) Glutamate uptake assay on differentiated astrocytes. Compared to WT both HD and shHD astrocytes showed significantly reduced the change in glutamate concentration in the supernatant (P < 0.0001 and P = 0.0097 respectively). However, shHD showed a significantly higher change in glutamate concentration in the supernatant (P = 0.036). Three biological replicates with three technical replicates were analyzed. (E) Expression of apoptosis associated genes in NPC showed significantly higher expression of HSPD1 (P < 0.0001), CASP3 (P ≤ 0.05), and DDIT (P < 0.0001) in HD NPC compared to both WT and shHD NPCs while no significant differences were found for CASP9 and BCL2L1 expression among all three cell lines. No expression differences between WT NPC and shHD NPC were observed in all markers. (F) Expression of apoptosis associated genes after the differentiation showed HD astrocytes expressed significantly higher levels of HSPD1, CASP3, CASP9 and BCL2L1 compared to both WT and shHD astrocytes. shHD astrocytes showed significantly higher expression of only HSPD1 compared to WT astrocytes (P ≤ 0.05). All RT-qPCR data were analyzed with at least two biological replicates with three technical replicates. Statistical significance was determined by ANOVA and paired multiple t-test (asterisks denote following * P ≤ 0.05, ** P ≤ 0.01, *** P ≤ 0.001, and **** P ≤ 0.0001).
Fig 5
Fig 5. Functional characterization of differentiated astrocytes.
(A) Representative traces of ionic currents evoked by ramp protocol (left) and voltage-step protocol (right) in cultured WT, HD, and shHD astrocytes. The holding potentials for all the cells were -60mV. (B) Plots of resting membrane potential values for the three types of cells recorded before the current membrane activation. There is no statistical significance among three groups. (C) Percentage of ramp current decrease measured at +100 mV by application of 4-AP (500 uM) in the superfusion medium during recordings on all three types of astrocytes. (D) Significant decreases in the amplitude of peak ramp currents were observed in WT astrocytes following 20 min application of TBOA at the concentration of 500 uM (n = 6). (E, F, G) I/V plots show that all three types of astrocytes share the similarity with variably rectifying astrocyte reported in the literature. However, the reversal potential of (F) HD astrocytes was significantly shifted compared with those in both (E) WT and (G) shHD cells. At least four biological replicates were included for each cell line, and n represents each individual reading.

References

    1. Ross CA, Aylward EH, Wild EJ, Langbehn DR, Long JD, et al. (2014) Huntington disease: natural history, biomarkers and prospects for therapeutics. Nat Rev Neurol 10: 204–216. 10.1038/nrneurol.2014.24 - DOI - PubMed
    1. Bates GP, Dorsey R, Gusella JF, Hayden MR, Kay C, et al. (2015) Huntington disease. Nature Reviews Disease Primers: 15005. - PubMed
    1. Papoutsi M, Labuschagne I, Tabrizi SJ, Stout JC (2014) The cognitive burden in Huntington’s disease: pathology, phenotype, and mechanisms of compensation. Mov Disord 29: 673–683. 10.1002/mds.25864 - DOI - PubMed
    1. Gil JM, Rego AC (2008) Mechanisms of neurodegeneration in Huntington’s disease. Eur J Neurosci 27: 2803–2820. 10.1111/j.1460-9568.2008.06310.x - DOI - PubMed
    1. Quarrel O, O’Donovan KL, Bandmann O, Strong M (2012) The Prevalence of Juvenile Huntington’s Disease: A Review of the Literature and Meta-Analysis. PLoS Curr 4: e4f8606b8742ef8603. - PMC - PubMed

Publication types

Substances