

Green olive leaf extract (OLE) provides cytoprotection in renal cells exposed to low doses of cadmium
- PMID: 30897184
- PMCID: PMC6428325
- DOI: 10.1371/journal.pone.0214159
Green olive leaf extract (OLE) provides cytoprotection in renal cells exposed to low doses of cadmium
Abstract
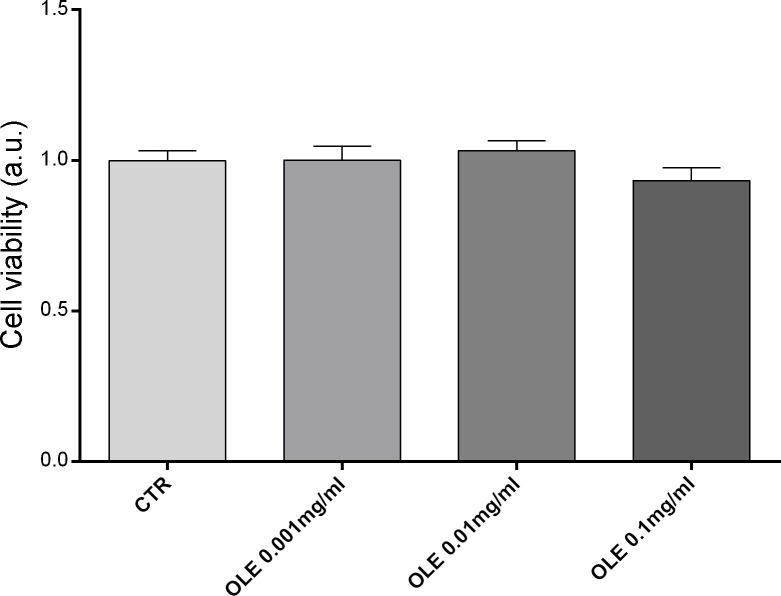
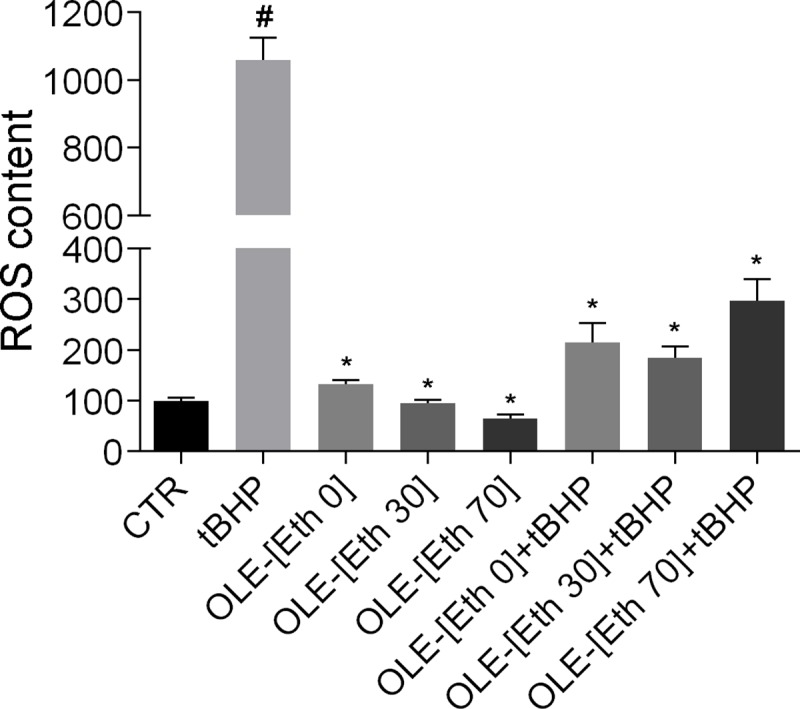
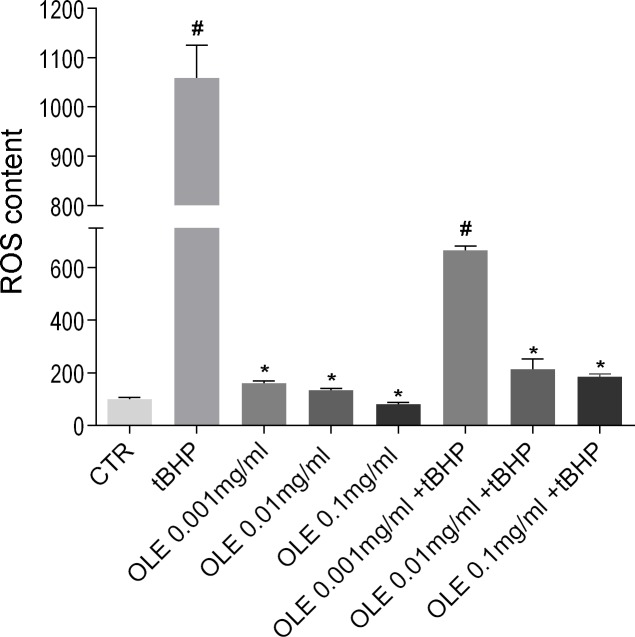
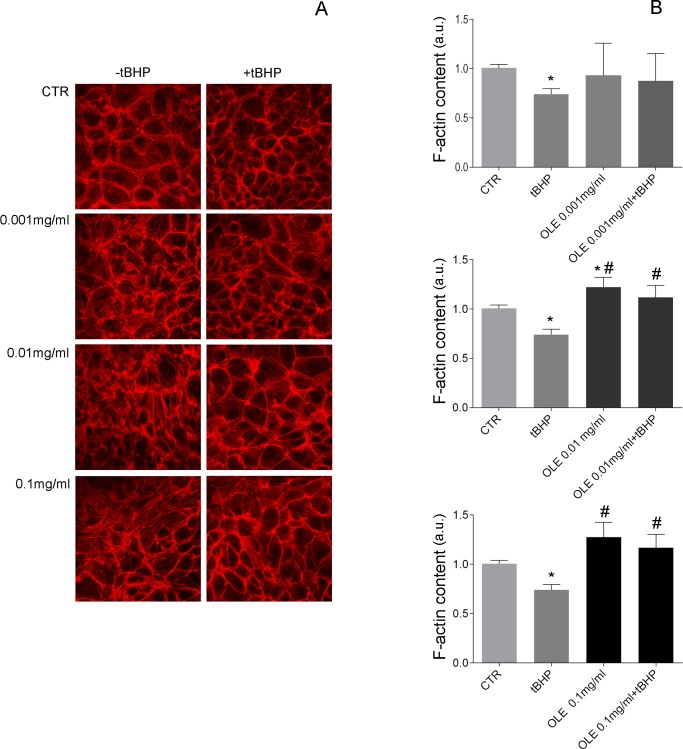
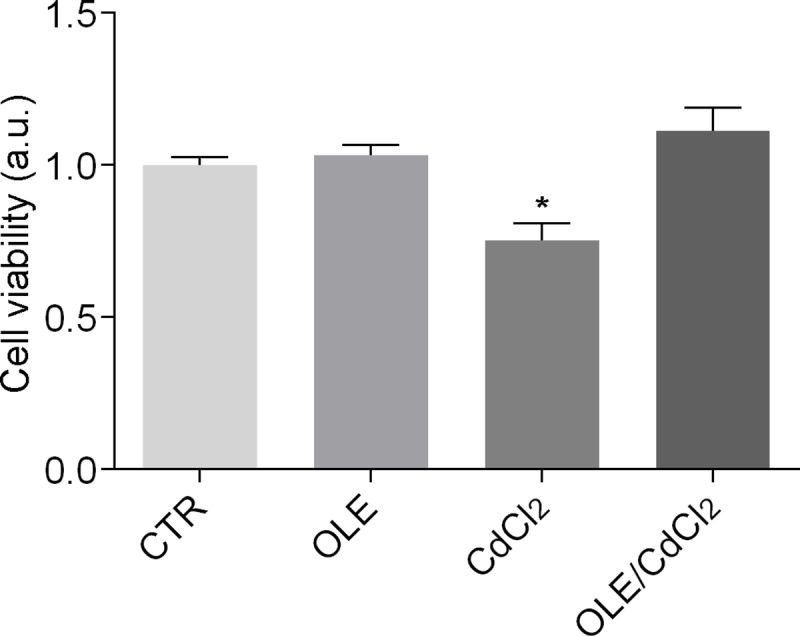
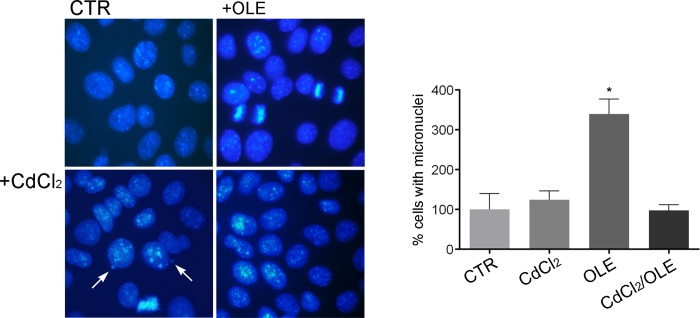
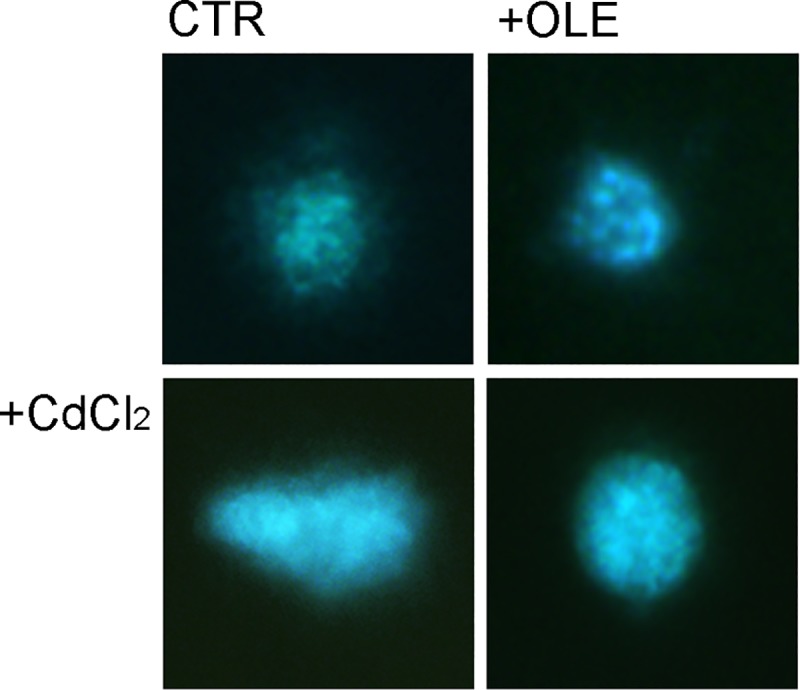
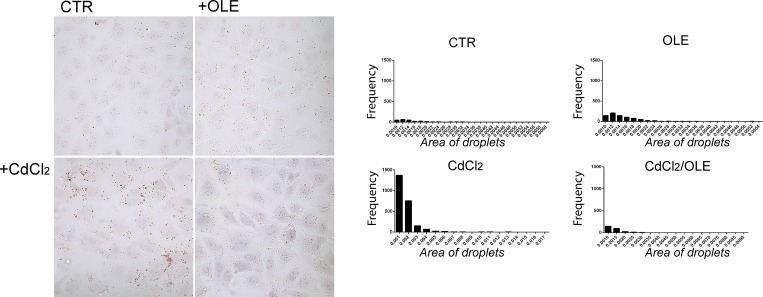
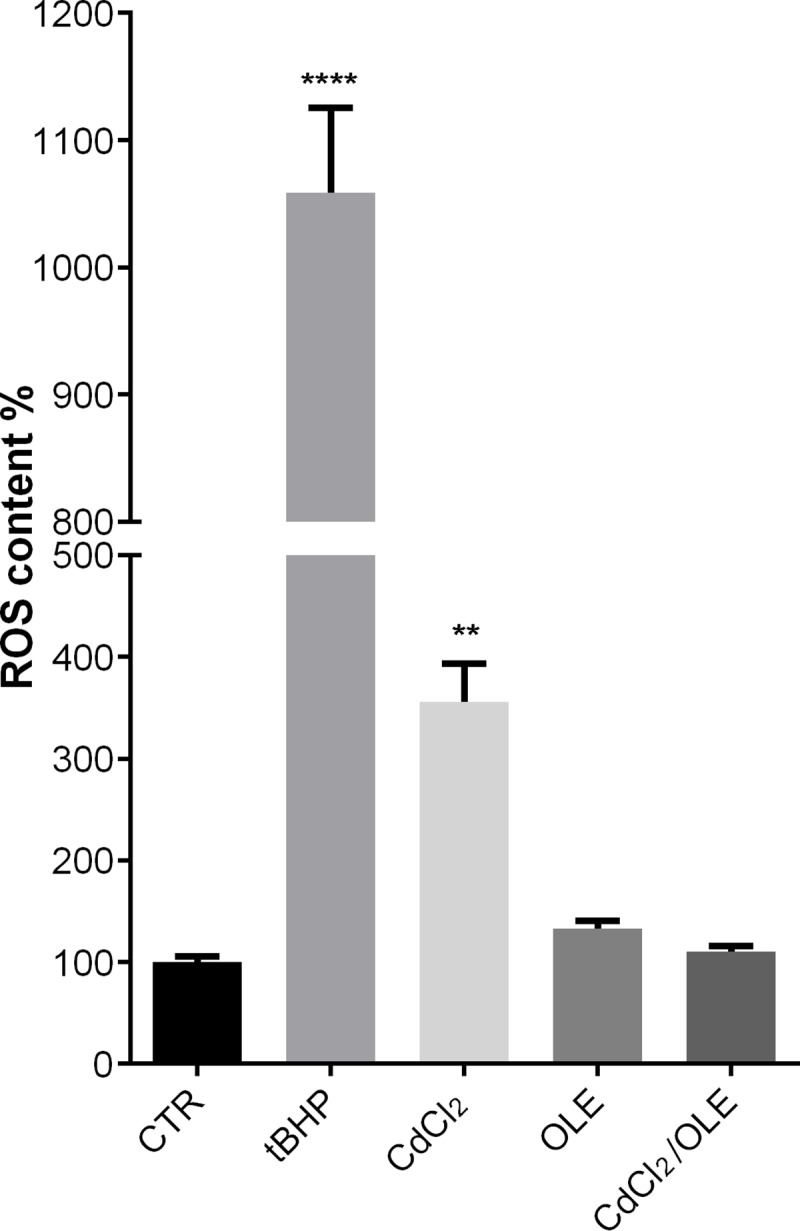
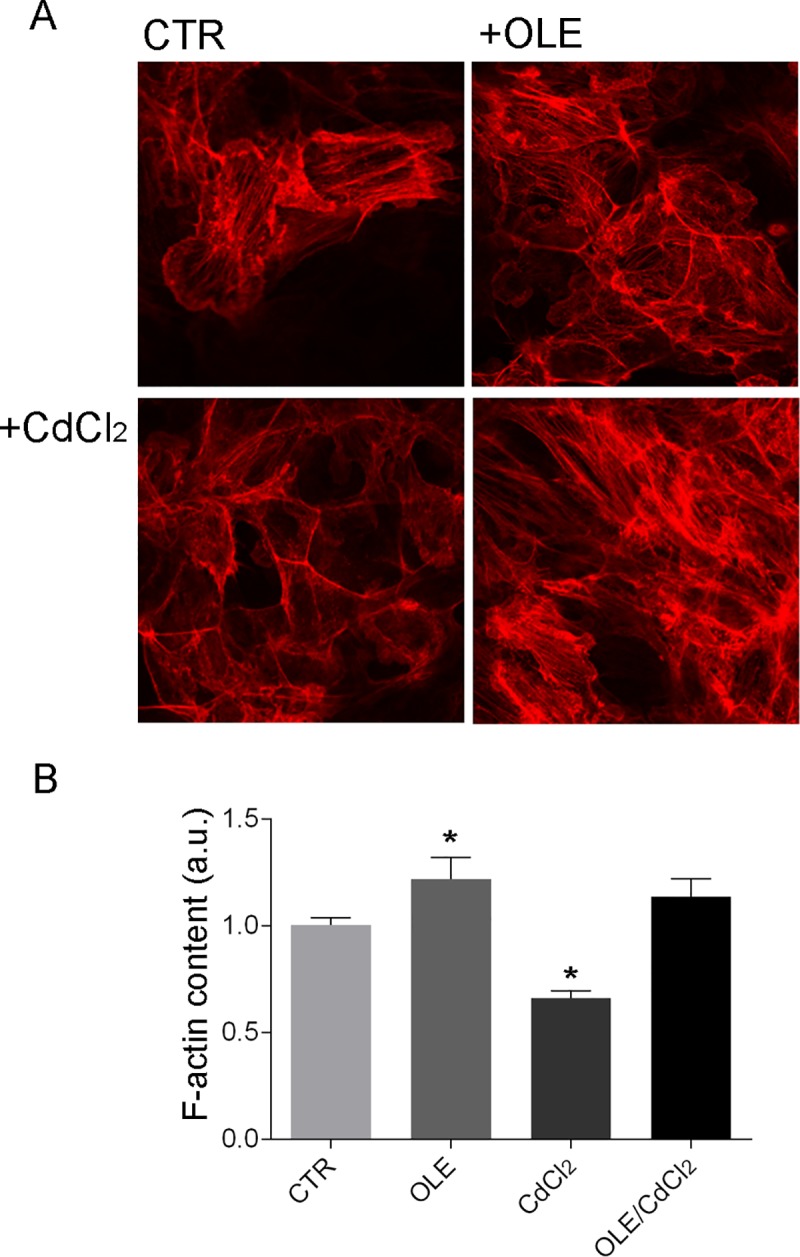
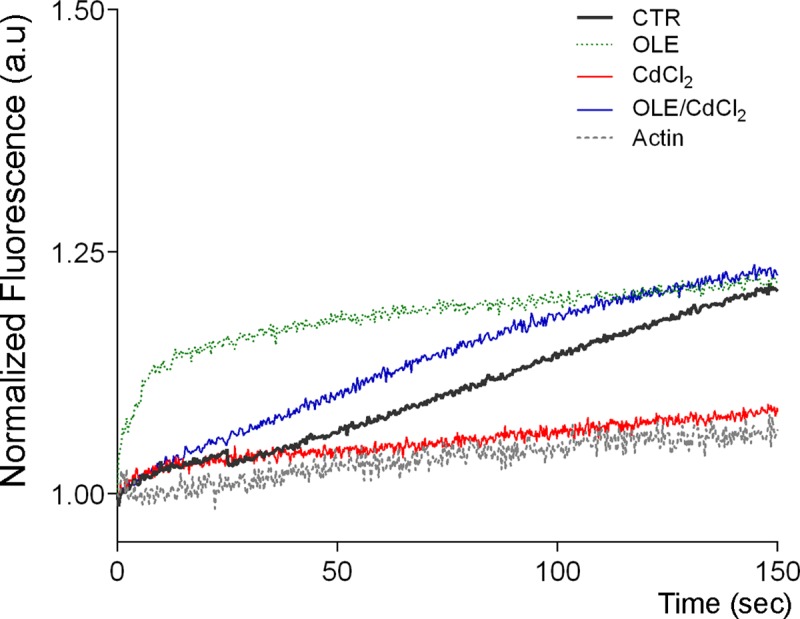
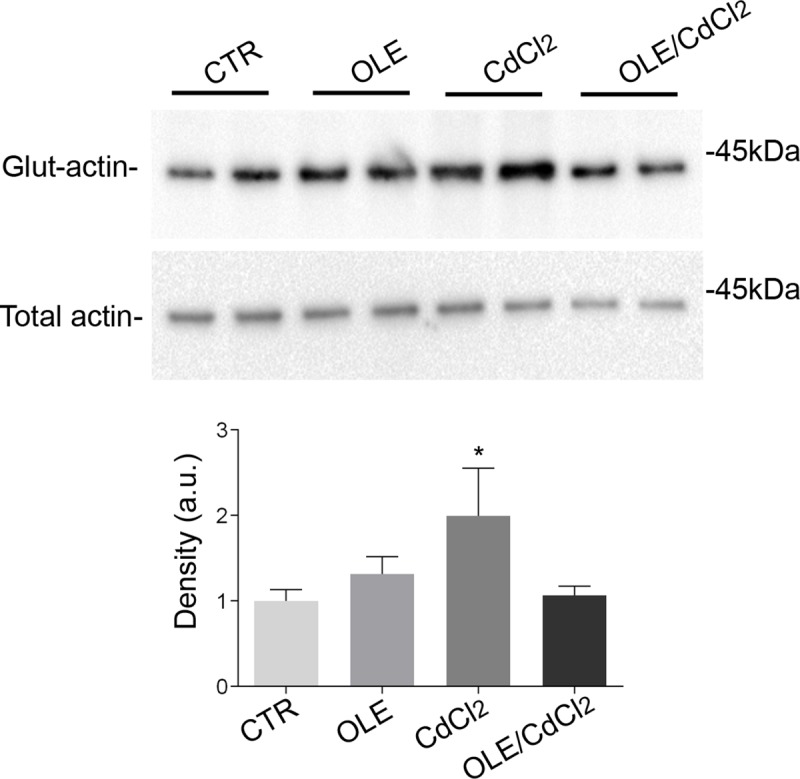
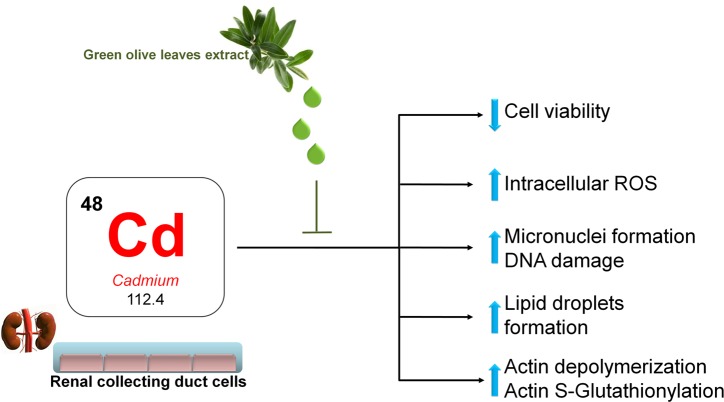
Cadmium (Cd) is a heavy and highly toxic metal that contaminates air, food and water. Cadmium accumulates in several organs altering normal functions. The kidney is the major organ at risk of damage from chronic exposure to cadmium as a contaminant in food and water. This study aims to investigate the beneficial effects of OLE in renal collecting duct MCD4 cells exposed to a low dose cadmium (1 μM). In MCD4 cells cadmium caused an increase in ROS production, as well as generation of lipid droplets and reduced cell viability. Moreover, cadmium exposure led to a remarkable increase in the frequency of micronuclei and DNA double-strand breaks, assessed using the alkaline comet assay. In addition, cadmium dramatically altered cell cytoskeleton architecture and caused S-glutathionylation of actin. Notably, all cadmium-induced cellular deregulations were prevented by co-treatment with OLE, possibly due to its antioxidant action and to the presence of bioactive phytocompounds. Indeed, OLE treatment attenuated Cd-induced actin S-glutathionylation, thereby stabilizing actin filaments. Taken together, these observations provide a novel insight into the biological action of OLE in renal cells and support the notion that OLE may serve as a potential adjuvant against cadmium-induced nephrotoxicity.
Conflict of interest statement
The authors have declared that no competing interests exist.
Figures
Similar articles
-
Olive Leaf Extract (OLE) impaired vasopressin-induced aquaporin-2 trafficking through the activation of the calcium-sensing receptor.Sci Rep. 2021 Feb 25;11(1):4537. doi: 10.1038/s41598-021-83850-5. Sci Rep. 2021. PMID: 33633156 Free PMC article.
-
Waste Autochthonous Tuscan Olive Leaves (Olea europaea var. Olivastra seggianese) as Antioxidant Source for Biomedicine.Int J Mol Sci. 2019 Nov 25;20(23):5918. doi: 10.3390/ijms20235918. Int J Mol Sci. 2019. PMID: 31775339 Free PMC article.
-
Inhibition of 6-hydroxydopamine-induced PC12 cell apoptosis by olive (Olea europaea L.) leaf extract is performed by its main component oleuropein.Rejuvenation Res. 2013 Apr;16(2):134-42. doi: 10.1089/rej.2012.1384. Rejuvenation Res. 2013. PMID: 23394606
-
Evidence to Support the Anti-Cancer Effect of Olive Leaf Extract and Future Directions.Nutrients. 2016 Aug 19;8(8):513. doi: 10.3390/nu8080513. Nutrients. 2016. PMID: 27548217 Free PMC article. Review.
-
Heavy metal poisoning: the effects of cadmium on the kidney.Biometals. 2010 Oct;23(5):783-92. doi: 10.1007/s10534-010-9328-y. Epub 2010 Mar 31. Biometals. 2010. PMID: 20354761 Review.
Cited by
-
Olive Leaf Extract (OLE) impaired vasopressin-induced aquaporin-2 trafficking through the activation of the calcium-sensing receptor.Sci Rep. 2021 Feb 25;11(1):4537. doi: 10.1038/s41598-021-83850-5. Sci Rep. 2021. PMID: 33633156 Free PMC article.
-
Antioxidant Efficacy of Olive By-Product Extracts in Human Colon HCT8 Cells.Foods. 2020 Dec 23;10(1):11. doi: 10.3390/foods10010011. Foods. 2020. PMID: 33374501 Free PMC article.
-
Valorizing the usage of olive leaves, bioactive compounds, biological activities, and food applications: A comprehensive review.Front Nutr. 2022 Nov 8;9:1008349. doi: 10.3389/fnut.2022.1008349. eCollection 2022. Front Nutr. 2022. PMID: 36424930 Free PMC article. Review.
-
Cadmium-Induced Kidney Injury: Oxidative Damage as a Unifying Mechanism.Biomolecules. 2021 Oct 23;11(11):1575. doi: 10.3390/biom11111575. Biomolecules. 2021. PMID: 34827573 Free PMC article. Review.
-
An Olive-Derived Extract 20% Rich in Hydroxytyrosol Prevents β-Amyloid Aggregation and Oxidative Stress, Two Features of Alzheimer Disease, via SKN-1/NRF2 and HSP-16.2 in Caenorhabditis elegans.Antioxidants (Basel). 2022 Mar 25;11(4):629. doi: 10.3390/antiox11040629. Antioxidants (Basel). 2022. PMID: 35453314 Free PMC article.
References
-
- Delgado-Moreno L. NR, Romero E. (2017) Wastes from the olive oil production in sustainable bioremediation systems to prevent pesticides water contamination. Int J Environ Sci Technol 14: 13.
-
- de Bock M, Derraik JG, Brennan CM, Biggs JB, Morgan PE, Hodgkinson SC, et al. (2013) Olive (Olea europaea L.) leaf polyphenols improve insulin sensitivity in middle-aged overweight men: a randomized, placebo-controlled, crossover trial. PLoS One 8: e57622 10.1371/journal.pone.0057622 - DOI - PMC - PubMed
Publication types
MeSH terms
Substances
LinkOut - more resources
Full Text Sources
