. 2019 Mar 21;15(3):e1007311.
doi: 10.1371/journal.ppat.1007311. eCollection 2019 Mar.

Low levels of SIV-specific CD8+ T cells in germinal centers characterizes acute SIV infection

Affiliations

Low levels of SIV-specific CD8+ T cells in germinal centers characterizes acute SIV infection

Shengbin Li et al. PLoS Pathog. .

Abstract

CD8+ T cells play an important role in controlling of HIV and SIV infections. However, these cells are largely excluded from B cell follicles where HIV and SIV producing cells concentrate during chronic infection. It is not known, however, if antigen-specific CD8+ T cells are excluded gradually as pathogenesis progresses from early to chronic phase, or this phenomenon occurs from the beginning infection. In this study we determined that SIV-specific CD8+ T cells were largely excluded from follicles during early infection, we also found that within follicles, they were entirely absent in 60% of the germinal centers (GCs) examined. Furthermore, levels of SIV-specific CD8+ T cells in follicular but not extrafollicular areas significantly correlated inversely with levels of viral RNA+ cells. In addition, subsets of follicular SIV-specific CD8+ T cells were activated and proliferating and expressed the cytolytic protein perforin. These studies suggest that a paucity of SIV-specific CD8+ T cells in follicles and complete absence within GCs during early infection may set the stage for the establishment of persistent chronic infection.


Conflict of interest statement

The authors have declared that no competing interests exist.

Figures

Fig 1
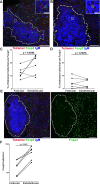
Fig 1. Relatively low levels of SIV-specific CD8 T cells detected in B cell follicles during early SIV infection.
(A) Representative lymph node section shows the distribution of SIV-specific CD8 T cells in different compartments of the lymph node on 21 dpi. This section was stained with Mamu-A1*001/Gag CM9 tetramers to label SIV-specific CD8 T cells (red, and indicted with arrows in the image on the right which shows tetramer staining alone), and IgM antibodies (blue) to define follicles (indicated with dotted line). Confocal images were collected with a 20X objective and each scale bar indicates 100 μm. (B) Frequencies of tetramer+ SIV-specific CD8 T cells in B cell follicle were 57% (95% confidence interval [CI]: 34%, 71%) lower than those in extrafollicular region on 14 dpi (p = 0.0028). (C) Frequencies of tetramer+ SIV-specific CD8 T cells in B cell follicles were 47% (95% CI: 36%, 56%) lower than those in extrafollicular region (p < 0.0001) on 21 dpi. Paired samples are indicated with colored circles and are identified in Table 1. (D) Relationship between frequencies of follicular and extrafollicular tetramer+ SIV-specific CD8 T cells. The frequency of follicular tetramer+ SIV-specific CD8 T cells is significantly correlated with those located in extrafollicular area (r = 0.943, p = 0.0001); a 1-log increase in extrafollicular region is associated with a 0.99-log increase in follicular region (95% CI: 0.68-log, 1.30-log).
Fig 2
Fig 2. Follicular SIV-specific CD8 T cells were largely excluded from germinal centers (GC) during early SIV infection.
(A) Representative images demonstrate the distribution of SIV-specific CD8 T cells within B cell follicles during early SIV infection. Sections were stained with Mamu-A1*001/Gag CM9 tetramers to label SIV-specific CD8 T cells (red, and indicted with arrows in the image on the right which shows tetramer staining alone), IgM antibodies (blue) to define follicles (F), and Ki67 antibodies (green) to label GC. Confocal images were collected with a 20X objective and each scale bar indicates 100 μm. (B) Frequencies of follicular tetramer+ SIV-specific CD8 T cells in GCs were 56% (95% CI: 30%, 73%) lower than those in non-GC follicular area (p = 0.005).
Fig 3
Fig 3. Subsets of tetramer+ SIV-specific CD8 T cells expressed PD-1 during early SIV infection.
(A) Representative lymph node section shows tetramer+ SIV-specific CD8 T cells express PD-1 inside and outside of a B cell follicle. This section was stained with Mamu-A*001:01/Gag CM9 tetramers to label SIV-specific CD8+ T cells (red), PD-1 antibodies (green) to label PD-1 expressing cells and CD20 antibodies (blue) to define follicles. Confocal images were collected with a 20X objective and the scale bar is 100 μm in the image on the left and 10 μm in the enlargement. (B) There was no significant difference between the percentages of PD-1+ cells within the tetramer-binding population located in follicular and extrafollicular regions during early infection. There was no significant difference between percentages of tetramer+ SIV-specific CD8 T cells that were PD-1+ during early and chronic SIV infection in either (C) follicular (p = 0.7972) or (D) extrafollicular areas (p = 0.5185). Paired samples are indicated with colored circles and are identified in Table 1.
Fig 4
Fig 4. Follicular and extrafollicular tetramer+ SIV-specific CD8 T cells in relation to Foxp3+ cells during early SIV infection.
(A) Representative lymph node section stained with Mamu-A*001:01/Gag CM9 tetramers (red), IgM (blue), and Foxp3 (green) showing a tetramer+ cell in contact with a Foxp3+ cells. Confocal images were collected with a 20X objective and the scale bar is 100 μm and 10 μm in low- and high-magnification images respectively. (B) Representative image a showing tetramer+ Foxp3+. (C) Percentages of follicular tetramer+ SIV-specific CD8 T cells that were in direct contact with Foxp3+ cells tend to be lower than extrafollicular tetramer+ SIV-specific CD8 T cells (95% CI: -13.9, 1.57; p = 0.0956). (D) There was no significant difference between percentages of tetramer+ SIV-specific CD8+ T cells inside and outside follicle that were Foxp3+ (95% CI: -2.1, 3.4; p = 0.5676). (E) Representative image showing the distribution of Foxp3+ cells in lymph node. Scale bar is 100 μm. (F) Frequencies of Foxp3+ cells inside follicles were 67% (95% CI: 51%, 77%) lower than outside of follicle (p = 0.0007).
Fig 5
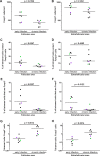
Fig 5. Foxp3+ Tregs relationship to follicular and extrafollicular SIV-specific CD8 T cells in early verses chronic SIV infection.
There was a significantly higher frequency of Foxp3+ cells during early compared to chronic SIV infection in (A) follicular areas (2.26 times higher, 95% CI: 1.18, 4.34; p = 0.0199), but not in (B) extrafollicular areas (1.66 times higher, 95% CI: 0.88, 3.14; p = 0.1091). There was a significantly higher percentage of tetramer+ SIV-specific CD8 T cells in contact with Foxp3+ cells during early compared to chronic SIV infection in (C) follicular areas (p = 0.00047), but not in (D) extrafollicular areas (p = 0.4452). (E) The percentage of follicular tetramer+ SIV-specific CD8 T cells that are Foxp3+ cells during early SIV infection are significantly higher than chronic infection (p = 0.0227). (F) At the same time, the percentage of extrafollicular tetramer+ SIV-specific CD8 T cells that were Foxp3+ cells during early compared to chronic SIV infection was also significantly higher (p = 0.0122). Ratios of tetramer+ SIV-specific CD8 T cells to Foxp3+ cells during early SIV infection were significantly lower than chronic SIV infection in both (G) follicular (91% lower; 95% CI: 70%, 97%; p = 0.0012) and (H) extrafollicular areas (87% lower; 95% CI: 63%, 96%; p = 0.0014). Paired samples are indicated with colored circles and are identified in Table 1.
Fig 6
Fig 6. Ki67 expression levels in follicular and extrafollicular tetramer+ SIV-specific CD8 T cells.
(A)Representative lymph node section stained with Mamu-A*001:01/Gag CM9 tetramers (red), IgM (blue), and Ki67 (green) showing tetramer+ Ki67+ cells in a follicular and extrafollicular region. Scale bars indicate 100 μm and 10 μm in low- and high-magnification images respectively. (B) Percentages of tetramer+ SIV-specific CD8 T cells that expressed Ki67 in follicular areas were 14.6 percentage points (95% CI: 8.7, 20.6) lower than extrafollicular areas in lymph nodes during early SIV infection (p = 0.0007). Percentages of tetramer+ SIV-specific CD8 T cells that were Ki67+ during early SIV infection were significantly higher than chronic SIV infection in both (C) follicular (p = 0.0104) and (D) extrafollicular areas (p = 0.0006). Paired samples are indicated with colored circles and are identified in Table 1.
Fig 7
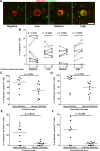
Fig 7. Most tetramer+ SIV-specific CD8 T cells expressed perforin during early SIV infection.
(A) Representative lymph node section stained with Mamu-A*001:01/Gag CM9 tetramers (red) and perforin (green) showing perforin negative, perforin low, perforin medium and perforin high MHC-class I tetramer+ SIV-specific CD8 T cells. Scale bar indicates 10 μm. (B) Percentages of tetramer+ SIV-specific CD8 T cells that expressed perforin in follicular and extrafollicular regions. Among tetramer+ SIV-specific CD8 T cells, the distribution of cells across perforin negative, low, medium and high was not significantly different between follicular and extrafollicular regions. A significantly higher percentage of tetramer+ SIV-specific CD8 T cells during early SIV infection expressed perforin than those during chronic SIV infection in both (C) follicular areas (p = 0.0205), and (D) extrafollicular area (p = 0.0205). Simultaneously, the percentages of tetramer+ SIV-specific CD8 T cells during early SIV infection tended to express a higher level of perforin than those during chronic SIV infection in (E) follicular regions (p = 0.0536), and (F) were statistically significant in extrafollicular regions (p = 0.0364).
Fig 8
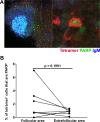
Fig 8. Subsets of tetramer+ SIV-specific CD8 T cells in early chronic SIV infection express the apoptosis marker PARP.
(A) Representative lymph node section stained with Mamu-A*001:01/Gag CM9 tetramers (red), IgM (blue), and PARP (green) showing tetramer+ PARP+ cells and tetramer+ cells in contact with PARP+ cells. Confocal images were collected with a 20X objective and the scale bar is 100 μm and 10 μm in low- and high-magnification images respectively. (B) The percentage of tetramer+ SIV-specific CD8 T cells that were PARP+ was not significantly different between follicular and extrafollicular regions (95% CI: -0.9, 3.6; p = 0.1991).
Fig 9
Fig 9. In vivo relationships between tetramer+ SIV-specific CD8 T cells and SIV RNA+ cells within F and EF compartments of lymph node at 21dpi.
(A) Frequencies of tetramer+ SIV-specific CD8 T cells significantly inversely correlated with SIV RNA+ cells in follicular region (p = 0.0409); a 1-log increase in tetramer+ SIV-specific CD8 T cells is associated with a 1.38-log (95% CI: 0.11, 2.65) decrease in SIV; but not in (B) extrafollicular region (p = 0.7671), a one-log increase is tetramer+ SIV-specific CD8 T cells is associated with a 0.12 log decrease is SIV (95% CI: -1.3, 1.1).

Similar articles

Cited by

References

    1. Folkvord JM, Armon C, Connick E. Lymphoid follicles are sites of heightened human immunodeficiency virus type 1 (HIV-1) replication and reduced antiretroviral effector mechanisms. AIDS Res Hum Retroviruses. 2005;21: 363–70. 10.1089/aid.2005.21.363 - DOI - PubMed
    1. Connick E, Mattila T, Folkvord JM, Schlichtemeier R, Meditz AL, Ray G, et al. CTL fail to accumulate at sites of HIV-1 replication in lymphoid tissue. J Immunol. 2007;178: 6975–6983. 10.4049/jimmunol.178.11.6975 - DOI - PubMed
    1. Connick E, Folkvord JM, Lind KT, Rakasz EG, Miles B, Wilson NA, et al. Compartmentalization of simian immunodeficiency virus replication within secondary lymphoid tissues of rhesus macaques is linked to disease stage and inversely related to localization of virus-specific CTL. J Immunol. American Association of Immunologists; 2014;193: 5613–25. 10.4049/jimmunol.1401161 - DOI - PMC - PubMed
    1. Hufert FT, van Lunzen J, Janossy G, Bertram S, Schmitz J, Haller O, et al. Germinal centre CD4+ T cells are an important site of HIV replication in vivo. AIDS. 1997;11 Available: http://journals.lww.com/aidsonline/Fulltext/1997/07000/Germinal_centre_C... - PubMed
    1. Brenchley JM, Vinton C, Tabb B, Hao XP, Connick E, Paiardini M, et al. Differential infection patterns of CD4+ T cells and lymphoid tissue viral burden distinguish progressive and nonprogressive lentiviral infections. Blood. 2012;120: 4172–4181. 10.1182/blood-2012-06-437608 - DOI - PMC - PubMed

Publication types

MeSH terms