. 2019 Jun;33(6):e22318.
doi: 10.1002/jbt.22318. Epub 2019 Mar 21.

Brain region-specific regulation of histone acetylation and efflux transporters in mice

Affiliations

Brain region-specific regulation of histone acetylation and efflux transporters in mice

Dahea You et al. J Biochem Mol Toxicol. 2019 Jun.

Abstract

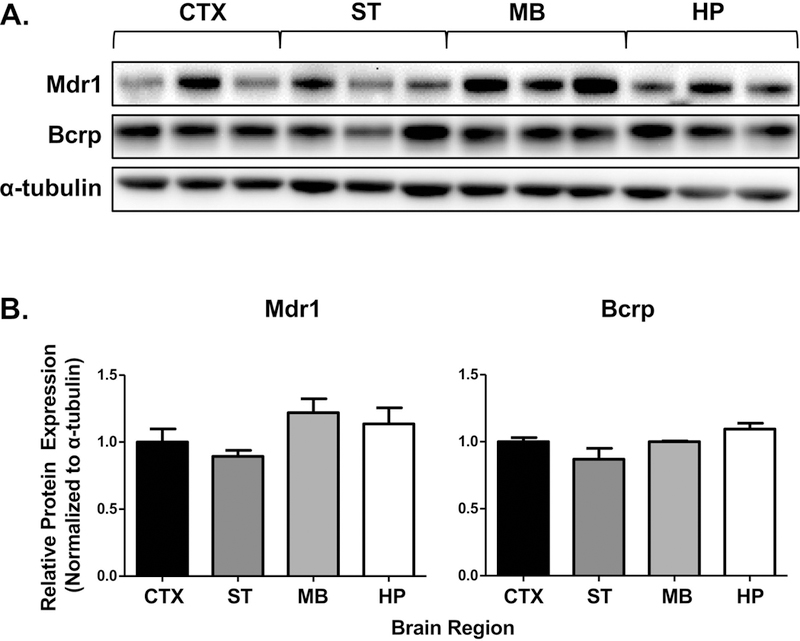
Multidrug resistance protein 1 (MDR1) and breast cancer resistance protein (BCRP) protect the brain by restricting the passage of chemicals across the blood-brain barrier. Prior studies have demonstrated the epigenetic regulation of MDR1 and BCRP in cancer cells treated with histone deacetylase (HDAC) inhibitors that enhance histone acetylation and gene transcription. In the present study, we tested the in vivo effects of two HDAC inhibitors, valproic acid (VPA; 400 mg/kg) and apicidin (5 mg/kg), on Mdr1 and Bcrp transporter expression in brain regions of adult male mice injected intraperitoneally daily for 7 days. VPA increased Mdr1 protein expression in the striatum (70%) and Bcrp protein in the midbrain (30%). Apicidin enhanced striatal Mdr1 protein (30%) and hippocampal Bcrp protein (20%). Transporter induction correlated with increased histone H3 acetylation in discrete brain regions. In conclusion, HDAC inhibitors upregulate transporter proteins in vivo, which may be important in regulating regional xenobiotic disposition within the brain.

Keywords: Abcb1; Abcg2; P-glycoprotein; brain; breast cancer resistance protein (BCRP); histone deacetylase (HDAC) inhibitor; multidrug resistance protein 1 (MDR1); transporter.


Figures

Fig. 1.
Fig. 1.. Baseline transporter protein expression in different brain regions of mice.
Basal levels of transporter proteins in different brain regions of saline-treated mice were analyzed by (A) western blot and (B) semi-quantified by densitometry. Alpha-tubulin (α-tubulin) was used as a loading control. Data are presented as mean ± SEM. CTX: Cortex; ST: Striatum; MB: Midbrain; HP: Hippocampus.
Fig. 2.
Fig. 2.. Efflux transporter protein expression in the cortex of mice treated with HDAC inhibitors.
Protein expression of acetylated H3 histone K9/K14 and efflux transporters in cortex samples of mice treated with vehicle or a HDAC inhibitor (VPA 400mg/kg or apicidin 5mg/kg IP) (n=5) daily for 7 days was analyzed by western blot and semi-quantified by densitometry. Alpha-tubulin (α-tubulin) was used as a loading control. Data are presented as mean ± SEM and analyzed by two-tailed Student’s t-test compared to the respective vehicle control (*) with statistical significance set at p < 0.05. Vehicle 1 (Veh 1): Normal saline; Vehicle 2 (Veh 2): Corn oil.
Fig. 3.
Fig. 3.. Efflux transporter protein expression in the striatum of mice treated with HDAC inhibitors.
Protein expression of acetylated H3 histone K9/K14 and efflux transporters in striatum samples of mice treated with vehicle or a HDAC inhibitors (VPA 400mg/kg or apicidin 5mg/kg IP) (n=4–5) daily for 7 days was analyzed by western blot and semi-quantified by densitometry. Alpha-tubulin (α-tubulin) was used as a loading control. Data are presented as mean ± SEM and analyzed by two-tailed Student’s t-test compared to the respective vehicle control (*) with statistical significance set at p < 0.05. Vehicle 1 (Veh 1): Normal saline; Vehicle 2 (Veh 2): Corn oil.
Fig. 4.
Fig. 4.. Efflux transporter protein expression in the midbrains of mice treated with HDAC inhibitors.
Protein expression of acetylated H3 histone K9/K14 and efflux transporters in midbrain samples of mice treated with vehicle or a HDAC inhibitors (VPA 400mg/kg or apicidin 5mg/kg IP) (n=4–6) daily for 7 days was analyzed by western blot and semi-quantified by densitometry. Alpha-tubulin (α-tubulin) was used as a loading control. Data are presented as mean ± SEM and analyzed by two-tailed Student’s t-test compared to the respective vehicle control (*) with statistical significance set at p < 0.05. Vehicle 1 (Veh 1): Normal saline; Vehicle 2 (Veh 2): Corn oil.
Fig. 5.
Fig. 5.. Efflux transporter protein expression in the hippocampus of mice treated with HDAC inhibitors.
Protein expression of acetylated H3 histone K9/K14 and efflux transporters in hippocampus samples of mice treated with vehicle or a HDAC inhibitors (VPA 400mg/kg or apicidin 5mg/kg IP) (n=5–7) daily for 7 days was analyzed by western blot and semi-quantified by densitometry. Alpha-tubulin (α-tubulin) was used as a loading control. Data are presented as mean ± SEM and analyzed by two-tailed Student’s t-test compared to the respective vehicle control (*) with statistical significance set at p < 0.05. Vehicle 1 (Veh 1): Normal saline; Vehicle 2 (Veh 2): Corn oil.

Similar articles

Cited by

References

    1. Cordon-Cardo C, O’Brien JP, Casals D, Rittman-Grauer L, Biedler JL, Melamed MR and Bertino JR, Proc Natl Acad Sci U S A 1989, 86. - PMC - PubMed
    1. Lee G, Babakhanian K, Ramaswamy M, Prat A, Wosik K and Bendayan R, Pharm Res 2007, 24. - PubMed
    1. Loscher W and Potschka H, NeuroRx 2005, 2. - PMC - PubMed
    1. Loscher W and Potschka H, Prog Neurobiol 2005, 76. - PubMed
    1. Abbott NJ, Patabendige AA, Dolman DE, Yusof SR and Begley DJ, Neurobiol Dis 2010, 37. - PubMed

MeSH terms

LinkOut - more resources