Establishing a Link between Endothelial Cell Metabolism and Vascular Behaviour in a Type 1 Diabetes Mouse Model
- PMID: 30897318
- PMCID: PMC7453785
- DOI: 10.33594/000000036
Establishing a Link between Endothelial Cell Metabolism and Vascular Behaviour in a Type 1 Diabetes Mouse Model
Abstract
Background/aims: Vascular complications contribute significantly to the extensive morbidity and mortality rates observed in people with diabetes. Despite well known that the diabetic kidney and heart exhibit imbalanced angiogenesis, the mechanisms implicated in this angiogenic paradox remain unknown. In this study, we examined the angiogenic and metabolic gene expression profile (GEP) of endothelial cells (ECs) isolated from a mouse model with type1 diabetes mellitus (T1DM).
Methods: ECs were isolated from kidneys and hearts of healthy and streptozocin (STZ)-treated mice. RNA was then extracted for molecular studies. GEP of 84 angiogenic and 84 AMP-activated Protein Kinase (AMPK)-dependent genes were examined by microarrays. Real time PCR confirmed the changes observed in significantly altered genes. Microvessel density (MVD) was analysed by immunohistochemistry, fibrosis was assessed by the Sirius red histological staining and connective tissue growth factor (CTGF) was quantified by ELISA.
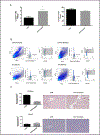
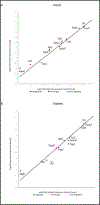
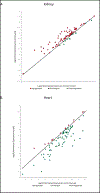
Results: The relative percentage of ECs and MVD were increased in the kidneys of T1DM animals whereas the opposite trend was observed in the hearts of diabetic mice. Accordingly, the majority of AMPK-associated genes were upregulated in kidneys and downregulated in hearts of these animals. Angiogenic GEP revealed significant differences in Tgfβ, Notch signaling and Timp2 in both diabetic organs. These findings were in agreement with the angiogenesis histological assays. Fibrosis was augmented in both organs in diabetic as compared to healthy animals.
Conclusion: Altogether, our findings indicate, for the first time, that T1DM heart and kidney ECs present opposite metabolic cues, which are accompanied by distinct angiogenic patterns. These findings enable the development of innovative organ-specific therapeutic strategies targeting diabetic-associated vascular disorders.
Keywords: Carbohydrate and lipid metabolism; Cell sorting; Endothelium metabolism; Genomics; Micro and macrovascular complications.
© Copyright by the Author(s). Published by Cell Physiol Biochem Press.
Conflict of interest statement
No conflict of interest.
Figures


References
-
- Associaton AD: Diagnosis and Classification of Diabetes Mellitus. Diabetes Care 2005;28:S37–42. - PubMed
-
- Moreira JD, Pernomian L, Gomes MS, Pernomian L, Moreira RP, do Prado AF, da Silva CH, de Oliveira AM: Acute restraint stress increases carotid reactivity in type-I diabetic rats by enhancing Nox4/NADPH oxidase functionality. Eur J Pharmacol 2015;765:503–516. - PubMed
-
- Daneman D: Type 1 diabetes. Lancet 2006;367:847–858. - PubMed
-
- Bjornstad P, Maahs DM, Duca LM, Pyle L, Rewers M, Johnson RJ, Snell-Bergeon JK: Estimated insulin sensitivity predicts incident micro- and macrovascular complications in adults with type 1 diabetes over 6 years: the coronary artery calcification in type 1 diabetes study. J Diabetes Complications 2016;30:586–590. - PMC - PubMed
-
- Costa PZ, Soares R: Neovascularization in diabetes and its complications. Unraveling the angiogenic paradox. Life Sci 2013;92:1037–1045. - PubMed
MeSH terms
Substances
Grants and funding
- NORTE-01-0145FEDER-000012/Programa Operacional Regional Do Norte (NORTE2020)/Portugal
- POCI-010145-FEDER-007440, POCI-01-0145-FEDER-016385/FEDER funds, Programa Operacional Factores de Competitividade (COMPETE)/Portugal
- Process 10010-13-0/Coordenação de Aperfeicoamento de Pessoal de Nível Superior (Sciences without Borders - Full Doctorate Fellowship)/Brazil
- European Structural and Investment Funds/EU
- P20 GM109096/GM/NIGMS NIH HHS/United States
LinkOut - more resources
Full Text Sources
Miscellaneous

