. 2019 Apr 19;8(4):884-901.
doi: 10.1021/acssynbio.9b00017. Epub 2019 Apr 2.

Systematic Evaluation of Genetic and Environmental Factors Affecting Performance of Translational Riboswitches

Affiliations

Systematic Evaluation of Genetic and Environmental Factors Affecting Performance of Translational Riboswitches

R Kent et al. ACS Synth Biol. .

Abstract

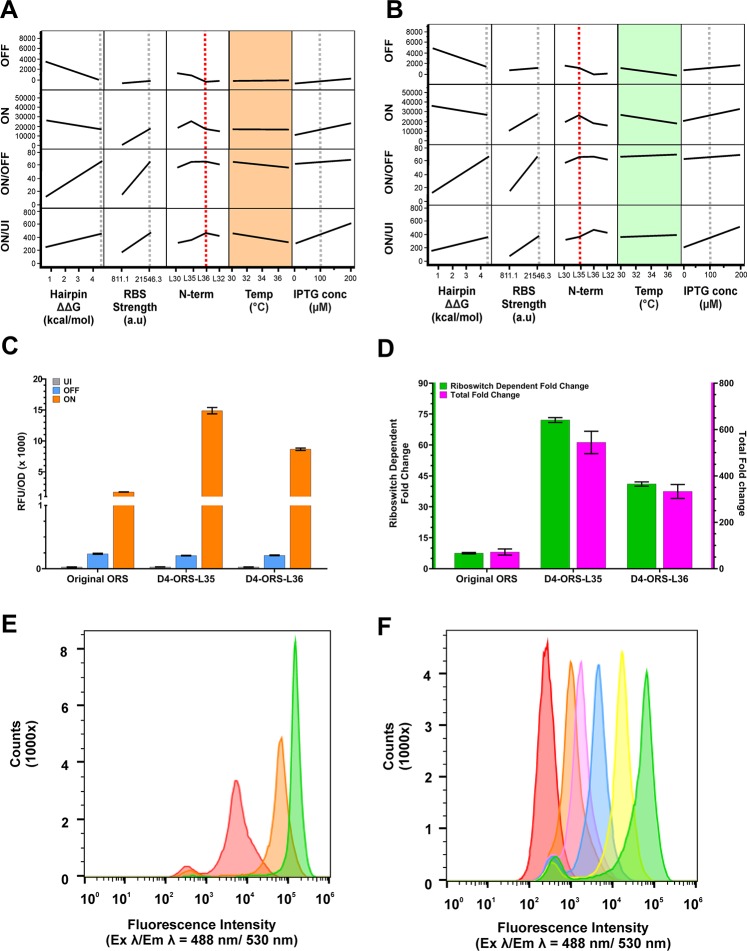
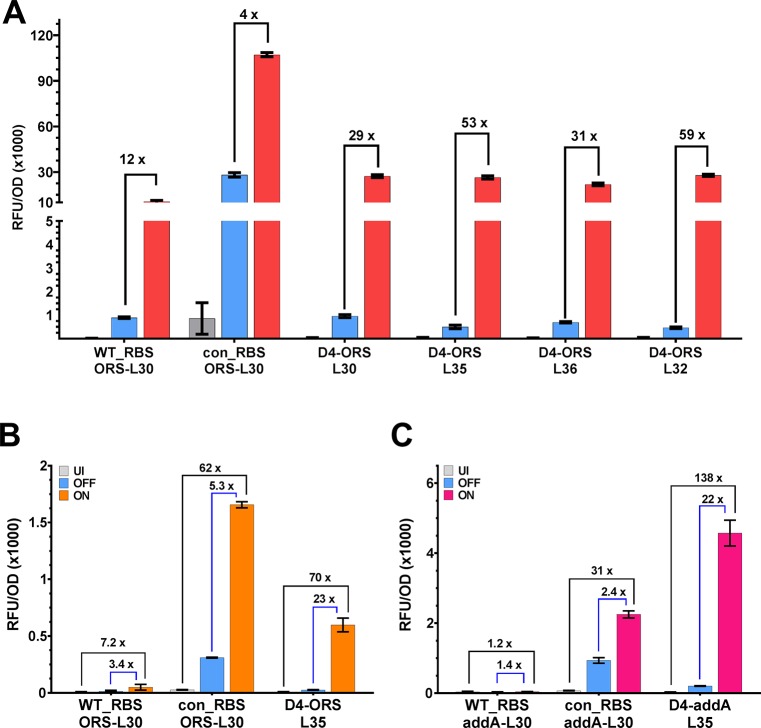
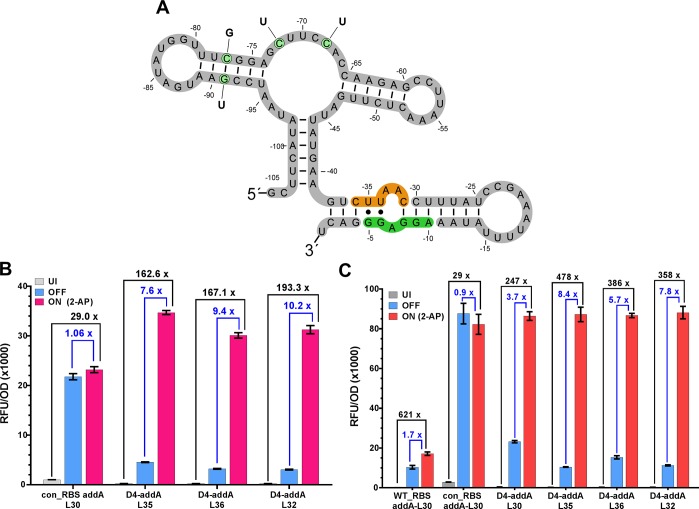
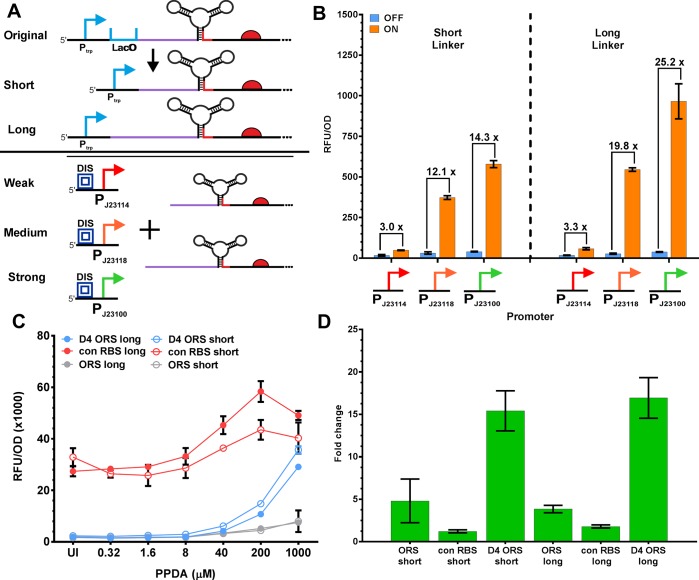
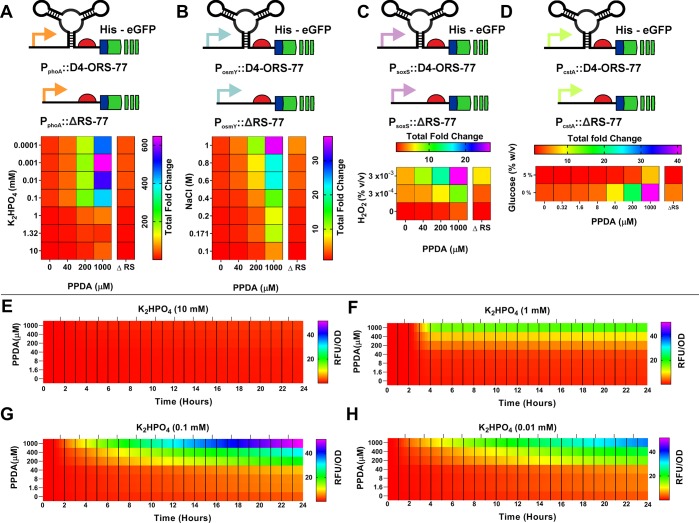
Since their discovery, riboswitches have been attractive tools for the user-controlled regulation of gene expression in bacterial systems. Riboswitches facilitate small molecule mediated fine-tuning of protein expression, making these tools of great use to the synthetic biology community. However, the use of riboswitches is often restricted due to context dependent performance and limited dynamic range. Here, we report the drastic improvement of a previously developed orthogonal riboswitch achieved through in vivo functional selection and optimization of flanking coding and noncoding sequences. The behavior of the derived riboswitches was mapped under a wide array of growth and induction conditions, using a structured Design of Experiments approach. This approach successfully improved the maximal protein expression levels 8.2-fold relative to the original riboswitches, and the dynamic range was improved to afford riboswitch dependent control of 80-fold. The optimized orthogonal riboswitch was then integrated downstream of four endogenous stress promoters, responsive to phosphate starvation, hyperosmotic stress, redox stress, and carbon starvation. These responsive stress promoter-riboswitch devices were demonstrated to allow for tuning of protein expression up to ∼650-fold in response to both environmental and cellular stress responses and riboswitch dependent attenuation. We envisage that these riboswitch stress responsive devices will be useful tools for the construction of advanced genetic circuits, bioprocessing, and protein expression.

Keywords: Design of Experiments; FACS; cellular stress; riboswitch; robustness; synthetic biology.


Conflict of interest statement

The authors declare no competing financial interest.

Figures

Figure 1
Figure 1
Engineering of the PPDA responsive orthogonal riboswitch for enhanced function. (A) Illustrating the mechanism of the orthogonal riboswitch showing small molecule mediated regulation of protein expression. Protein production is activated in response to pyrimido[4,5-d]pyrimidine-2,4-diamine (PPDA), which causes a change in the secondary structure of the eGFP 5′UTR, allowing translation to proceed. (B) An overview of the screening and optimization workflow employed in this study, highlighting the use of in vivo FACS selection and design of experiments to improve riboswitch function. This functional enhancement enabled development of four stress responsive riboswitch devices. (C) Schematic overview of a synthetic riboswitch device under regulation of the IPTG inducible Ptac promoter showing transcriptional and translational regulation of an N-terminally His tagged eGFP.
Figure 2
Figure 2
Exchanging the ribosome binding site of the ORS. (A) Overview of expression platform engineering, showing RBS exchange from the native RBS (WT_RBS = AGAGAA, red semi-circle) to the E. coli six nucleotide consensus RBS (con_RBS = AGGAGG, green semi-circle), which was expected to improve protein production. Also shown is the ORS anti-con_RBS control sequence which contains the modified anti-RBS sequence. (B) End point measurement of eGFP production following modification of the RBS in constructs lacking the riboswitch aptamer region (left). We first tested the native addA WT_RBS under transcriptional regulation from the Ptac promoter in the presence (blue) and absence (gray) of IPTG (100 μM). Substitution of the native RBS with a predicted weak/nonfunctional RBS (NF_RBS = TCCTCC) yields greatly reduced protein expression, confirming correct identification of the RBS. Subsequently, the AGAGAA motif was exchanged with the six base consensus sequence (con_RBS = AGGAGG). The right hand side of this graph shows the performance of the ORS with the native and consensus RBS sequences and the ORS_con_RBS with a modified anti-RBS sequence. These constructs were tested in the presence (blue) and absence (gray) of IPTG (100 μM) plus induction of both transcription and translation with IPTG (100 μM) and PPDA (1000 μM) (orange).
Figure 3
Figure 3
Anti-RBS library and FACS screening. (A) Design and construction of the anti-RBS library. (B) An overview of the FACS screening procedure. This method was used to screen variants of the anti-RBS library for riboswitch function. The library was grown under OFF (IPTG 100 μM, blue) and ON (IPTG 100 μM and PPDA 1000 μM, orange) induction conditions at 30 °C prior to sorting. The lowest 5% of the OFF population and the upper 5% of the ON population was sorted based on eGFP fluorescence intensity (green bow). The sorted populations were recovered and induced under the opposite induction condition, and the alternate sorting procedure was applied, giving two final sorting schemes (low > high, high > low). (C) OFF and ON expression levels (left y-axis) and riboswitch dependent fold change (ON/OFF) (right y-axis) from the 20 functional FACS selected riboswitches following 3 h of induction. (D) Plot showing the trade-off between two important performance metrics ON/OFF and total fold change (ON/UI). LH D4 and LH G7 show the best performance in terms of ON/OFF and ON/UI, respectively. All FACS screened constructs contain His-Linker 30. Error bars represent standard deviation. Data points represent the mean of at least biological duplicate measurements.
Figure 4
Figure 4
DoE data. (A) An overview of genetic and environmental factors (hairpin ΔΔG, RBS strength, N-terminal synonymous codon variant, temperature and IPTG concentration) investigated using Design of Experiments. (B) Measured UI, OFF and ON performance of each riboswitch construct when tested under the factor settings dictated by the D-optimal design (Supplementary Table 5). (C) ON/OFF (x-axis) and ON/UI (y-axis) performance of each tested DOE run. Run number 4 shows the highest riboswitch dependent control. (D) End point eGFP expression testing of D4-ORS-L35 when induced with different concentration of IPTG (1–8, 0, 0.32, 1.6, 8, 40, 200, 400, and 1000 μM, respectively) and PPDA (A, 0, 0.32, 1.6, 8, 40, 200, 400, and 1000 μM, respectively) after 24 h of induction at 37 °C. (E) Calculated total fold change (ON/UI) of the two inducer titration analysis. All error bars represent standard deviation, and data points represent the mean of three technical replicates (B) or biological replicates (D and E).
Figure 5
Figure 5
DoE explanatory model showing the effect of the temperature–N-terminal interaction. Standard least squares modeling of the DoE dataset. Model projections showing the effect of hairpin ΔΔG, RBS strength, N-terminal His tag, incubation temperature, and IPTG concentration when using the D4-ORS-L36 (A) and D4-ORS-L35 (B). (A) D4-ORS-L36 ON/OFF and ON/UI show an interaction with incubation temperature, as indicated by the slope of the projections in the orange boxes. (B) D4-ORS-L35 ON/OFF and ON/UI shows very little interaction with incubation temperature, as indicated by the reduced slope of the projections in the green boxes. (C) Direct comparison of UI (grey), OFF (blue), and ON (orange) performance of the original ORS construct prior to RBS-anti-RBS modification and DOE optimization and the optimized D4-ORS-His-L30. (D) Comparison of the ON/OFF (green) and ON/UI (pink) of the original ORS riboswitch, D4-ORS-L35, and D4-ORS-L36. Expression data (C–D) was collected from biological triplicate induction assays carried out at 37 °C after 24 h following induction with 100 μM IPTG in the presence and absence of 1000 μM PPDA. (E) Histogram of eGFP fluorescence intensity from ΔRS_conRBS-L35 analyzed by flow cytometry, showing the population distribution of single-cells when induced with different level of IPTG (red = uninduced, orange = 10 μM IPTG, green = 100 μM IPTG). (F) Flow cytometry analysis of the D4-ORS-L35 device following various induction conditions (Red = uninduced, orange = 100 μM IPTG, magenta = 100 μM IPTG + 8 μM PPDA, blue = 100 μM IPTG + 40 μM PPDA, yellow = 100 μM IPTG + 200 μM PPDA, magenta = 100 μM IPTG + 1000 μM PPDA).
Figure 6
Figure 6
Regulation of plasmid-based mKate2 expression and chromosomally integrated eGFP. (A) Measurement of end point expression (UI = gray, OFF = yellow, ON = red) shows robust riboswitch performance of D4-ORS-L35 and comparison of each N-terminal variant when regulating mKate2 expression. (B) Following genomic integration of the D4-ORS-L35 device into the genome of E. coli DH10 beta Top10 F′, the device showed strong ON expression and high fold-change performance values compared to the original ORS construct (100 μM IPTG and 1000 μM PPDA) (ON/OFF = blue brackets, ON/UI = black brackets). (C) Genome integration of the D4-addA riboswitch show greatly improved ON, ON/OFF (blue brackets), and ON/UI (black brackets) performance compared to the original addA riboswitch (100 μM IPTG and 1000 μM 2-aminopurine). Bars represent mean of three biological triplicates; error bars show standard deviation.
Figure 7
Figure 7
ORS–addA mutation. (A) Predicted structure (RNAfold) of the D4-ORS riboswitch, showing the point mutations responsible for changing ligand specificity (green circles, labeled with mutation) from PPDA to 2-AP, thus restoring the aptamers region of the addA riboswitch. The D4 anti-RBS (orange) and consensus RBS are indicated (green); numbering shown is relative to the start codon. (B) 2-AP mediated activation of the addA leads to an increase in protein expression. Blue bars show the level of protein synthesis when induced with IPTG only, whilst green bars show induction with IPTG and 2-AP. The optimized D4 expression platform shows robust performance when the aptamer region is exchanged with the native addA aptamer. (C) Performance of the D4-addA devices when regulating the gene expression of for mKate2 (UI = gray, OFF = yellow, ON = red). Error bars represent the standard deviation of three biological replicates. Blue brackets indicate ON/OFF values, whilst black brackets represent ON/UI.
Figure 8
Figure 8
Integrating constitutive promoters into riboswitches allows inducible control of gene expression. (A) Modification of the upstream linker sequence between the transcription start site and the basal stem of the ORS. Deletion of the LacO site from Ptac yielded the constitutive Ptrp promoter with a reduced length transcript upstream of the riboswitch (short). An alternative (long) upstream linker was designed in silico to restore the transcript length to that of the original Ptrp construct. The Ptrp was then replaced with three different strength promoters from the Anderson library for further testing. The three Anderson promoter parts (BBa_J23100 (green), BBa_J23114 (red), and BBa_J23118 (orange)) also contained an upstream insulator sequence. (B) End-point measurement of eGFP production from the Anderson promoter regulated devices showing OFF (blue) and ON (orange) performance. The black brackets indicate the level riboswitch dependent control. (C) PPDA titration of gene expression from Ptrp riboswitch constructs. The performance of the original ORS is shown in gray; the con_RBS ORS is shown in red, and the D4-ORS is shown in blue. Filled circles indicated the long linker, whilst empty circles indicate the short linker. (D) Riboswitch dependent control of each of the Ptrp constructs.
Figure 9
Figure 9
Integration of orthogonal, post-transcriptional regulation into endogenous stress response pathways. Induction matrix heat maps showing the observed ON/UI for the PphoA (A), PosmY (B), PsoxS (C), and PcstA (D) D4-ORS-L35 devices following different levels of transcriptional and post-transcriptional induction with PPDA and K2HPO4, NaCl, H2O2, or glucose starvation. ΔRS controls included for comparison. E–H show kinetic microfermentation characterization of eGFP production (RFU/OD) from the PphoA::D4-ORS-L35 devices when grown in EZ-rich media supplemented with varying levels of K2HPO4 (E = 10 mM, F = 1 mM, G = 0.1 mM, H = 0.01 mM) over 24 h. Data represent the mean of three replicates. Raw data and standard deviations can be seen in Supplementary Table 8.

References

    1. Tamsir A.; Tabor J. J.; Voigt C. A. (2011) Robust multicellular computing using genetically encoded NOR gates and chemical ‘wires’. Nature 469, 212–5. 10.1038/nature09565. - DOI - PMC - PubMed
    1. Wang B.; Kitney R. I.; Joly N.; Buck M. (2011) Engineering modular and orthogonal genetic logic gates for robust digital-like synthetic biology. Nat. Commun. 2, 508.10.1038/ncomms1516. - DOI - PMC - PubMed
    1. Wang B.; Buck M. (2012) Customizing cell signaling using engineered genetic logic circuits. Trends Microbiol. 20, 376–384. 10.1016/j.tim.2012.05.001. - DOI - PubMed
    1. Li G.-W.; Burkhardt D.; Gross C.; Weissman J. S. (2014) Quantifying Absolute Protein Synthesis Rates Reveals Principles Underlying Allocation of Cellular Resources. Cell 157, 624–635. 10.1016/j.cell.2014.02.033. - DOI - PMC - PubMed
    1. Gorochowski T. E.; Avcilar-Kucukgoze I.; Bovenberg R. A. L.; Roubos J. A.; Ignatova Z. (2016) A Minimal Model of Ribosome Allocation Dynamics Captures Trade-offs in Expression between Endogenous and Synthetic Genes. ACS Synth. Biol. 5, 710–720. 10.1021/acssynbio.6b00040. - DOI - PubMed

Publication types

MeSH terms