Comparative Study
. 2019 Jul;33(7):7995-8007.
doi: 10.1096/fj.201900017R. Epub 2019 Mar 21.

Lack of galectin-1 exacerbates chronic hepatitis, liver fibrosis, and carcinogenesis in murine hepatocellular carcinoma model

Affiliations
Comparative Study

Lack of galectin-1 exacerbates chronic hepatitis, liver fibrosis, and carcinogenesis in murine hepatocellular carcinoma model

Tamara Potikha et al. FASEB J. 2019 Jul.

Abstract

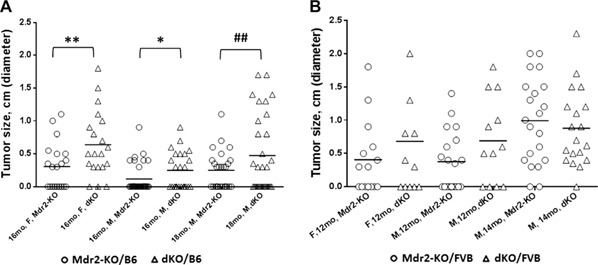
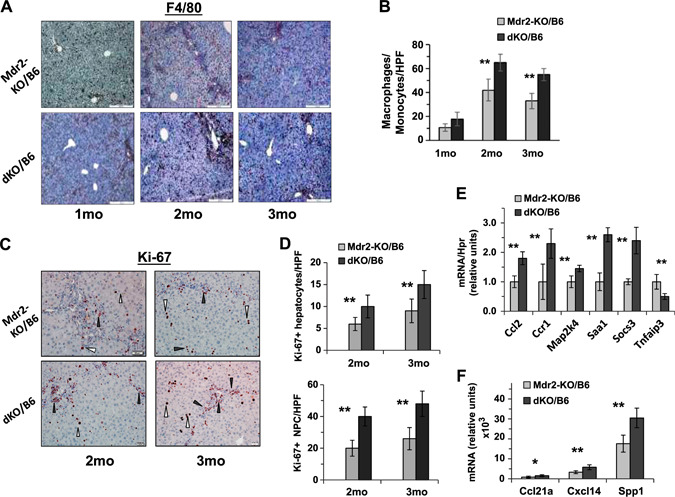
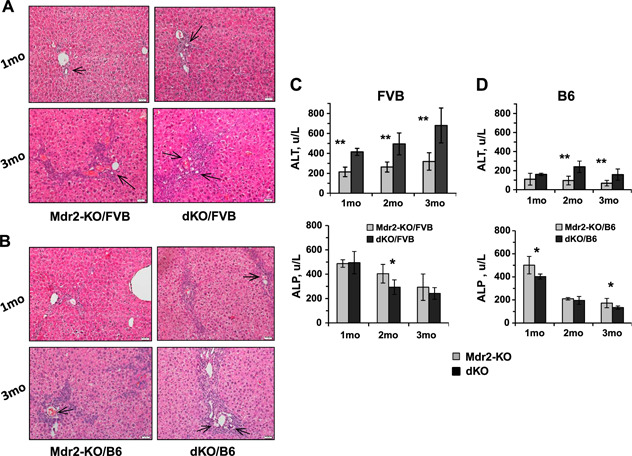
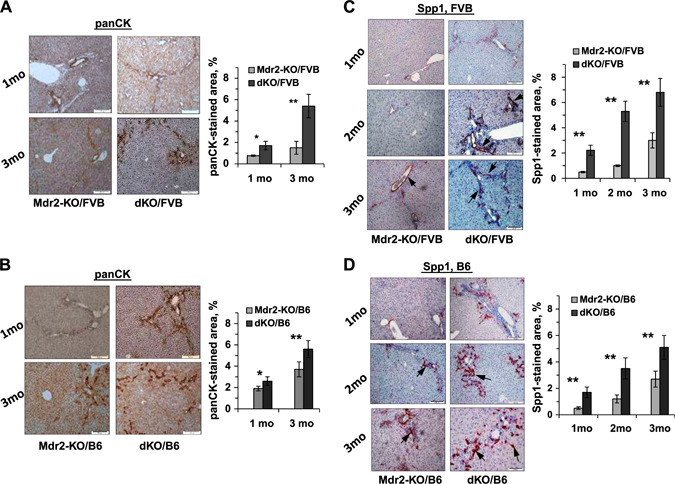
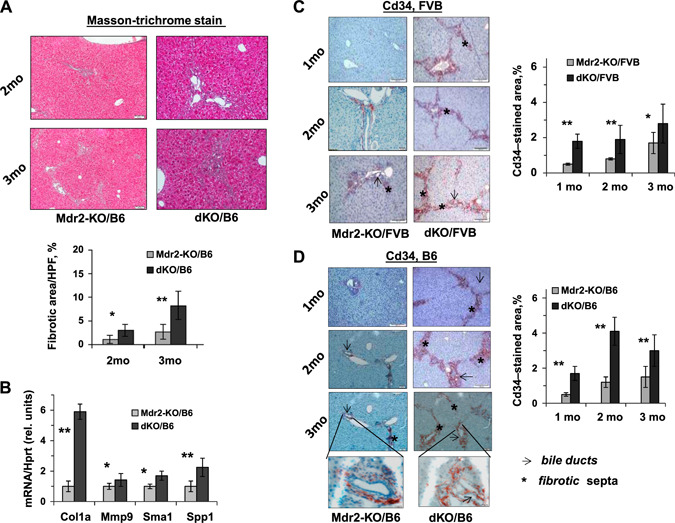
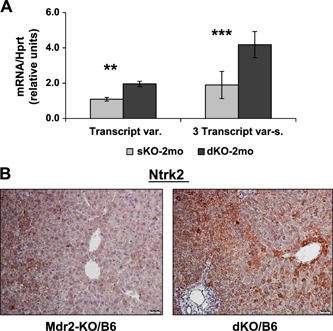
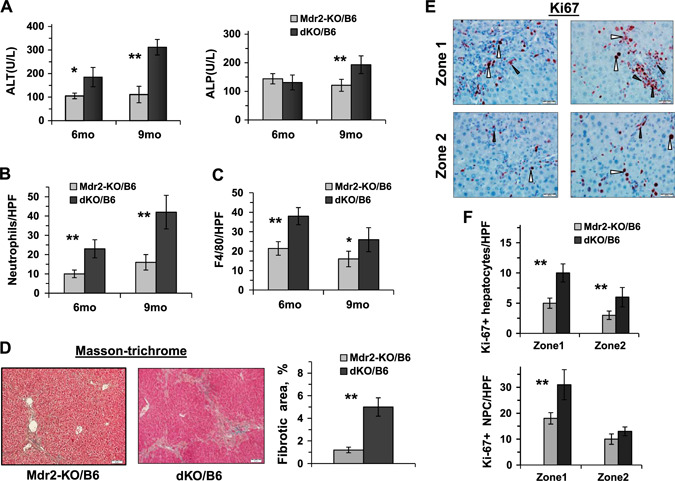
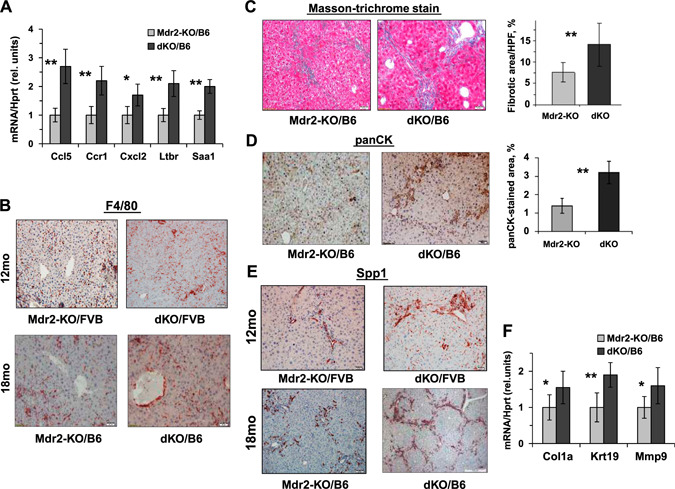
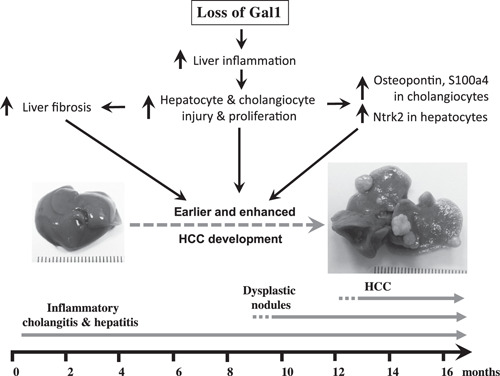
Chronic liver inflammation (CLI) is a risk factor for development of hepatocellular carcinoma (HCC). Galectin-1 (Gal1) is involved in the regulation of inflammation, angiogenesis, and tumorigenesis, exhibiting multiple anti-inflammatory and protumorigenic activities. We aimed to explore its regulatory role in CLI and HCC progression using an established model of CLI-mediated HCC development, Abcb4 [multidrug-resistance 2 (Mdr2)]-knockout (KO) mice, which express high levels of Gal1 in the liver. We generated double-KO (dKO) Gal1-KO/Mdr2-KO mice on C57BL/6 and FVB/N genetic backgrounds and compared HCC development in the generated strains with their parental Mdr2-KO strains. Loss of Gal1 increased liver injury, inflammation, fibrosis, and ductular reaction in dKO mice of both strains starting from an early age. Aged dKO mutants displayed earlier hepatocarcinogenesis and increased tumor size compared with control Mdr2-KO mice. We found that osteopontin, a well-known modulator of HCC development, and oncogenic proteins Ntrk2 (TrkB) and S100A4 were overexpressed in dKO compared with Mdr2-KO livers. Our results demonstrate that in Mdr2-KO mice, a model of CLI-mediated HCC, Gal1-mediated protection from hepatitis, liver fibrosis, and HCC initiation dominates over its known procarcinogenic activities at later stages of HCC development. These findings suggest that anti-Gal1 treatments may not be applicable at all stages of CLI-mediated HCC.-Potikha, T., Pappo, O., Mizrahi, L., Olam, D., Maller, S. M., Rabinovich, G. A., Galun, E., Goldenberg, D. S. Lack of galectin-1 exacerbates chronic hepatitis, liver fibrosis, and carcinogenesis in murine hepatocellular carcinoma model.

Keywords: HCC; Mdr2; Ntrk2; S100a4; Spp1.


Figures

Figure 1
Figure 1
Loss of Gal1 enhances HCC development in Mdr2‐KO/B6 mice. Incidence of tumors with diameters ≥0.3 cm. A) Tumor incidence of the following experimental groups of B6 mice: 16‐mo‐old females (Mdr2‐KO, n = 21 and dKO, n = 20), 16‐mo‐old males (Mdr2‐KO, n = 32 and dKO, n = 24), and 18‐mo‐old males (Mdr2‐KO, n = 26 and dKO, n = 31). B) Tumor incidence of the following experimental groups of FVB mice: 12‐mo‐old females (Mdr2‐KO, n = 15 and dKO, n = 12), 12‐mo‐old males (Mdr2‐KO, n= 19 and dKO, n= 12), and 14‐mo‐old males (Mdr2‐KO, n= 21 and dKO, n= 19). Only nodules with diameters ≥0.3 cm were counted. F, females; M, males. Statistical significance was calculated using Fisher's exact test. *P = 0.05 for 1‐tailed test and for tumors ≥0.3 cm, **P = 0.043 for 2‐tailed test and for tumors ≥0.3 cm, ## P = 0.0076 for 2‐tailed test for large tumors ≥0.8 cm.
Figure 3
Figure 3
Increased inflammation and proliferation of liver cells in dKO/B6 vs. Mdr2‐KO/B6 livers. A) F4/80 immunostaining in the Mdr2‐KO/B6 (top panel) and dKO/B6 (bottom panel) livers. Red‐brown signals distributed in the tissue represent F4/80+ monocytes and macrophages. Original magnification, ×100; scale bars, 50 μm. B) Quantification of F4/80+ cells as presented in A in Mdr2‐KO and dKO livers (mean of 5–6 males per each experimental group; 10 images were collected and analyzed per mouse). C) Ki67 immunostaining in the livers of 2‐ and 3‐mo‐old Mdr2‐KO/B6 and dKO/B6 mice. White triangles point to hepatocytes and black triangles to nonparenchymal (NPC) cells. Original magnification, ×200; scale bars, 20 μm. D) Quantification of Ki67‐positive hepatocytes (upper graphs) and Ki67‐positive nonparenchymal cells (bottom graphs) as presented in C. The counting was performed in the liver zone 2 for hepatocytes and zone 1 (periportal region) for NPC in the original magnification, ×400 field; n = 3–5 mice/genotype. Means ± sd. *P < 0.05, **P < 0.01 in dKO vs. Mdr2‐KO mice (Student's t test). E, F) Expression of genes associated with inflammation in the liver of 2‐mo‐old Mdr2‐KO and dKO mice assigned by either quantitative RT‐PCR (E) or by Nanostring assay (F). There were 4–6 mice for each time point. Results are presented as a means ± sd. *P < 0.05, **P < 0.005 (Student's t test).
Figure 2
Figure 2
Increased bile duct proliferation, ductular reactions, and hepatocyte injury in the livers of dKO compared with Mdr2‐KO mice at young age. A, B) Hematoxylin and eosin staining of representative liver sections from Mdr2‐KO and dKO mice from FVB (A) and B6 (B) genetic background, 1 (upper panels) or 3 (bottom panels) mo of age. Ductal reactions are shown by arrows. Representative images for animals (n = 6–8) of each particular group are shown. Original magnification, ×200; scale bars, 20 μm. C, D) Liver enzyme activities (units per liter) in the serum of young FVB (C) and B6 (D) males. For each time point, 6–9 mice were used. The results are shown as means ± se. *P < 0.05, **P < 0.005 for dKO vs. Mdr2‐KO.
Figure 5
Figure 5
Increased severity of cholangiopathy in dKO/B6 vs. Mdr2‐KO/B6 livers at young age. A, B) PanCK immunostaining and its quantification by morphometric analysis in the livers of dKO and Mdr2‐KO mice from FVB (A) and B6 (B) genetic backgrounds. PanCK expression is mainly confined to the biliary epithelial cells. C, D) IHC of Spp1 expression and its quantification by morphometric analysis in the livers of dKO and Mdr2‐KO mice from FVB (C) and B6 (D) genetic backgrounds. The Spp1 gene was expressed mainly in the biliary epithelial cells (arrows with closed head). Original magnification, ×100; scale bars, 50 μm.
Figure 4
Figure 4
Increased severity of fibrogenesis in dKO/B6 vs. Mdr2‐KO/B6 livers at young age. A) Masson's trichrome stain and morphometric assessment of Masson's trichrome stained areas in Mdr2‐KO and dKO livers using ImageJ Software. Original magnification, ×100; scale bars, 50 μm; n= 4–5 mice/genotype. The values are means ± sem. *P < 0.05, **P < 0.01 for dKO vs. age‐matched Mdr2‐KO mice. B) Increased hepatic expression of the fibrogenesis‐ and billiary‐related genes in dKO compared with Mdr2‐KO/B6 murine livers at the age of 2 mo (n = 3–5 mice/genotype). Means ± sd. *P < 0.05, **P < 0.01 for dKO vs. Mdr2‐KO mice (Student's t test). C, D) IHC of CD34 and its quantification by morphometric analysis in the Mdr2‐KO and dKO mouse livers from FVB (C) and B6 (D) genetic backgrounds. Multiple CD34+ cells were observed in fibrotic septa (stars) and around bile ducts (arrows) in dKO vs. Mdr2‐KO livers (red‐brown color); n = 4–6 mice/genotype. Counting per ×20 power field. Original magnification: ×100; scale bars, 50 μM; inserts (D), ×600; scale bars, 10 μM.
Figure 6
Figure 6
Increased Ntrk2 expression in the liver of young dKO/B6 vs. Mdr2‐KO/B6 mice. A) Ntrk2 expression in the livers of 2‐mo‐old B6 Mdr2‐KO and dKO mice assessed by quantitative RT‐qPCR; n = 3–5 mice/genotype. Three transcript variants of murine Ntrk2 were detected. Only transcript variant 2 (NM_008745.3) could be distinguished from the other 2 transcripts by quantitative RT‐PCR. Left panel shows expression of the transcript variant 2, whereas right panel shows expression of all 3 transcripts together (NM_001025074.2, NM_008745.3, NM_001282961.1); 4–5 mice/assay were used. Means ± sd. **P < 0.005, ***P < 0.0005 in dKO vs. Mdr2‐KO mice (Student's t test). B) IHC of the Ntrk2 protein in the livers of 2‐mo‐old B6 Mdr2‐KO and dKO mice. Original magnification, ×200; scale bars 20 μm.
Figure 7
Figure 7
Increased liver inflammation and fibrosis in the middle‐aged dKO/B6 vs. Mdr2‐KO/B6 mice. A) ALT and ALP activity in the serum of Mdr2‐KO/B6 and dKO/B6 males 6 and 9 mo of age (5–8 mice for each time point and genotype). Means ± sd. *P < 0.05, **P < 0.01 in dKO vs. Mdr2‐KO mice (Student's t test). B, C) Quantification of Ly6G‐positive (B) and F4/80‐positive (C) leukocytes in the liver of dKO vs. Mdr2‐KO mice. The representative images are shown in Supplemental Fig. S4C and D, respectively. D) Masson's trichrome staining of the liver of 6‐mo‐old B6 dKO and Mdr2‐KO males and its quantification by morphometric analysis. Original magnification, ×100; scale bars, 50 μm. E) Representative immunohistochemical staining of the livers of 6‐mo‐old Mdr2‐KO and dKO B6 males using Ki67‐specific antibody. Hepatocytes are marked by white arrowheads and nonparenchymal cells (NPCs) by black arrowheads. Original magnification, ×400; scale bars, 20 μM. F) Quantification of Ki67‐positive hepatocytes and Ki67‐positive NPC. The counting was performed in liver zones 1 (periportal region) and 2 (middle zone) for all tested liver sections; n = 3–5 mice/genotype. Means ± sd. *P < 0.05, **P < 0.01 in dKO vs. Mdr2‐KO mice (Student's t test).
Figure 8
Figure 8
Gal1 loss enhances hepatic inflammation, fibrosis, and cholangiopathy in aged Mdr2‐KO mice. A) quantitative RT‐PCR demonstrates increased expression of inflammation‐related genes in hepatic nontumor tissues of 16‐mo‐old dKO/B6 mice (4–6 mice for each experimental group). Values for dKO mice were normalized to those of age‐matched Mdr2‐KO mice. Means ± sd. *P < 0.05, **P < 0.01 (Student's t test). B) Immunostaining of F4/80+ monocytes and macrophages infiltrating nontumor hepatic tissues of Mdr2‐KO and dKO males from FVB and B6 genetic backgrounds. Original magnification, ×100; scale bars, 50 μM. C–E) Phenotypically, livers of dKO mice were much more stiff, hard, and often not smooth compared with the Mdr2‐KO livers of the both B6 and FVB backgrounds. Masson's trichrome stain and fibrotic area quantification by morphometry in Mdr2‐KO and dKO nontumor liver tissues of 16‐mo‐old B6 mice using ImageJ software (C). IHC for panCK and its quantification confirms high hepatic fibrogenesis in 16‐mo‐old dKO/B6 mice (D). Expression of Opn revealed by immunohistochemical staining (E). Original magnification, ×100; scale bars, 50 μm. F) quantitative RT‐PCR demonstrates increased expression of hepatic genes related to fibrosis processing in nontumor liver tissues of 16‐mo‐old dKO/B6 vs. Mdr2‐KO/B6 mice. Results are presented as fold changes relative to Mdr2‐KO mice. Means ± sd. *P < 0.05, **P < 0.01 in dKO vs. Mdr2‐KO mice; 4–6 mice for each experimental group (Student's t test).
Figure 9
Figure 9
Schematic representation of the consequences of Gal1 loss in the course of CLI in Mdr2‐KO mice. Loss of Gal1 exacerbates CLI, fibrosis, and liver injury starting from the early animal age. This, in turn, induces overexpression of proteins Ntrk2 (in hepatocytes at early age), S100A4 (in cholangiocytes at the middle age), and Opn (in cholangiocytes at all ages tested). Altogether, these activities culminate in earlier and enhanced tumorigenesis.

Similar articles

Cited by

References

    1. Balkwill, F. R. , and Mantovani, A. (2012) Cancer-related inflammation: common themes and therapeutic opportunities. Semin. Cancer Biol. 22, 33–40 - PubMed
    1. Mauad, T. H. , van Nieuwkerk, C. M. , Dingemans, K. P. , Smit, J. J. , Schinkel, A. H. , Notenboom, R. G. , van den Bergh Weerman, M. A. , Verkruisen, R. P. , Groen, A. K. , Oude Elferink, R. P. J. , van der Valk, M. A. , Borst, P. , and Offerhaus, G. J. A. (1994) Mice with homozygous disruption of the mdr2 P-glycoprotein gene. A novel animal model for studies of nonsuppurative inflammatory cholangitis and hepatocarcinogenesis. Am. J. Pathol. 145, 1237–1245 - PMC - PubMed
    1. Katzenellenbogen, M. , Pappo, O. , Barash, H. , Klopstock, N. , Mizrahi, L. , Olam, D. , Jacob-Hirsch, J. , Amariglio, N. , Rechavi, G. , Mitchell, L. A. , Kohen, R. , Domany, E. , Galun, E. , and Goldenberg, D. (2006) Multiple adaptive mechanisms to chronic liver disease revealed at early stages of liver carcinogenesis in the Mdr2-knockout mice. Cancer Res. 66, 4001–4010 - PubMed
    1. Sundblad, V. , Morosi, L. G. , Geffner, J. R. , and Rabinovich, G. A. (2017) Galectin-1: a Jack-of-all-trades in the resolution of acute and chronic inflammation. J. Immunol. 199, 3721–3730 - PubMed
    1. Camby, I. , Le Mercier, M. , Lefranc, F. , and Kiss, R. (2006) Galectin-1: a small protein with major functions. Glycobiobgy 16, 137R–157R - PubMed

Publication types

MeSH terms