

A Novel Insight into Functional Divergence of the MST Gene Family in Rice Based on Comprehensive Expression Patterns
- PMID: 30897847
- PMCID: PMC6470851
- DOI: 10.3390/genes10030239
A Novel Insight into Functional Divergence of the MST Gene Family in Rice Based on Comprehensive Expression Patterns
Abstract
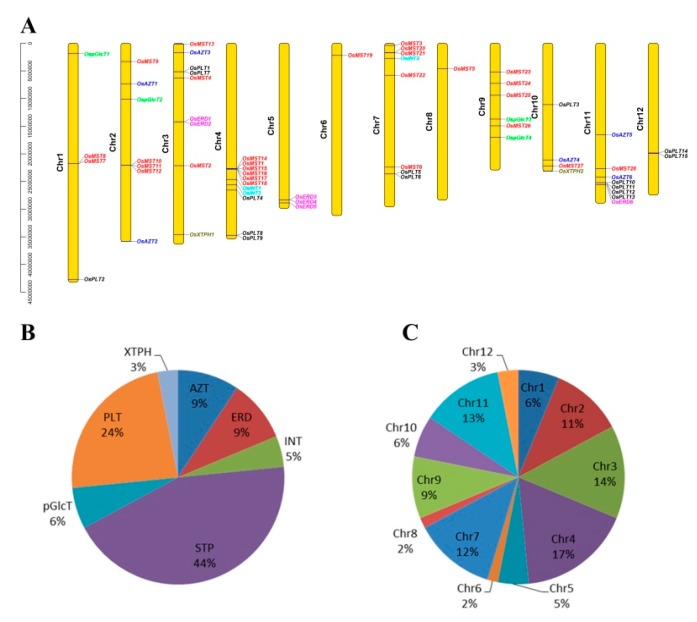
Sugars are critical for plant growth and development as suppliers of carbon and energy, as signal molecules, or as solute molecules for osmotic homeostasis. Monosaccharide transporter (MST) genes are involved in various processes of plant growth and development as well as in response to abiotic stresses. However, the evolution and their roles of MST genes in growth and development and in coping with abiotic stresses in rice are poorly known. Here, we identified 64 MST genes in rice genome, which are classified into seven subfamilies: STP, PLT, AZT, ERD, pGlcT, INT, and XTPH. MST genes are not evenly distributed between chromosomes (Chrs) with a bias to Chr 3, 4, 7, and 11, which could be a result of duplication of fragments harboring MST genes. In total, 12 duplication events were found in the rice MST family, among which, two pairs were derived from fragmental duplications and ten pairs were from tandem duplications. The synonymous and nonsynonymous substitution rates of duplicate gene pairs demonstrated that the MST family was under a strong negative selection during the evolution process. Furthermore, a comprehensive expression analysis conducted in 11 different tissues, three abiotic stresses, five hormone treatments, and three sugar treatments revealed different expression patterns of MST genes and indicated diversified functions of them. Our results suggest that MST genes play important roles not only in various abiotic stresses but also in hormone and sugar responses. The present results will provide a vital insight into the functional divergence of the MST family in the future study.
Keywords: MST family; Oryza sativa; expression analysis; functional divergence; qRT-PCR; rice.
Conflict of interest statement
The authors declare that they have no competing interests for this research.
Figures


Similar articles
-
Genome-wide identification and investigation of monosaccharide transporter gene family based on their evolution and expression analysis under abiotic stress and hormone treatments in maize (Zea mays L.).BMC Plant Biol. 2024 Jun 4;24(1):496. doi: 10.1186/s12870-024-05186-2. BMC Plant Biol. 2024. PMID: 38831278 Free PMC article.
-
Sugar Transporter Proteins (STPs) in Gramineae Crops: Comparative Analysis, Phylogeny, Evolution, and Expression Profiling.Cells. 2019 Jun 8;8(6):560. doi: 10.3390/cells8060560. Cells. 2019. PMID: 31181814 Free PMC article.
-
The monosaccharide transporter gene family in Arabidopsis and rice: a history of duplications, adaptive evolution, and functional divergence.Mol Biol Evol. 2007 Nov;24(11):2412-23. doi: 10.1093/molbev/msm184. Epub 2007 Sep 6. Mol Biol Evol. 2007. PMID: 17827171
-
Update on the Roles of Rice MAPK Cascades.Int J Mol Sci. 2021 Feb 7;22(4):1679. doi: 10.3390/ijms22041679. Int J Mol Sci. 2021. PMID: 33562367 Free PMC article. Review.
-
Genome-wide analysis of the rice J-protein family: identification, genomic organization, and expression profiles under multiple stresses.3 Biotech. 2019 Oct;9(10):358. doi: 10.1007/s13205-019-1880-8. Epub 2019 Sep 6. 3 Biotech. 2019. PMID: 31544012 Free PMC article. Review.
Cited by
-
Research progress and application strategies of sugar transport mechanisms in rice.Front Plant Sci. 2024 Aug 21;15:1454615. doi: 10.3389/fpls.2024.1454615. eCollection 2024. Front Plant Sci. 2024. PMID: 39233915 Free PMC article. Review.
-
Micro-Evolution Analysis Reveals Diverged Patterns of Polyol Transporters in Seven Gramineae Crops.Front Genet. 2020 Jun 19;11:565. doi: 10.3389/fgene.2020.00565. eCollection 2020. Front Genet. 2020. PMID: 32636871 Free PMC article.
-
The regulatory role of CARBON STARVED ANTHER-mediated photoperiod-dependent male fertility in rice.Plant Physiol. 2022 Jun 1;189(2):955-971. doi: 10.1093/plphys/kiac076. Plant Physiol. 2022. PMID: 35274732 Free PMC article.
-
Global Survey, Expressions and Association Analysis of CBLL Genes in Peanut.Front Genet. 2022 Mar 9;13:821163. doi: 10.3389/fgene.2022.821163. eCollection 2022. Front Genet. 2022. PMID: 35356435 Free PMC article.
-
Interpopulation differences of retroduplication variations (RDVs) in rice retrogenes and their phenotypic correlations.Comput Struct Biotechnol J. 2021 Jan 5;19:600-611. doi: 10.1016/j.csbj.2020.12.046. eCollection 2021. Comput Struct Biotechnol J. 2021. PMID: 33510865 Free PMC article.
References
-
- Jung-Il C., Bo B., Dae-Woo L., Nayeon R., Soon-Kwan H., Hyun-Bi K., Joon-Seob E., Sang-Bong C., Man-Ho C., Seong Hee B. Expression analysis and functional characterization of the monosaccharide transporters, OsTMTs, involving vacuolar sugar transport in rice (Oryza sativa) New Phytol. 2010;186:657–668. - PubMed
Publication types
MeSH terms
Substances
LinkOut - more resources
Full Text Sources
Other Literature Sources
Molecular Biology Databases
