

Dynamic Changes in Microvascular Flow Conductivity and Perfusion After Myocardial Infarction Shown by Image-Based Modeling
- PMID: 30897998
- PMCID: PMC6509718
- DOI: 10.1161/JAHA.118.011058
Dynamic Changes in Microvascular Flow Conductivity and Perfusion After Myocardial Infarction Shown by Image-Based Modeling
Abstract
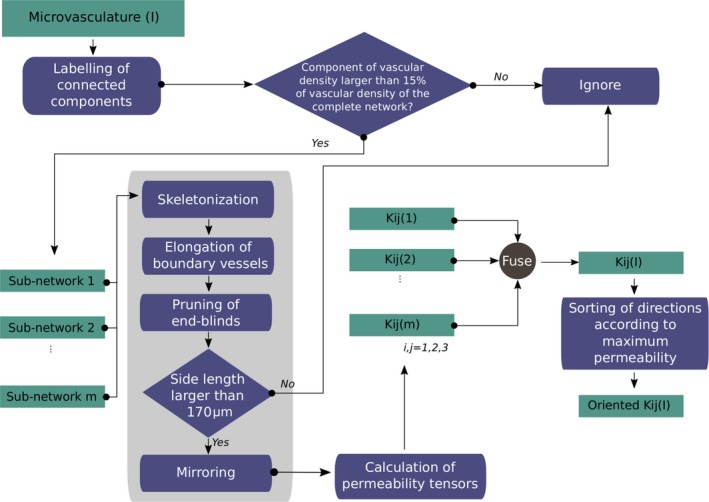
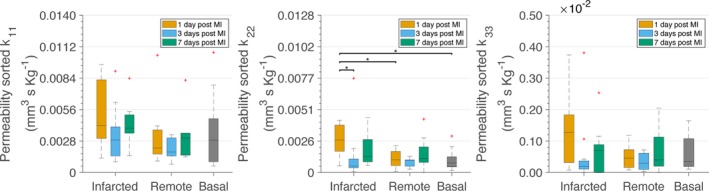
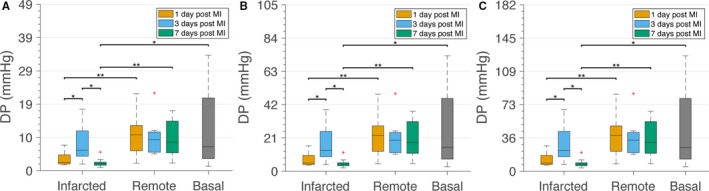
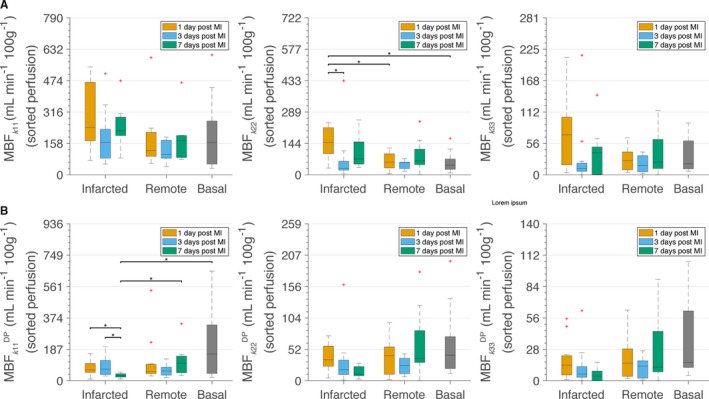
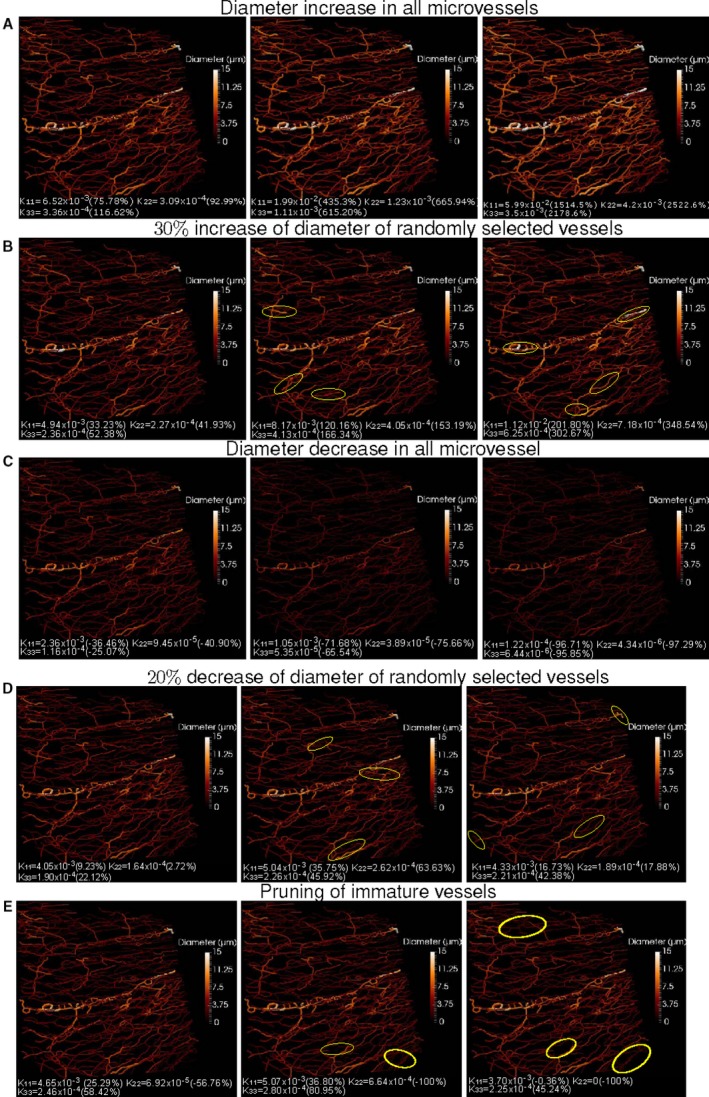
Background Microcirculation is a decisive factor in tissue reperfusion inadequacy following myocardial infarction ( MI ). Nonetheless, experimental assessment of blood flow in microcirculation remains a bottleneck. We sought to model blood flow properties in coronary microcirculation at different time points after MI and to compare them with healthy conditions to obtain insights into alterations in cardiac tissue perfusion. Methods and Results We developed an image-based modeling framework that permitted feeding a continuum flow model with anatomical data previously obtained from the pig coronary microvasculature to calculate physiologically meaningful permeability tensors. The tensors encompassed the microvascular conductivity and were also used to estimate the arteriole-venule drop in pressure and myocardial blood flow. Our results indicate that the tensors increased in a bimodal pattern at infarcted areas on days 1 and 7 after MI while a nonphysiological decrease in arteriole-venule drop in pressure was observed; contrary, the tensors and the arteriole-venule drop in pressure on day 3 after MI , and in remote areas, were closer to values for healthy tissue. Myocardial blood flow calculated using the condition-dependent arteriole-venule drop in pressure decreased in infarcted areas. Last, we simulated specific modes of vascular remodeling, such as vasodilation, vasoconstriction, or pruning, and quantified their distinct impact on microvascular conductivity. Conclusions Our study unravels time- and region-dependent alterations of tissue perfusion related to the structural changes occurring in the coronary microvasculature due to MI . It also paves the way for conducting simulations in new therapeutic interventions in MI and for image-based microvascular modeling by applying continuum flow models in other biomedical scenarios.
Keywords: blood flow; confocal microscopy; coronary microcirculation; mathematical modeling; myocardial infarction.
Figures
Similar articles
-
Coronary microvascular dysfunction after myocardial infarction: increased coronary zero flow pressure both in the infarcted and in the remote myocardium is mainly related to left ventricular filling pressure.Heart. 2007 Oct;93(10):1231-7. doi: 10.1136/hrt.2006.100818. Epub 2007 Mar 29. Heart. 2007. PMID: 17395671 Free PMC article.
-
Assessment of coronary microvascular resistance in the chronic infarcted pig heart.J Cell Mol Med. 2013 Sep;17(9):1128-35. doi: 10.1111/jcmm.12089. Epub 2013 Aug 3. J Cell Mol Med. 2013. PMID: 23910946 Free PMC article.
-
Doppler-derived intracoronary physiology indices predict the occurrence of microvascular injury and microvascular perfusion deficits after angiographically successful primary percutaneous coronary intervention.Circ Cardiovasc Interv. 2015 Mar;8(3):e001786. doi: 10.1161/CIRCINTERVENTIONS.114.001786. Circ Cardiovasc Interv. 2015. PMID: 25717044
-
The temporal recovery of fractional flow reserve, coronary flow reserve and index of microcirculatory resistance following myocardial infarction.Curr Opin Cardiol. 2015 Nov;30(6):663-70. doi: 10.1097/HCO.0000000000000225. Curr Opin Cardiol. 2015. PMID: 26352245 Review.
-
Microvascular integrity after reperfusion therapy.Am Heart J. 1999 Aug;138(2 Pt 2):S76-8. doi: 10.1016/s0002-8703(99)70324-8. Am Heart J. 1999. PMID: 10426863 Review.
Cited by
-
Modelling the impact of clot fragmentation on the microcirculation after thrombectomy.PLoS Comput Biol. 2021 Mar 12;17(3):e1008515. doi: 10.1371/journal.pcbi.1008515. eCollection 2021 Mar. PLoS Comput Biol. 2021. PMID: 33711015 Free PMC article.
-
Modeling Reactive Hyperemia to Better Understand and Assess Microvascular Function: A Review of Techniques.Ann Biomed Eng. 2023 Mar;51(3):479-492. doi: 10.1007/s10439-022-03134-5. Epub 2023 Jan 28. Ann Biomed Eng. 2023. PMID: 36709231 Free PMC article. Review.
-
Approaches to vascular network, blood flow, and metabolite distribution modeling in brain tissue.Biophys Rev. 2023 Aug 18;15(5):1335-1350. doi: 10.1007/s12551-023-01106-0. eCollection 2023 Oct. Biophys Rev. 2023. PMID: 37974995 Free PMC article. Review.
-
Methods of ex vivo analysis of tissue status in vascularized composite allografts.J Transl Med. 2023 Sep 8;21(1):609. doi: 10.1186/s12967-023-04379-x. J Transl Med. 2023. PMID: 37684651 Free PMC article. Review.
-
Quantification of Macrophage-Driven Inflammation During Myocardial Infarction with 18F-LW223, a Novel TSPO Radiotracer with Binding Independent of the rs6971 Human Polymorphism.J Nucl Med. 2021 Apr;62(4):536-544. doi: 10.2967/jnumed.120.243600. Epub 2020 Aug 28. J Nucl Med. 2021. PMID: 32859708 Free PMC article.
References
-
- Secomb TW. Blood flow in the microcirculation. Annu Rev Fluid Mech. 2017;49:443–461.
-
- van der Laan AM, Piek JJ, van Royen N. Targeting angiogenesis to restore the microcirculation after reperfused mi. Nat Rev Cardiol. 2009;6:515–523. - PubMed
-
- Cassot F, Lauwers F, Fouard C, Prohaska S, Lauwers‐Cances V. A novel three‐dimensional computer‐assisted method for a quantitative study of microvascular networks of the human cerebral cortex. Microcirculation. 2006;13:1–18. - PubMed
-
- Kaneko N, Matsuda R, Toda M, Shimamoto K. Three‐dimensional reconstruction of the human capillary network and the intramyocardial micronecrosis. Am J Physiol Heart Circ Physiol. 2011;300:H754–H761. - PubMed
