. 2019 Jul;11(5):870-883.
doi: 10.1080/19420862.2019.1583995. Epub 2019 Mar 21.

Antibody repertoire analysis of mouse immunization protocols using microfluidics and molecular genomics

Affiliations

Antibody repertoire analysis of mouse immunization protocols using microfluidics and molecular genomics

Michael A Asensio et al. MAbs. 2019 Jul.

Abstract

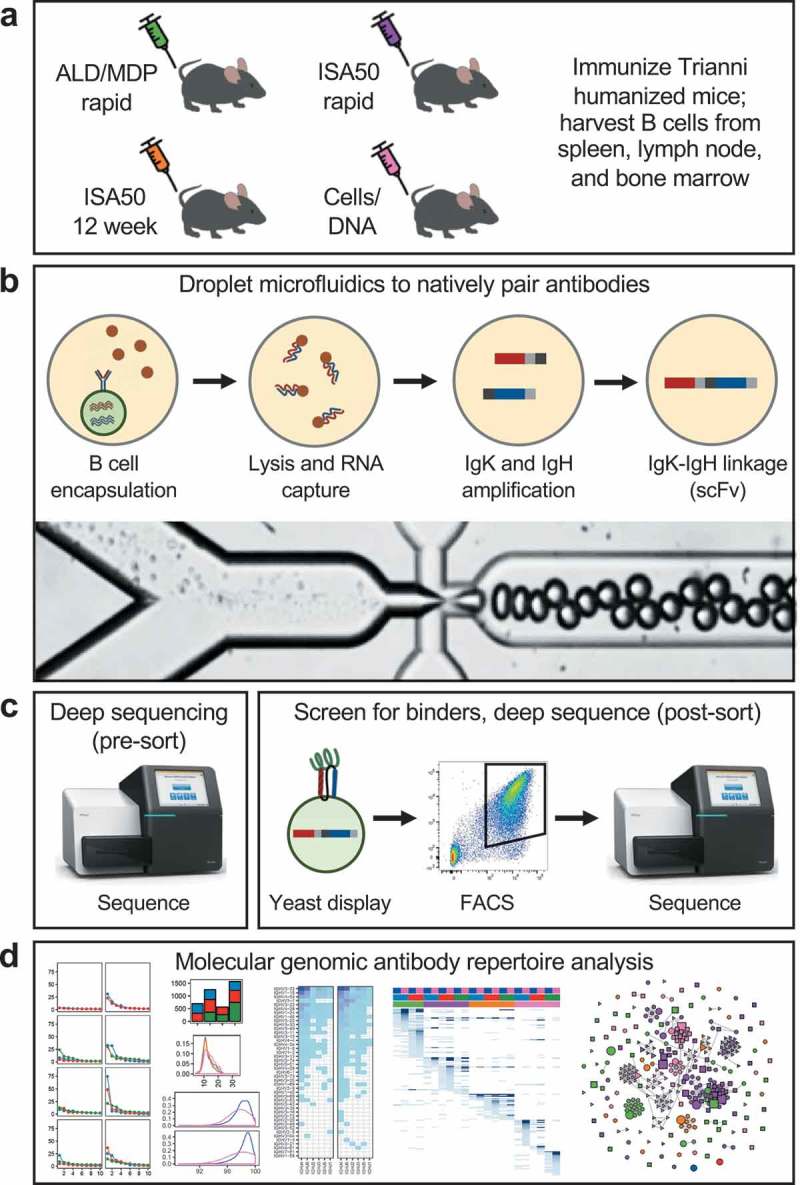
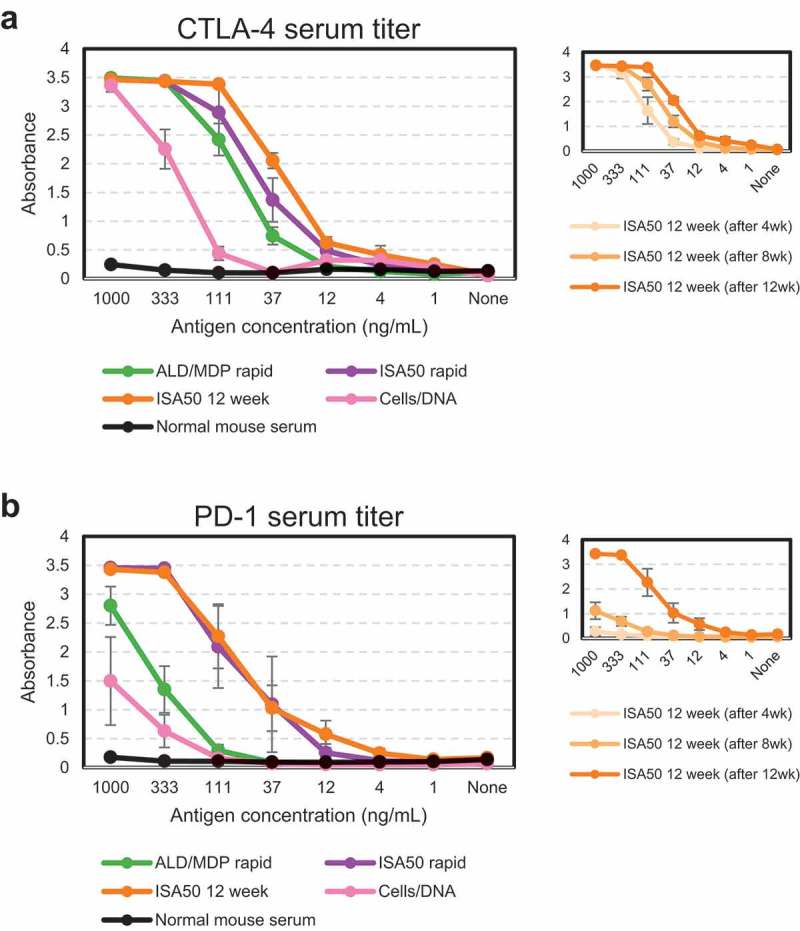
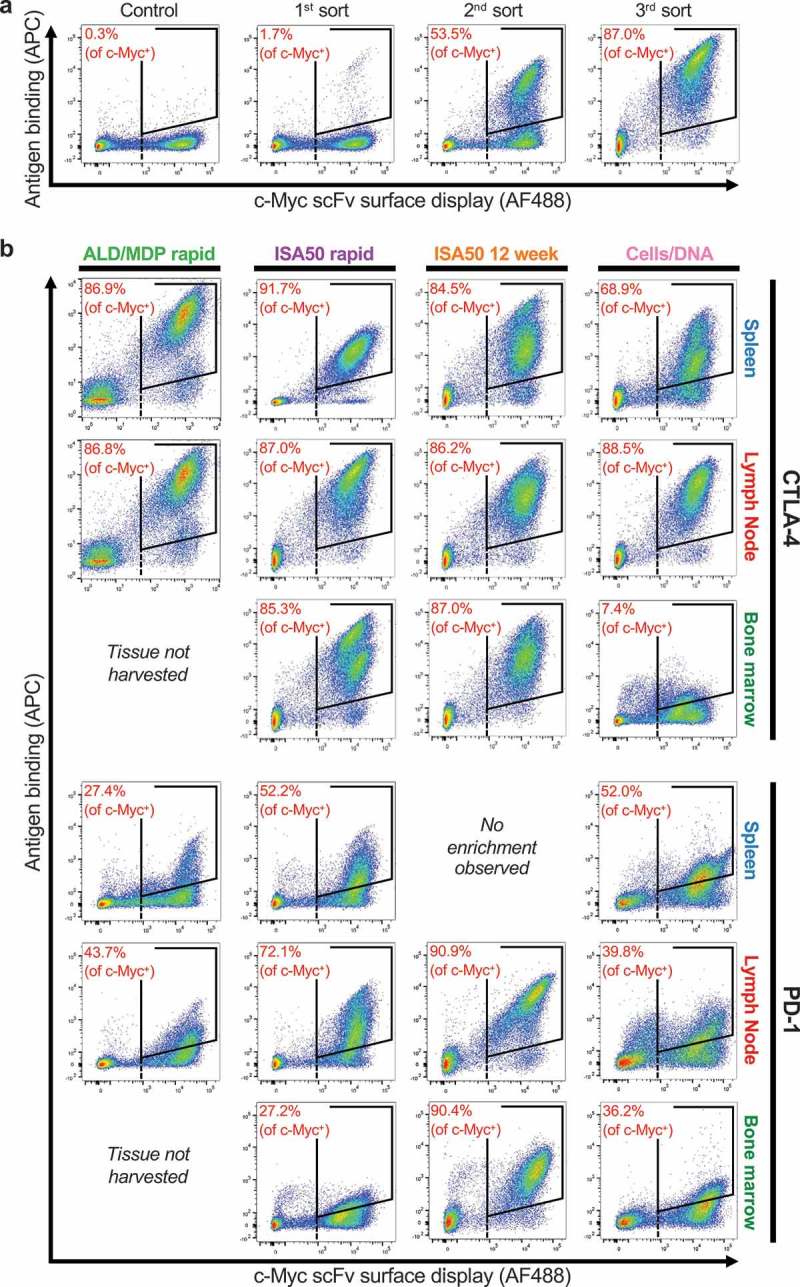
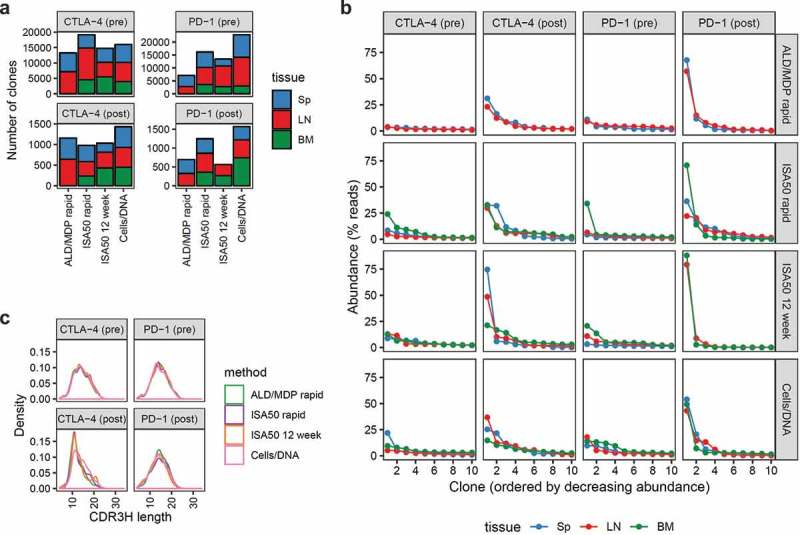
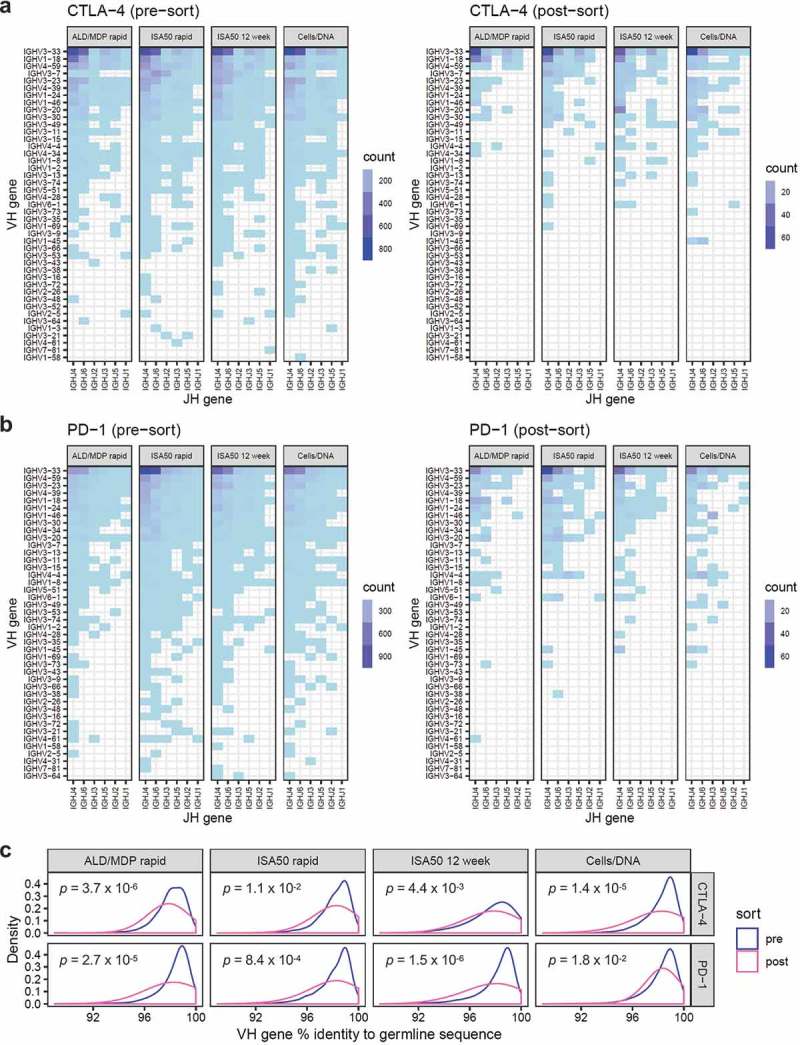
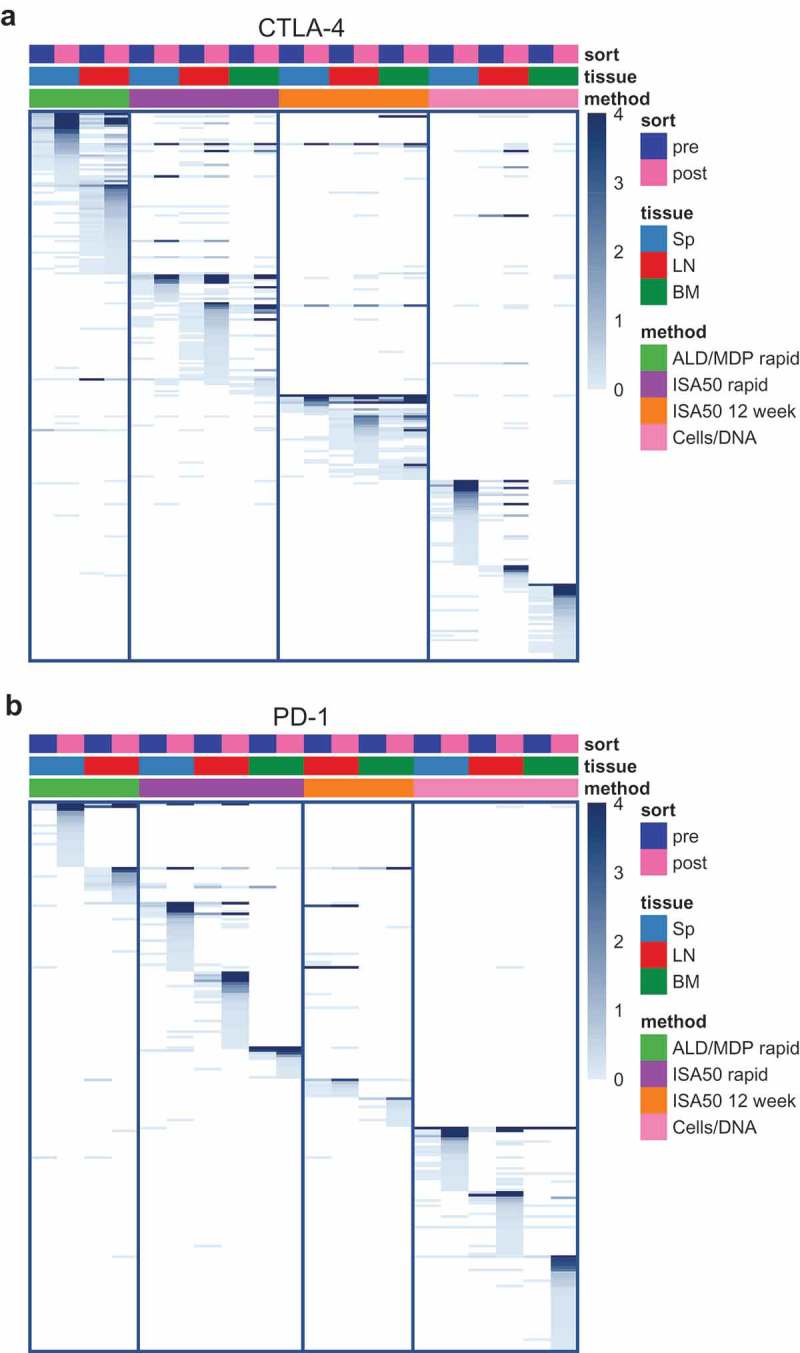
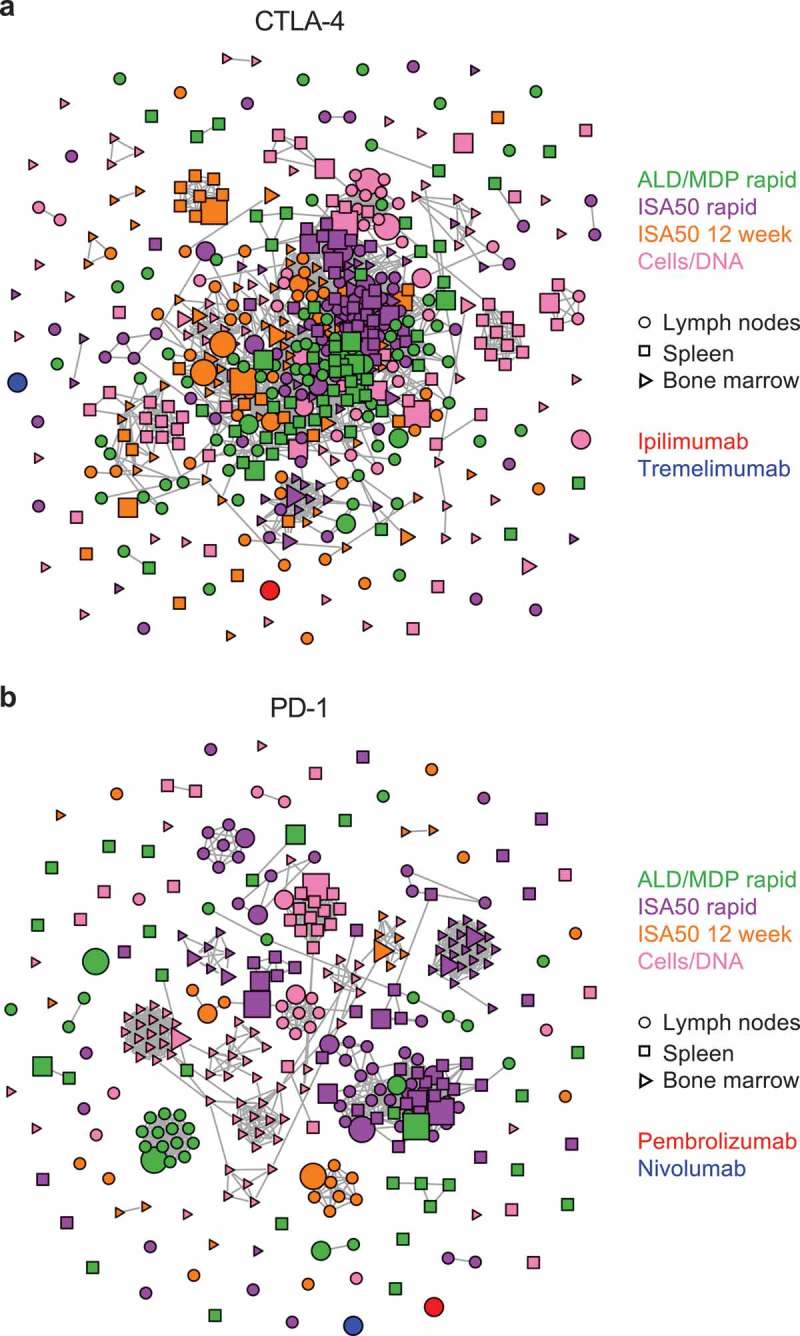
Immunization of mice followed by hybridoma or B-cell screening is one of the most common antibody discovery methods used to generate therapeutic monoclonal antibody (mAb) candidates. There are a multitude of different immunization protocols that can generate an immune response in animals. However, an extensive analysis of the antibody repertoires that these alternative immunization protocols can generate has not been performed. In this study, we immunized mice that transgenically express human antibodies with either programmed cell death 1 protein or cytotoxic T-lymphocyte associated protein 4 using four different immunization protocols, and then utilized a single cell microfluidic platform to generate tissue-specific, natively paired immunoglobulin (Ig) repertoires from each method and enriched for target-specific binders using yeast single-chain variable fragment (scFv) display. We deep sequenced the scFv repertoires from both the pre-sort and post-sort libraries. All methods and both targets yielded similar oligoclonality, variable (V) and joining (J) gene usage, and divergence from germline of enriched libraries. However, there were differences between targets and/or immunization protocols for overall clonal counts, complementarity-determining region 3 (CDR3) length, and antibody/CDR3 sequence diversity. Our data suggest that, although different immunization protocols may generate a response to an antigen, performing multiple immunization protocols in parallel can yield greater Ig diversity. We conclude that modern microfluidic methods, followed by an extensive molecular genomic analysis of antibody repertoires, can be used to quickly analyze new immunization protocols or mouse platforms.

Keywords: CTLA-4; Humanized mouse antibody repertoires; PD-1; adjuvants; deep sequencing; mouse immunization; yeast display.


Figures

Figure 1.
Figure 1.
Workflow overview. (a) Mice were immunized using one of four immunization methods (ALD/MDP rapid, ISA50 rapid, ISA50 12 week, and Cells/DNA), and spleen, lymph node, and sometimes bone marrow tissues were harvested. (b) Millions of individual B cells from the immunized mice were encapsulated into droplets using a microfluidic system. The cells were lysed, RNA was captured from the single cells, and IgK-IgH scFv libraries were created with emulsion RT-PCR. The bottom image shows the droplet generation process. (c) Linked IgK-IgH DNA libraries were transformed into a yeast display system and sorted against antigen with FACS. The repertoires were deep sequenced before and after sorting. (d) The antibody repertoires were analyzed by a multitude of molecular genomic metrics to identify similarities and differences between the immunization methods/tissues.
Figure 2.
Figure 2.
Serum titers from immunized animals compared to normal mouse serum measured by ELISA prior to tissue harvest. Serum titers of individual CTLA-4 immunized (a) and PD-1 immunized (b) animals were averaged (± standard error) for each immunization method. ISA50 12-week titers were also measured at three time points (insets on right).
Figure 3.
Figure 3.
FACS enrichment of antigen-specific binders using yeast display. The x-axis measures presence of a C-terminal c-Myc tag (AF488), indicating expression of an scFv on the surface of the cell. The y-axis measures the binding of antigen to the scFv-expressing cells (APC). The gates used for yeast selection (double positive) are indicated. A dashed black line identifies c-Myc+ yeast. (a) Example FACS data for a full three sort enrichment series (CTLA-4, ISA50 rapid, Lymph Node), including a control expressing an irrelevant scFv library. (b) The post-3rd sort FACS image is shown for each target, for each tissue, and for each immunization method. Note: the image for CTLA-4, ISA50 rapid, Lymph Node is the same image used for the 3rd sort from (a).
Figure 4.
Figure 4.
Overview of the diversity of the scFv libraries generated using different immunization methods, pre- and post-FACS enrichment of antigen-specific clones. (a) The number of unique scFv clones (defined as the consensus of closely related groups of sequences with ≤2 amino acid differences in their linked CDR3s) derived from CTLA-4 (left) and PD-1 (right) immunized mice. The bars represent the number of clones derived from the four different methods, color-coded by the tissue origin (Sp = Spleen, LN = Lymph nodes, BM = Bone marrow). Note that bone marrow was not harvested for the ALD/MDP rapid method. The top and bottom panels represent pre- and post-sort clone counts, respectively. (b) Oligoclonality of the various libraries as represented by the top ten most abundant clones in each library. The x-axis displays the clones in decreasing abundance while the y-axis represents the abundance (as percent of sequencing reads) of the corresponding clones. The colors represent the libraries derived from different tissue origins. Note that each repertoire is composed of a “long tail” of clones (total clone number is indicated in panel a) that are not shown. (c) Density plots of the distribution of heavy chain CDR3 amino acid lengths of the scFv clones for the various libraries. Each unique clone was only represented once and not scaled by clone abundance.
Figure 5.
Figure 5.
Heavy chain V and J gene usage pre-sort (left panel) and post-sort (right panel). (a) The heatmaps show the abundance of clones with specific V (y-axis) and J (x-axis) gene pairing for the scFv libraries derived from mice immunized with CTLA-4, using the four different immunization methods (shown as individual panels). The color represents clone abundance, as indicated by the legend. (b) V-J-gene usage heatmaps for libraries derived from PD-1 immunized mice. (c) Density plots showing the distribution of heavy chain V gene nucleotide percent identity to germline sequences. The blue and pink curves represent the distribution for the pre- and post-sort libraries, respectively. P-values were calculated by Wilcoxon rank sum test.
Figure 6.
Figure 6.
Heatmaps showing scFv clone sharing among the different libraries for CTLA-4 (a) and PD-1 (b). Each row on the heatmaps represents a unique clone defined by a unique paired light and heavy chain CDR3 (CDR3K+CDR3H). Each column represents an scFv library, annotated by the color boxes on top of the heatmap. For example, the first column represents a pre-sort library derived from the spleen of mice immunized with the ALD/MDP rapid method. The following column represents the post-sort library from the same tissue and method. Only enriched clones, defined as clones with post-sort frequency ≥0.1% and enrichment (post versus pre) ≥1.8 fold in at least one library, are shown. The color of the heatmaps represents clone abundance in percent sequencing reads, as indicated in the legend. The clones (rows) are arranged by descending abundance in the post-sort libraries, within each pre-post library pair, for the library pairs from left to right of the heatmaps. A dark blue bar across multiple columns indicates that a particular enriched clone is observed across multiple libraries. The PD-1 spleen library from the ISA50 12-week method did not enrich during FACS, and thus this particular set of libraries was not shown.
Figure 7.
Figure 7.
Clonal cluster analysis for the FACS-enriched scFv clones. Each node represents an scFv clone (full-length IgK+IgH). The color of the nodes indicates the immunization method from which the scFv clones were derived. The size of the nodes reflects the frequency of the scFv clones in the FACS-sorted population (small = 0.1–3%; medium = 3–12%; large = >12%). The shape of the nodes indicates the mouse tissue origin from which the clones were derived. We computed the total number of amino acid differences between each pairwise alignment of scFv sequences. Edges indicate pairwise alignments with ≤9 amino acid differences. (a) Clonal clusters for CTLA-4 binders. The scFv sequences for two mAbs against CTLA-4, ipilimumab and tremelimumab, were included for comparison. (b) Clonal clusters for PD-1. The scFv sequences for two mAbs against PD-1, pembrolizumab and nivolumab, were included for comparison. The size and shape parameters do not apply to the mAbs.

Similar articles

Cited by

References

    1. Nelson AL, Dhimolea E, Reichert JM.. Development trends for human monoclonal antibody therapeutics. Nat Rev Drug Discov. 2010;9:767–74. doi:10.1038/nrd3229. - DOI - PubMed
    1. McNeal MM, Rae MN, Ward RL. Effects of different adjuvants on rotavirus antibody responses and protection in mice following intramuscular immunization with inactivated rotavirus. Vaccine. 1999;17:1573–80. doi:10.1016/S0264-410X(98)00359-4. - DOI - PubMed
    1. Khurana S, Verma N, Yewdell JW, Hilbert AK, Castellino F, Lattanzi M, Del Giudice G, Rappuoli R, Golding H. MF59 Adjuvant enhances diversity and affinity of antibody-mediated immune response to pandemic influenza vaccines. Sci Transl Med. 2011;3:85ra48–8. - PMC - PubMed
    1. Georgiou G, Ippolito GC, Beausang J, Busse CE, Wardemann H, Quake SR. The promise and challenge of high-throughput sequencing of the antibody repertoire. Nat Biotechnol. 2014;32:158–68. doi:10.1038/nbt.2782. - DOI - PMC - PubMed
    1. Lu J, Panavas T, Thys K, Aerssens J, Naso M, Fisher J, Rycyzyn M, Sweet RW. IgG variable region and VH CDR3 diversity in unimmunized mice analyzed by massively parallel sequencing. Mol Immunol. 2014;57:274–83. doi:10.1016/j.molimm.2013.09.008. - DOI - PubMed

Publication types

MeSH terms

Substances