. 2019 Mar 21;19(1):111.
doi: 10.1186/s12870-019-1719-9.

VvmiR160s/VvARFs interaction and their spatio-temporal expression/cleavage products during GA-induced grape parthenocarpy

Affiliations

VvmiR160s/VvARFs interaction and their spatio-temporal expression/cleavage products during GA-induced grape parthenocarpy

Wenying Zhang et al. BMC Plant Biol. .

Abstract

Background: Grape (Vitis vinifera) is highly sensitive to gibberellin (GA), which effectively induce grape parthenocarpy. Studies showed that miR160s and their target AUXIN RESPONSIVE FACTOR (ARF) responding hormones are indispensable for various aspects of plant growth and development, but their functions in GA-induced grape parthenocarpy remain elusive.

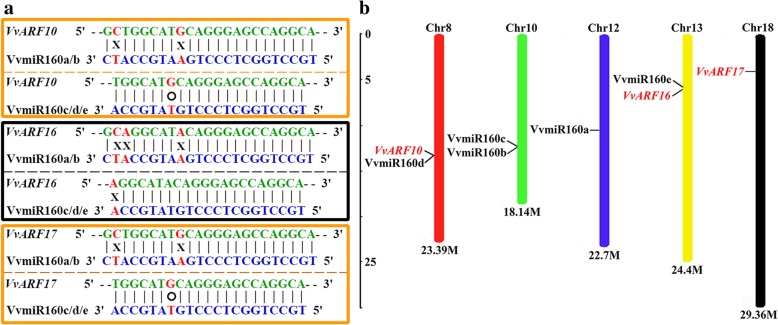
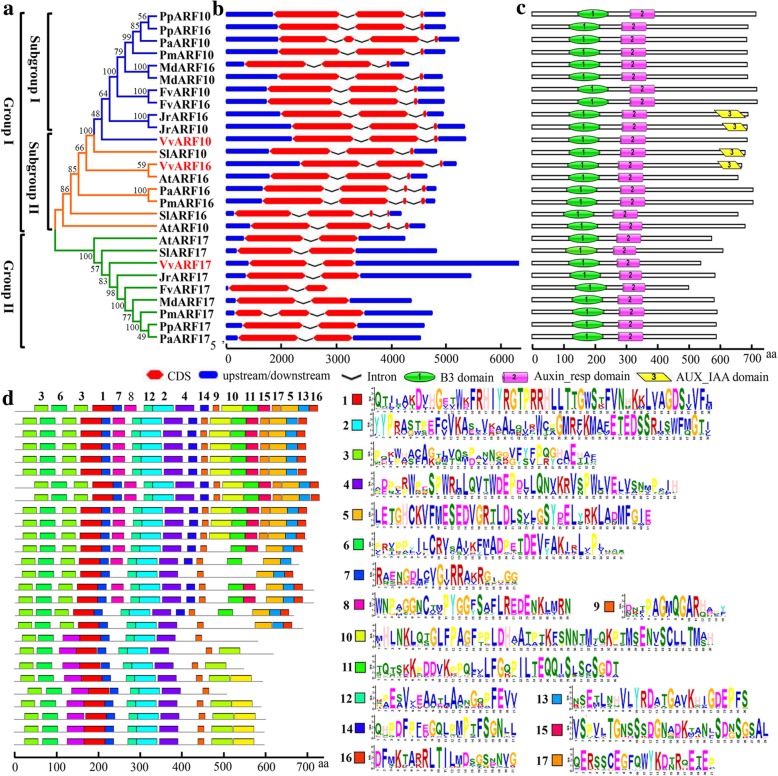
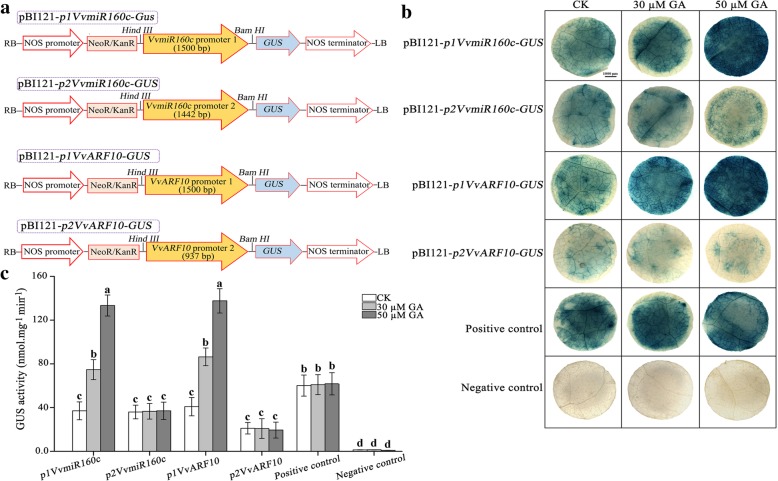
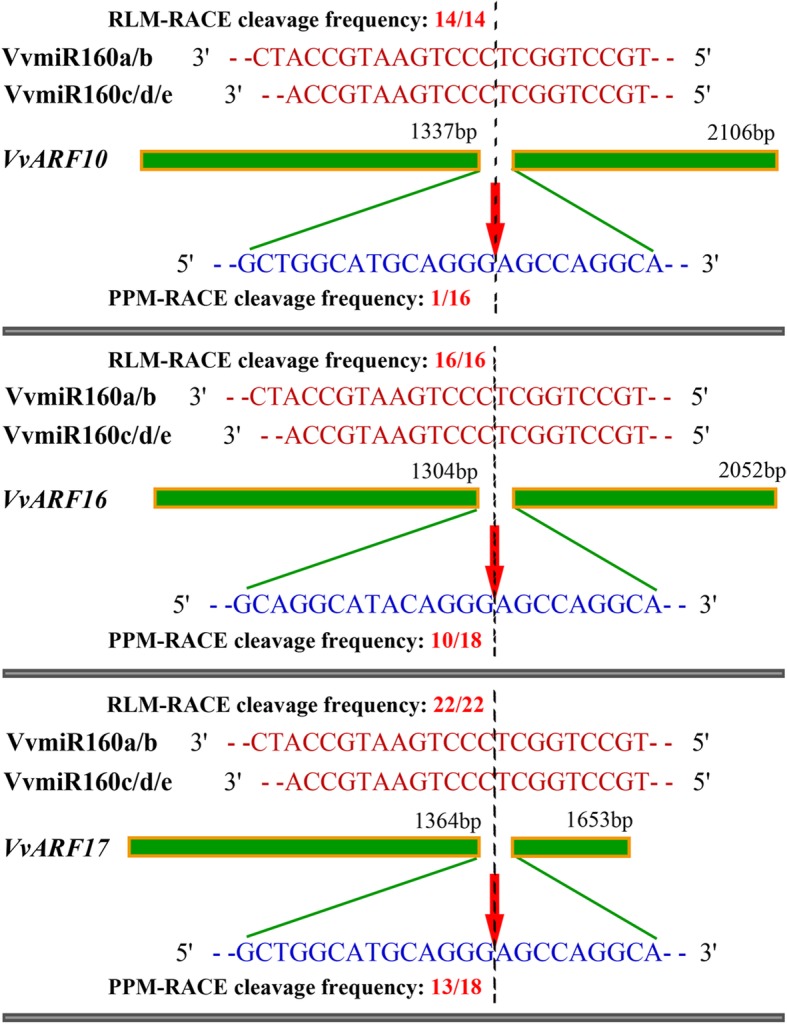
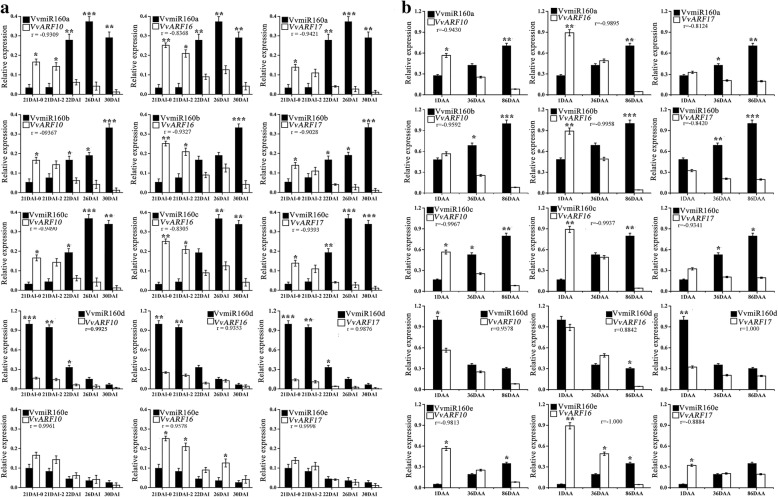
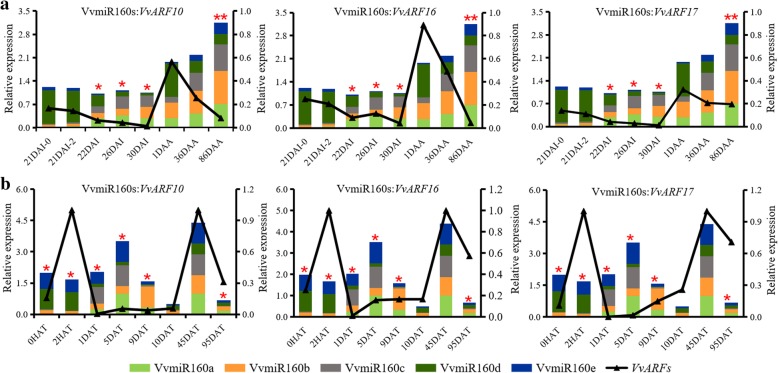
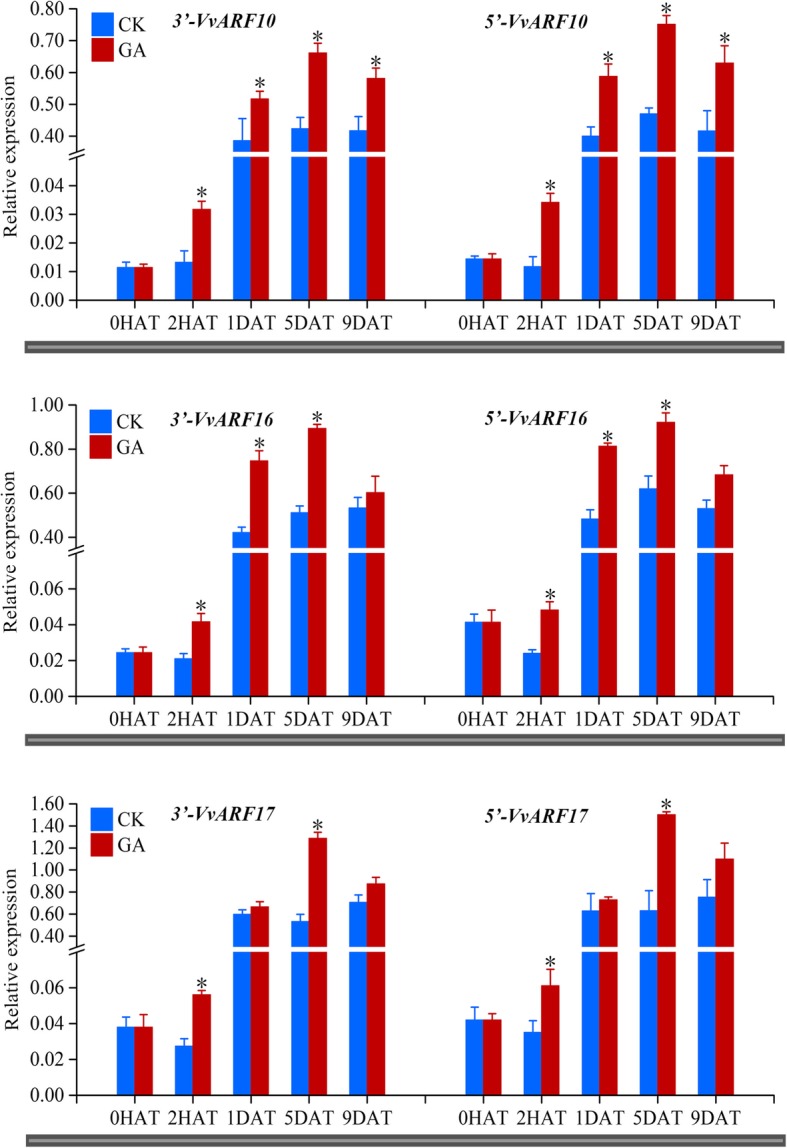
Results: In this study, the morphological changes during flower development in response to GA treatments were examined in the 'Rosario Bianco' cultivar. The precise sequences of VvmiR160a/b/c/d/e and their VvARF10/16/17 target genes were cloned, sequenced and characterized. The phylogenetic relationship and intron-exon structure of VvARFs and other ARF family members derived from different species were investigated. All VvmiR160s (except VvmiR160b) and VvARF10/16/17 had the common cis-elements responsive to GA, which support their function in GA-mediated grape parthenocarpy. The cleavage role of VvmiR160s-mediated VvARF10/16/17 was verified in grape flowers. Moreover, spatio-temporal expression analysis demonstrated that among VvmiR160 family, VvmiR160a/b/c highly expressed at late stage of flower/berry development, while VvARF10/16/17showed a reverse expression trend. Interestingly, GA exhibited a long-term effect through inducing the expression of VvmiR160a/b/c/e to increase their cleavage product accumulations from 5 to 9 days after treatment, but GA enhanced the expressions of VvARF10/16/17 only at short term. Pearson correlation analysis based on expression data revealed a negative correlation between VvmiR160a/b/c and VvARF10/16/17 in flowers not berries during GA-induced grape parthenocarpy.

Conclusions: This work demonstrated that the negative regulation of VvARF10/16/17 expression by VvmiR160a/b/c as key regulatory factors is critical for GA-mediated grape parthenocarpy, and provide significant implications for molecular breeding of high-quality seedless berry.

Keywords: Flower; Gibberellin; Grape; Parthenocarpy; VvARFs; VvmiR160s.


Conflict of interest statement

Ethics approval and consent to participate

The plants used in our study are not endangered species. Plant sample collection and transgenic plants were performed in accordance with the local legislation in China.

Consent for publication

Not applicable.

Competing interests

The authors declare that they have no competing interests.

Publisher’s Note

Springer Nature remains neutral with regard to jurisdictional claims in published maps and institutional affiliations.

Figures

Fig. 1
Fig. 1
Morphological changes of the floral and berry development during grapevine parthenocarpy process-induced by exogenous gibberellin (GA) application. a Morphological changes of ‘Rosario Bianco’ cultivar during flower and berry development in response to GA3 treatment at different time points [0 h, 2 h, 1 day, 5 , 9 , 10 , 45 and 95 days after treatment (0HAT, 2HAT, 1DAT, 5DAT, 9DAT, 10DAT, 45DAT and 95DAT, respectively)]. b Effect of GA3 on the length and width of grape spikes. Values are means ± standard errors (SEs) of three independent biological replicates (n = 10). Asterisks indicate a significant difference between GA-treated plants and respective untreated control (CK) plants at each time point as determined by Student’s t-test (*P < 0.05; **P < 0.01)
Fig. 2
Fig. 2
Mature sequences of VvmiR160s and the secondary structures of their precursors. a The PCR products of 3′-miR-RACE and 5′-miR-RACE for VvmiR160a/b/c/d/e, respectively, and the cloning of their primary sequences. b Comparison of our cloned VvmiR160s precise sequences with the homologous sequences in grapes from MiRBase. c The secondary structures of VvmiR160s precursors, where red frames indicate the mature sequences of VvmiR160s at the 5′-end arms of their precursor structures
Fig. 3
Fig. 3
Complementary degree and distribution of VvmiR160s and their VvARF targeted genes on grapevine chromosomes. a The complementary degree of VvmiR160s and their potential VvARF target genes. ‘X’ represents complementary mismatch, and ‘O’ represents the 0.5 mismatches. b The distribution of VvmiR160s and VvARFs on grapevine chromosomes. The chromosome numbers and sizes (Mb) are indicated at the top and bottom of each bar, respectively
Fig. 4
Fig. 4
The phylogenetic relationship, exon-intron organization, and conserved domain analyses among the grapevine ARF proteins and their orthologous sequences across different plant species. a The unrooted tree was generated using MEGA 7.0.21 program by neighbor-joining method. Bootstrap values from 1000 replicates are indicated at each branch. b The exon-intron composition of ARF genes. The coding (CDS) and up−/down-stream regions are represented by red and blue boxes, respectively. Lines represent the introns. c Conserved domains in ARF proteins determined by searching the ARF protein sequences in NCBI Conserved Domain Database. B3: plant-specific B3-DNA binding domain, Auxin_resp: a conserved region of an auxin-responsive factor, AUX_IAA: C-terminal AUX_IAA domain. d The conserved motifs of ARF proteins in nine species were performed using the MEME program and arranged corresponding to the phylogenetic tree. Different motifs are highlighted with different color boxes and numbers. The length of boxes corresponded to motif length
Fig. 5
Fig. 5
Motif analysis of the promoters from the VvMIR160s precursor and their target VvARF genes. a The total number of diverse types of motifs derived from VvMIR160s and VvARFs promoters which are involved in the different biological process. b The proportion of each type of hormone-related elements of VvMIR160s and its VvARF targeted genes respectively. c The percentage of the total amount of the hormone-related cis-elements of VvMIR160s and its VvARF targeted genes respectively
Fig. 6
Fig. 6
Functional analyses of the VvMIR160c and VvARF10 promoters. a Schematic diagram of the pBI121-pVvmiR160c/VvARF10-GUS constructs. pBI121-p1VvMIR160c-GUS and pBI121-p1VvARF10-GUS constructs. The 1.5 kb promoter regions of VvMIR160c and VvARF10 were cloned into pBI121 to replace the 35SCaMV promoter and were used to drive the GUS gene. pBI121-p2VvMIR160c-GUS constructs. The 1442 bp promoter fragment region of VvMIR160c without including the GA response element (59–1500 bp) was cloned into pBI121 to replace the 35SCaMV promoter and was used to drive the GUS gene. pBI121-p2VvARF10-GUS constructs. The 937 bp promoter fragment region of VvmiR160c without including the GA response element (564–1500 bp) was cloned into pBI121 to replace the 35SCaMV promoter and was used to drive the GUS gene. b and c Histochemical staining pattern (b) and GUS activity (c) of tobacco leaves in response to different treatments. The fully expanded leaves from 6-week-old tissue culture plants of tobacco were infiltrated with Agrobacterium carrying different constructs. The infiltrated seedlings were then moved back to the environmental chamber and kept in the dark for 3 d. Treatment on tobacco leaves with 30 μM GA and 50 μM GA were performed 2 days later. The uniformly sized leaves were used in infiltration experiment. The presented images of leaves in (b) are representative of the results obtained from three independent experiments. Data shown in (c) represent the mean ± SD of three independent experiments (n = 3). Different letters denote significant differences between the constructs and the treatments (P < 0.05), positive control (pBI121); negative control (pBI101)
Fig. 7
Fig. 7
Mapping of the VvmiR160s-mediated cleavage sites on VvARFs by PPM-RACE and RLM-RACE. The red arrows indicate the cleavage sites of VvmiR160s on VvARFs identified by 5′ and 3′-ends of mRNA fragments cloned by PPM-RACE and RLM-RACE, respectively. The red and blue sequences represent the mature sequences of VvmiR160s and their target region sequences in VvARFs, respectively. Green strip denotes the remaining sequence outside the targeted region
Fig. 8
Fig. 8
Characterization of VvmiR160:VvARF expression and Pearson correlation analysis during grape flower and berry development. a Characterization of VvmiR160:VvARF expression and Pearson correlation analysis during grape flower development. b Characterization of VvmiR160:VvARF expression and Pearson correlation analysis during grape berry development. The relative expression of VvmiR160a/b/c/d/e and the three VvARF10/16/17 target genes at different stages [21 days after inflorescences (21DAI), 22DAI, 26DAI and 30DAI; 1 day after anthesis (1DAA), 36DAA, 86DAA] of floral and berry development. Pearson correlation coefficient (r) between VvmiR160 and VvARF expression are indicated. Each experiment was repeated three times. ANOVA test was used to identify significant differences, Asterisks indicated statistically significant differences at (*P < 0.05; **P < 0.01; ***P < 0.001) as determined by Student’s t-test
Fig. 9
Fig. 9
Differential expression of VvmiR160 and VvARF target genes in response to GA application at different stages of floral and berry development. a Differential expression of VvmiR160s and their VvARF target genes in response to gibberellin (GA) treatment at different time points [0 h after treatment (0HAT), 2HAT, 1 day after treatment (1DAT), 5DAT, 9DAT] of floral development. b Differential expression of VvmiR160s and their VvARF target genes in response to gibberellin (GA) treatment at different time points (10DAT, 45DAT, 95DAT) of berry development. c Differential expression and Pearson correlation analysis of each member of VvmiR160 family and its respective VvARF target genes in response to GA treatment during floral development. d Differential expression and Pearson correlation analysis of each member of VvmiR160 family and its respective VvARF target genes in response to GA treatment during berry development. Each experiment was repeated three times. ANOVA test was used to identify significant differences, Asterisks indicate significant difference between GA-treated plants and respective untreated control (CK) plants at each time point as determined by Student’s t-test (*P < 0.05; **P < 0.01; ***P < 0.001)
Fig. 10
Fig. 10
Pearson correlation analysis of total expression of VvmiR160s and their VvARF targets genes. a Correlation of total expression of VvmiR160s and their VvARF target genes during grape development [21 days after inflorescences (21DAI), 22DAI, 26DAI and 30DAI; 1 day after anthesis (1DAA), 36DAA, 86DAA]. b Correlation of total expression of VvmiR160s and their VvARF target gene s in response to gibberellin (GA) treatment at different time points [0 h after treatment (0HAT), 2HAT, 1 day after treatment (1DAT), 5DAT, 9DAT, 10DAT, 45DAT, 95DAT]. ANOVA test was used to identify significant differences, Asterisks indicated statistically significant differences at (*P < 0.05; **P < 0.01; ***P < 0.001) as determined by Student’s t-test
Fig. 11
Fig. 11
Accumulation patterns of 3′- and 5′-end cleavage products of miR160s cleaved VvARF10/16/17 target genes in gibberellin (GA)-treated and untreated control (CK) plants at different stages of grape floral development. VvARFs-5’represents the accumulation of 5′-end cleavage products of VvARFs mediated by VvmiR160s using real-time qPCR; VvARFs-3′ represents 3′-end cleavage products. Each experiment was repeated three times. [0 h after treatment (0HAT), 2HAT, 1 day after treatment (1DAT), 5DAT, 9DAT]. ANOVA test was used to identify significant differences, Asterisks indicated statistically significant differences at (*P < 0.05; **P < 0.01) as determined by Student’s t-test

Similar articles

Cited by

References

    1. Camposrivero G, Osoriomontalvo P, Sánchezborges R, Uscamas R, Duarteaké F, Dela PC. Plant hormone signaling in flowering: an epigenetic point of view. J Plant Physiol. 2017;214:16–27. doi: 10.1016/j.jplph.2017.03.018. - DOI - PubMed
    1. Blázquez MA, Weigel D. Integration of floral inductive signals in Arabidopsis. Nature. 2000;404:889–892. doi: 10.1038/35009125. - DOI - PubMed
    1. Spanudakis E, Jackson S. The role of microRNAs in the control of flowering time. J Exp Bot. 2014;65:365–380. doi: 10.1093/jxb/ert453. - DOI - PubMed
    1. Wang JW. Regulation of flowering time by the miR156-mediated age pathway. J Exp Bot. 2014;65:4723–4730. doi: 10.1093/jxb/eru246. - DOI - PubMed
    1. Kazan K, Lyons R. The link between flowering time and stress tolerance. J Exp Bot. 2015;67:47–60. doi: 10.1093/jxb/erv441. - DOI - PubMed

MeSH terms

LinkOut - more resources