

Prediction of dengue outbreaks based on disease surveillance, meteorological and socio-economic data
- PMID: 30898092
- PMCID: PMC6427843
- DOI: 10.1186/s12879-019-3874-x
Prediction of dengue outbreaks based on disease surveillance, meteorological and socio-economic data
Abstract
Background: The goal of this research is to create a system that can use the available relevant information about the factors responsible for the spread of dengue and; use it to predict the occurrence of dengue within a geographical region, so that public health experts can prepare for, manage and control the epidemic. Our study presents new geospatial insights into our understanding and management of health, disease and health-care systems.
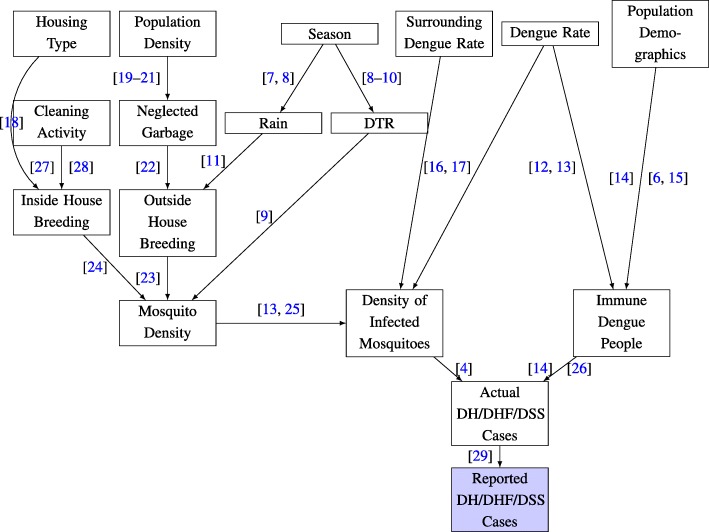
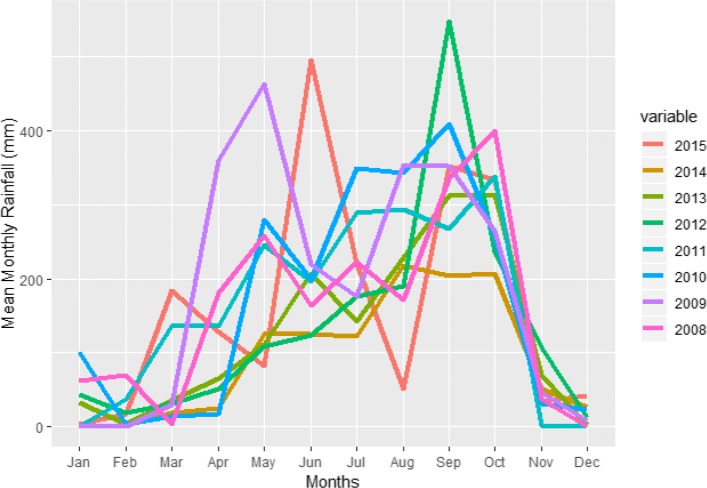
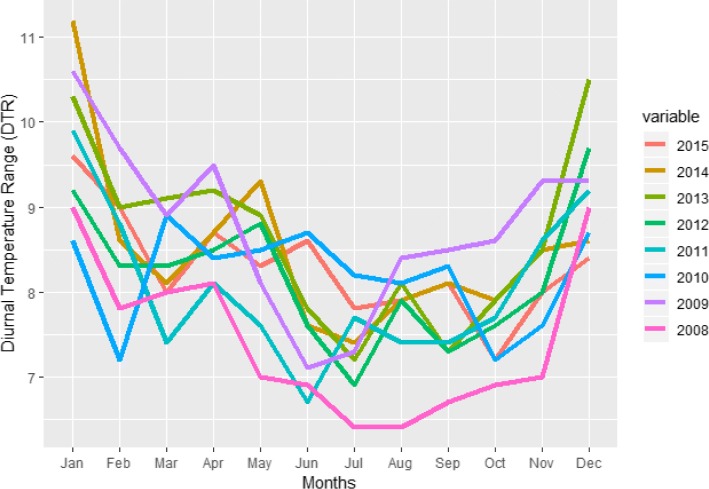
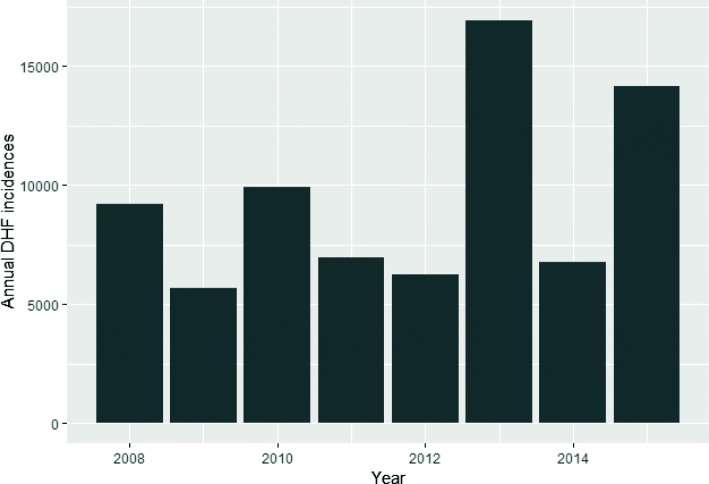
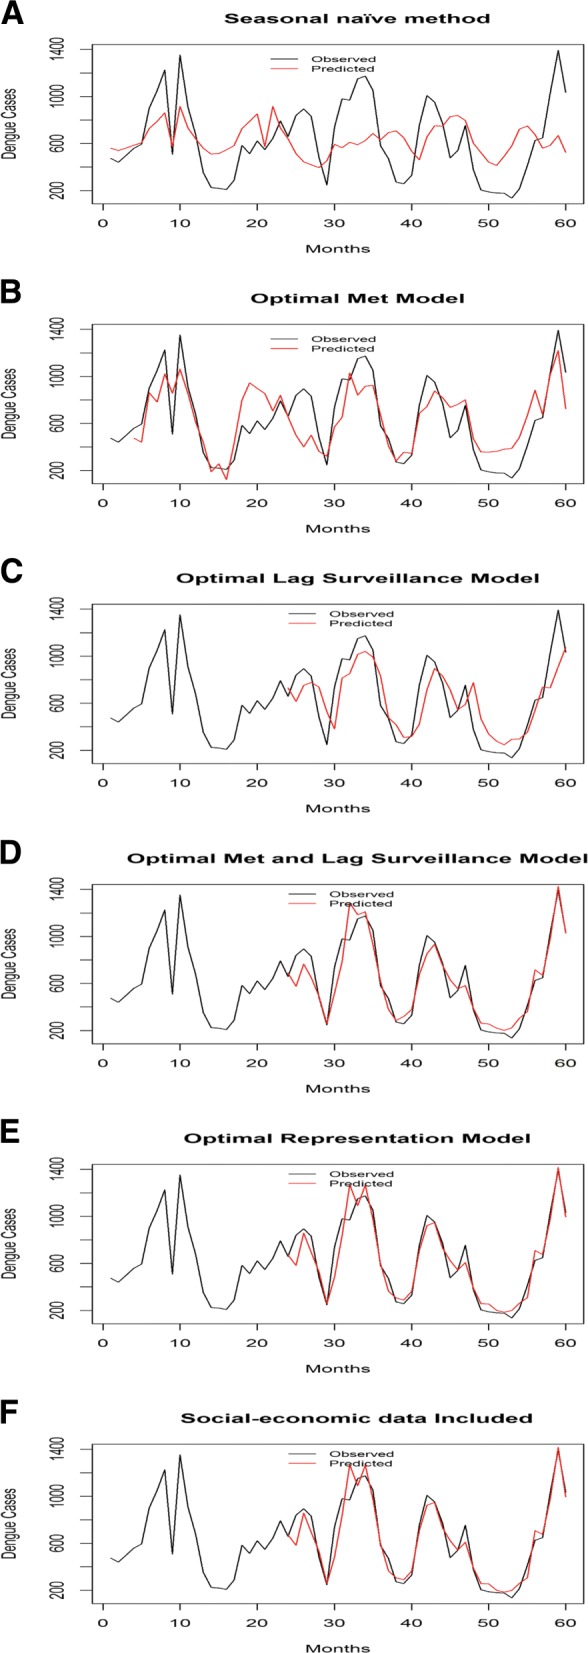
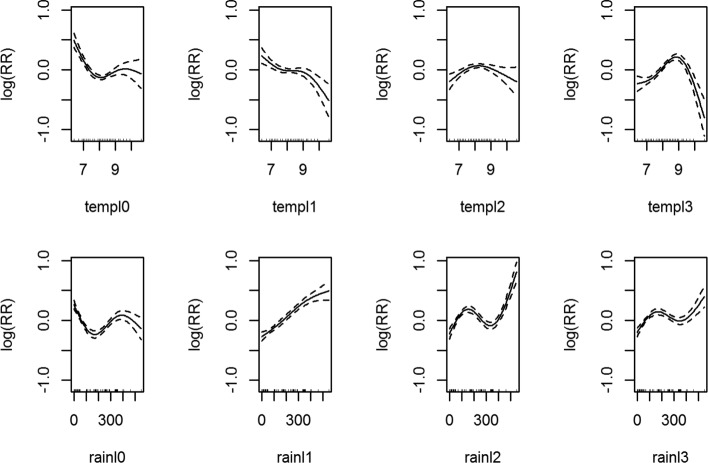
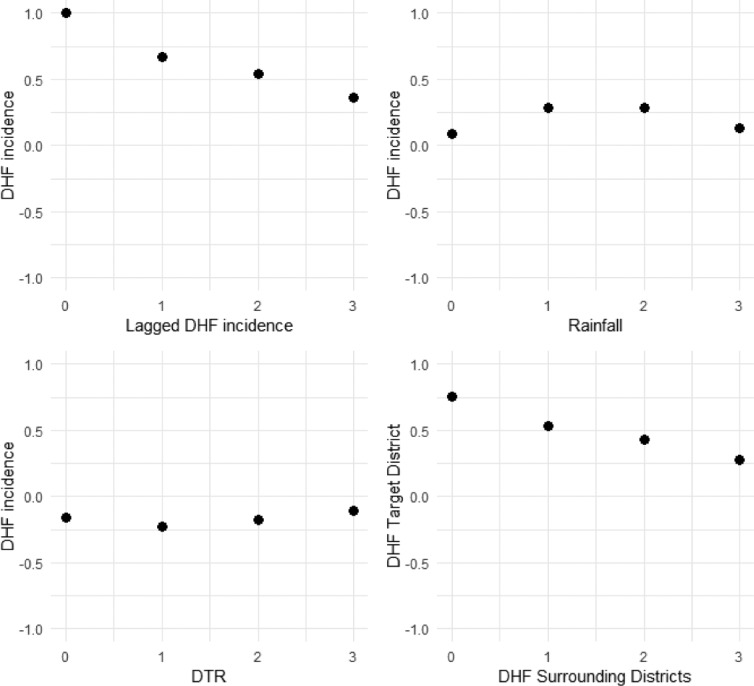
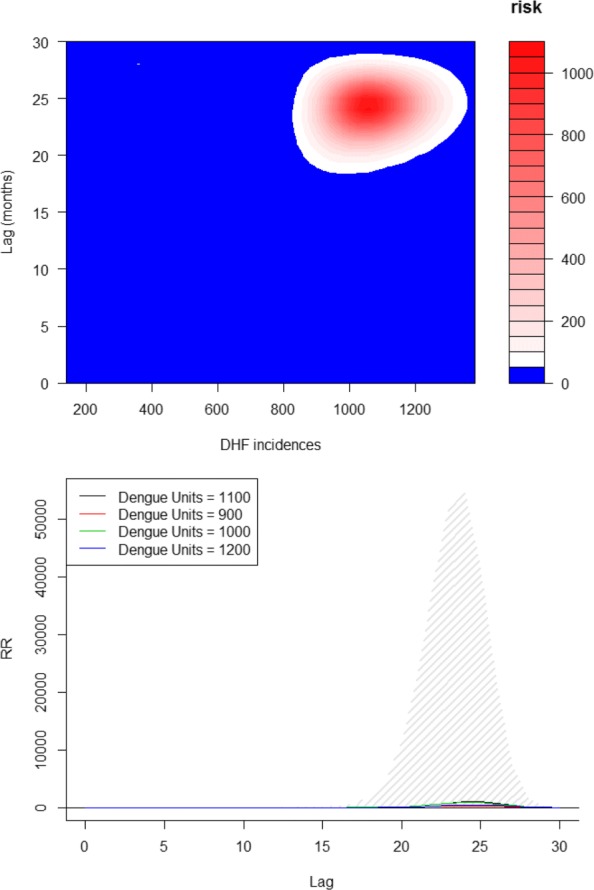
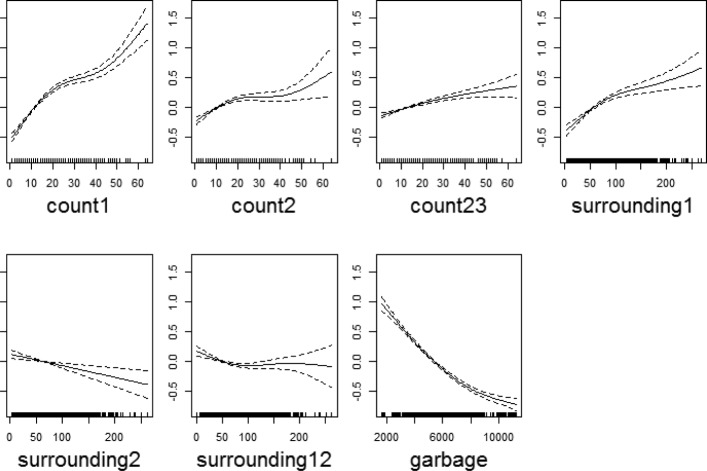
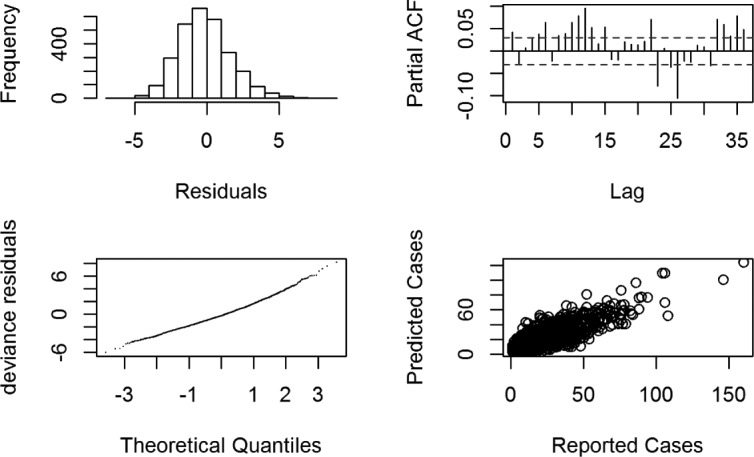
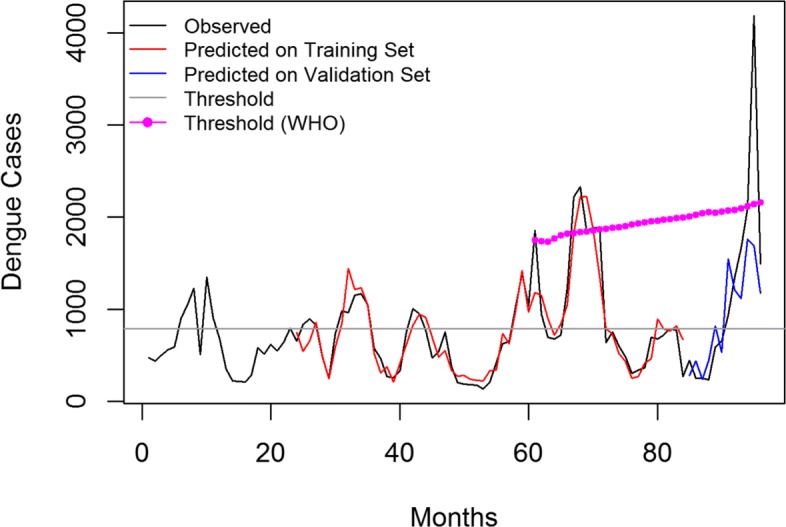
Methods: We present a machine learning-based methodology capable of providing forecast estimates of dengue prediction in each of the fifty districts of Thailand by leveraging data from multiple data sources. Using a set of prediction variables, we show an increase in prediction accuracy of the model with an optimal combination of predictors which include: meteorological data, clinical data, lag variables of disease surveillance, socioeconomic data and the data encoding spatial dependence on dengue transmission. We use Generalized Additive Models (GAMs) to fit the relationships between the predictors (with a lag of one month) and the clinical data of Dengue hemorrhagic fever (DHF) using the data from 2008 to 2012. Using the data from 2013 to 2015 and a comparative set of prediction models, we evaluate the predictive ability of the fitted models according to RMSE and SRMSE as well as using adjusted R-squared value, deviance explained and change in AIC.
Results: The model allows for combining different predictors to make forecasts with a lead time of one month and also describe the statistical significance of the variables used to characterize the forecast. The discriminating ability of the final model was evaluated against Bangkok specific constant threshold and WHO moving threshold of the epidemic in terms of specificity, sensitivity, positive predictive value (PPV), and negative predictive value (NPV).
Conclusions: The out-of-sample validation showed poorer results than the in-sample validation, however it demonstrated ability in detecting outbreaks up-to one month ahead. We also determine that for the predicting dengue outbreaks within a district, the influence of dengue incidences and socioeconomic data from the surrounding districts is statistically significant. This validates the influence of movement patterns of people and spatial heterogeneity of human activities on the spread of the epidemic.
Keywords: Data-driven epidemiology; Dengue forecasting; Disease surveillance; Generalized additive models (GAMs).
Conflict of interest statement
Ethics approval and consent to participate
Not applicable.
Consent for publication
Not applicable.
Competing interests
The authors declare that they have no competing interests.
Publisher’s Note
Springer Nature remains neutral with regard to jurisdictional claims in published maps and institutional affiliations.
Figures
References
-
- WHO. Dengue Type. 2015. http://www.who.int/mediacentre/factsheets/fs117/en/. Accessed 20 Nov 2015.
-
- Hammon WM, Sather G. Virological findings in the 1960 hemorrhagic fever epidemic (dengue) in thailand. Am J Trop Med Hyg. 1964;13(4):629–41. - PubMed
MeSH terms
LinkOut - more resources
Full Text Sources
Medical
