. 2019 May 2;74(3):571-583.e8.
doi: 10.1016/j.molcel.2019.02.014. Epub 2019 Mar 18.

MDC1 Interacts with TOPBP1 to Maintain Chromosomal Stability during Mitosis

Affiliations

MDC1 Interacts with TOPBP1 to Maintain Chromosomal Stability during Mitosis

Pia-Amata Leimbacher et al. Mol Cell. .

Abstract

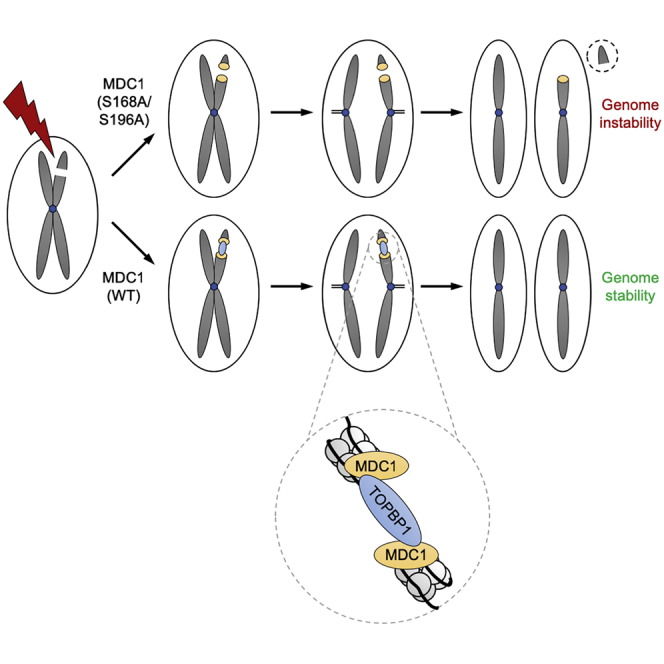
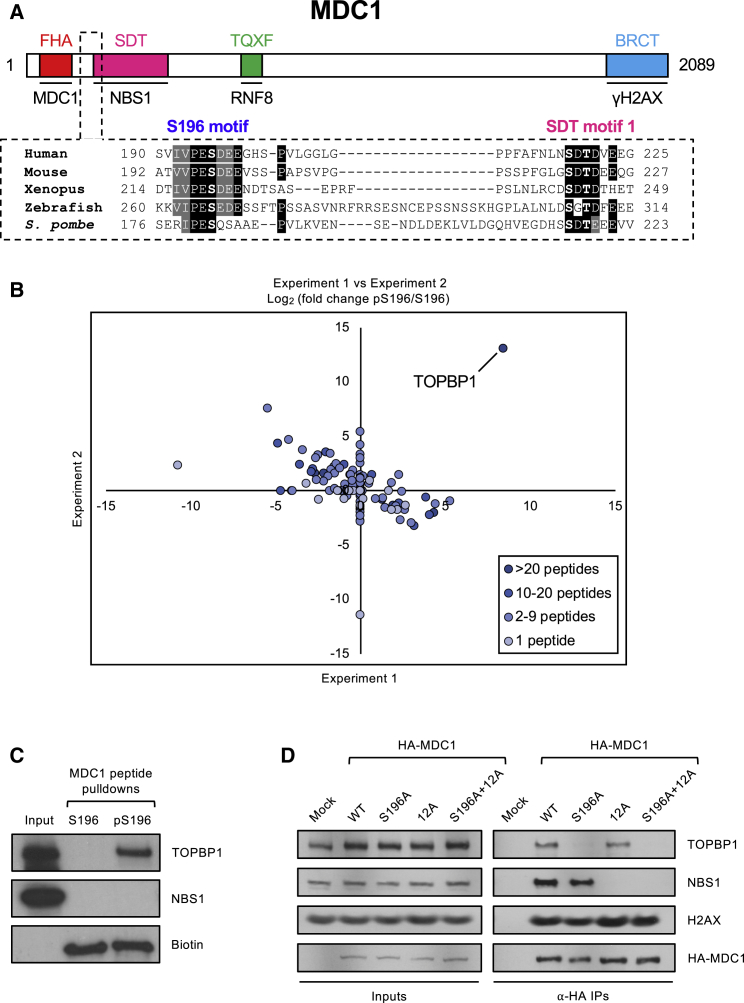
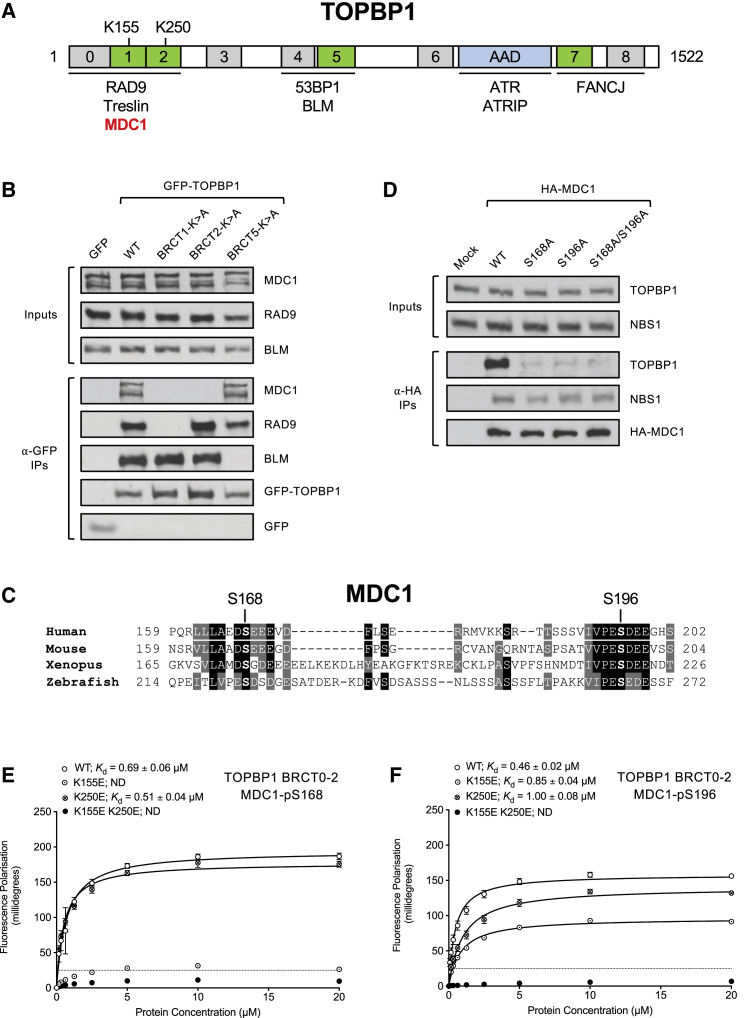
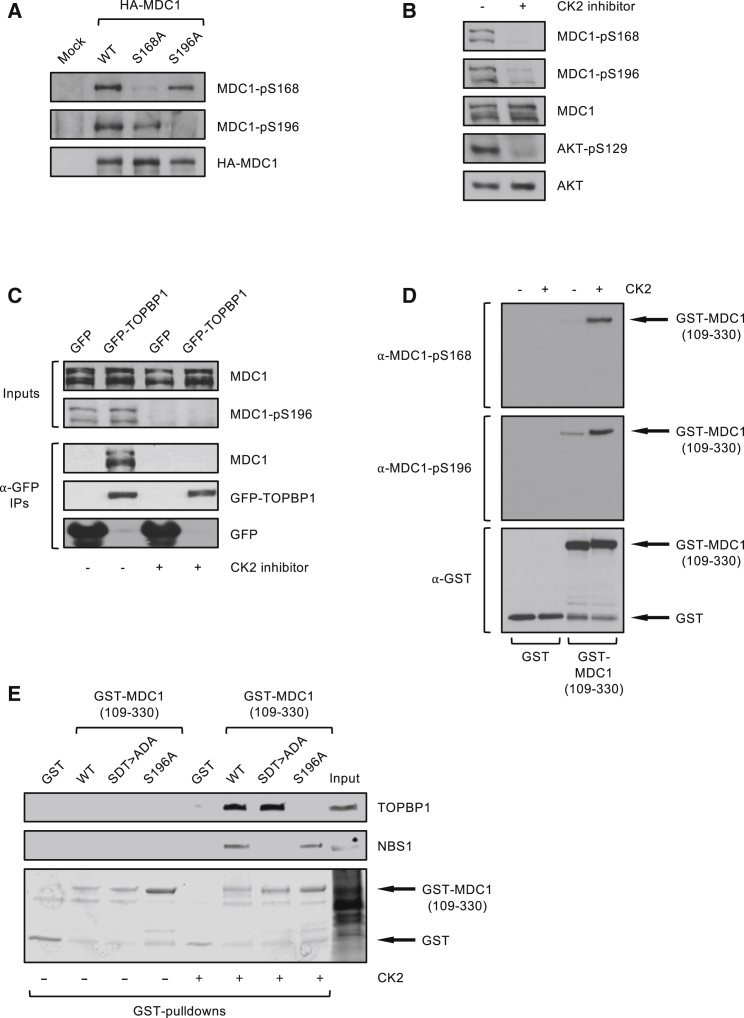
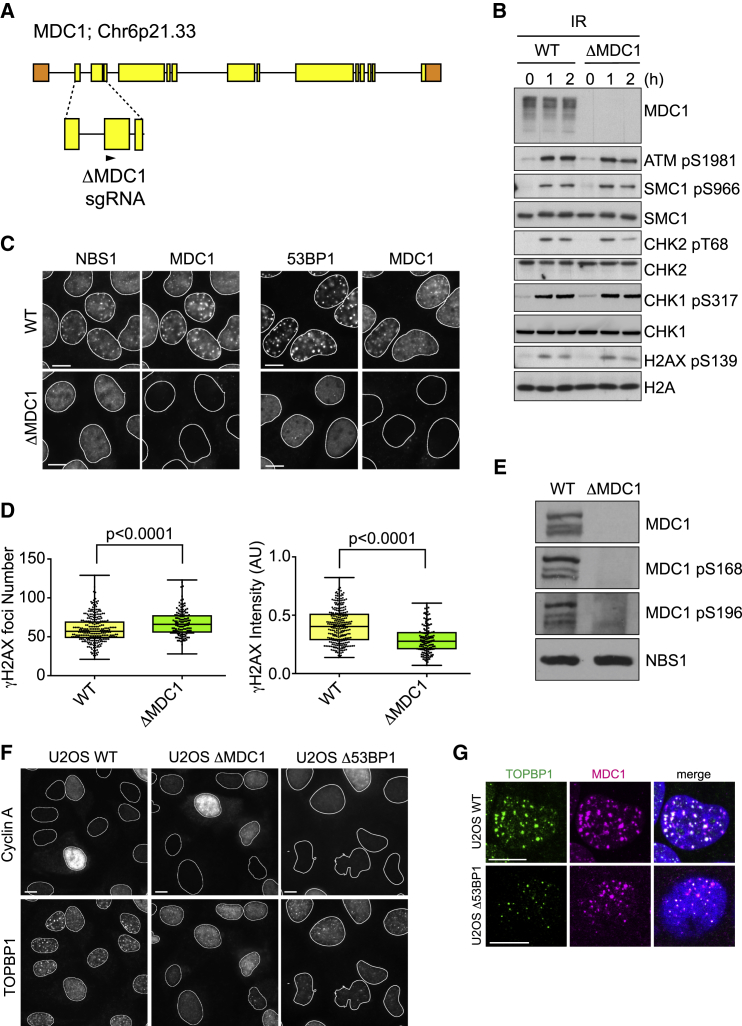
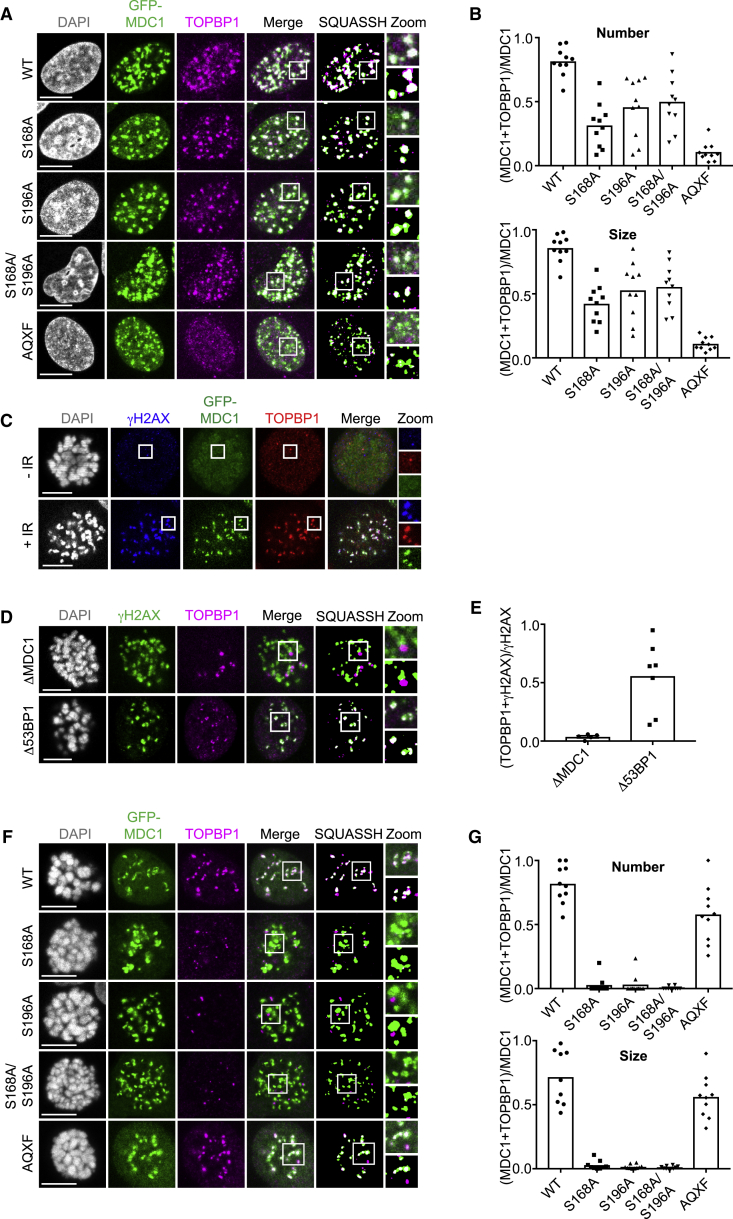
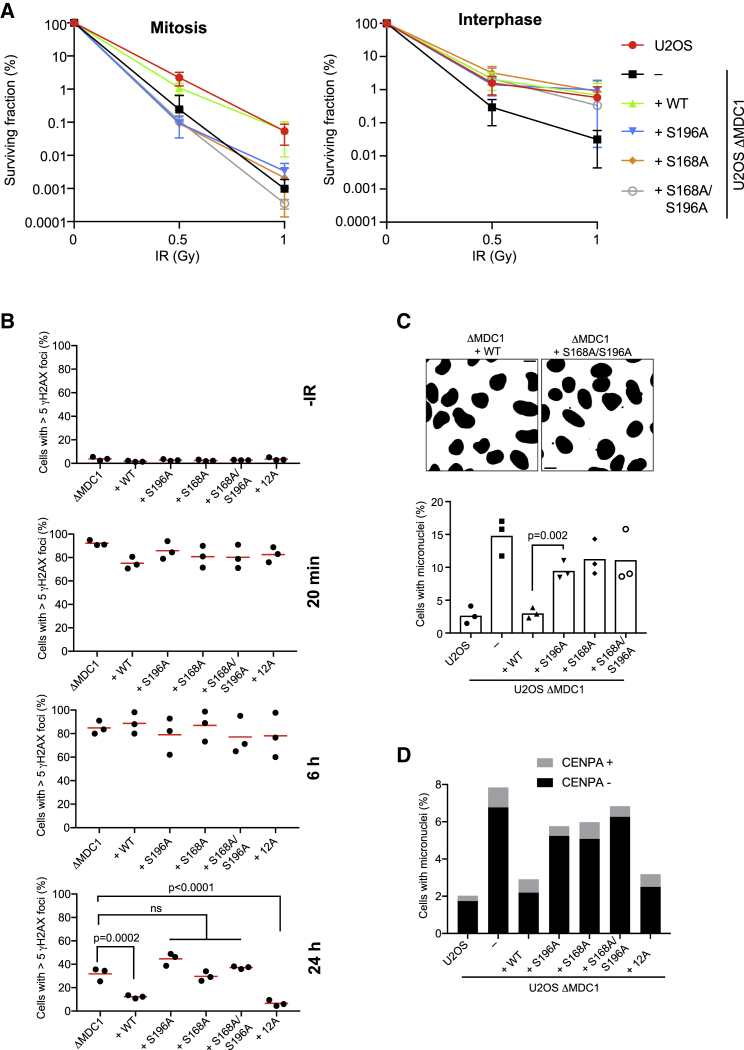
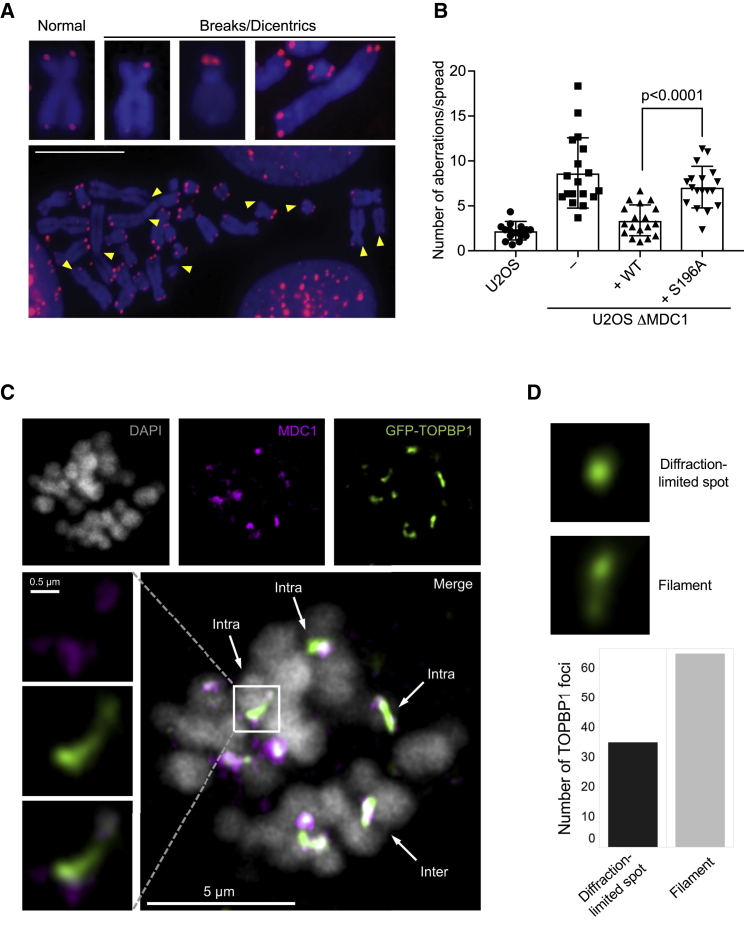
In mitosis, cells inactivate DNA double-strand break (DSB) repair pathways to preserve genome stability. However, some early signaling events still occur, such as recruitment of the scaffold protein MDC1 to phosphorylated histone H2AX at DSBs. Yet, it remains unclear whether these events are important for maintaining genome stability during mitosis. Here, we identify a highly conserved protein-interaction surface in MDC1 that is phosphorylated by CK2 and recognized by the DNA-damage response mediator protein TOPBP1. Disruption of MDC1-TOPBP1 binding causes a specific loss of TOPBP1 recruitment to DSBs in mitotic but not interphase cells, accompanied by mitotic radiosensitivity, increased micronuclei, and chromosomal instability. Mechanistically, we find that TOPBP1 forms filamentous structures capable of bridging MDC1 foci in mitosis, indicating that MDC1-TOPBP1 complexes tether DSBs until repair is reactivated in the following G1 phase. Thus, we reveal an important, hitherto-unnoticed cooperation between MDC1 and TOPBP1 in maintaining genome stability during cell division.


Figures

None
Graphical abstract
Figure 1
Figure 1
A Conserved Acidic Sequence Motif near the N Terminus of MDC1 Binds to TOPBP1 (A) Schematic showing the layout of conserved domains and motifs in MDC1. Names of the known MDC1 binding partners, NBS1, RNF8, and H2AX, are shown below the motifs with which they interact. The FHA domain promotes MDC1 dimerization; hence, its binding partner is MDC1. Key phosphorylated residues are highlighted in bold. (B) Identification of TOPBP1 as a specific interactor for the MDC1-S196 phosphopeptide by LC-MS/MS and label-free quantification. Scatterplot depicts log2 fold enrichment of MDC1-S196 versus MDC1-pS196 peptide-binding proteins from 2 independent experiments. See Table S1 for raw MS data. (C) Peptide pull-downs from HeLa nuclear extracts using biotinylated peptides corresponding to residues surrounding MDC1-S196, either native (S196) or phosphorylated (pS196). (D) HA immunoprecipitations from 293FT cells transfected with the indicated HA-tagged MDC1 variants.
Figure 2
Figure 2
BRCT Domains 1 and 2 of TOPBP1 Interact with MDC1 via Two Phosphorylated Residues, Ser168 and Ser196 (A) Schematic showing the layout of conserved domains and motifs in TOPBP1. Numbered boxes represent BRCT domains, with phosphopeptide-binding domains in green and domains lacking phosphopeptide-binding activity in gray. Names of known TOPBP1 binding partners are shown below the domains they interact with. AAD = ATR-activation domain. (B) GFP pull-downs from 293FT cells transfected with the indicated GFP-tagged TOPBP1 constructs. (C) Sequence alignment showing the conservation of Ser168, Ser196, and surrounding residues in MDC1 in vertebrates. Key phospho-serines are highlighted in bold. (D) HA-immunoprecipitations from 293FT cells transfected with the indicated HA-tagged MDC1 variants. (E) Fluorescence polarization with recombinant TOPBP1 BRCT domains 0–2 and MDC1-pS168 phosphopeptide. K155E is a mutation in TOPBP1 BRCT domain 1; K250E is a mutation in BRCT domain 2. ND = not determined. Dotted line indicates threshold for specific protein-protein interactions. (F) Fluorescence polarization with recombinant TOPBP1 BRCT domains 0–2 and MDC1-pS196 phosphopeptide. See also Figure S1.
Figure 3
Figure 3
MDC1 Phosphorylation and TOPBP1 Binding Are Mediated by CK2 (A) HA-immunoprecipitations from 293FT cells transfected with the indicated constructs. (B) 293FT cells treated with 10 μM CK2 inhibitor CX-4945 were harvested for western blotting with the indicated antibodies. AKT-pS129 is a positive control as AKT is a known CK2 substrate (Siddiqui-Jain et al., 2010). (C) GFP pull-downs from 293FT cells transfected with the indicated GFP-tagged TOPBP1 constructs and treated with 10 μM CK2 inhibitor CX-4945 or DMSO vehicle control. (D) Western blots of an in vitro kinase assay with recombinant CK2 as the kinase, and GST-tagged MDC1 fragment (encompassing residues 109–330) or GST alone as substrates. (E) GST pull-downs from HeLa nuclear extracts with WT and mutant versions of GST-tagged MDC1 fragment (encompassing residues 109–330), preincubated or not with recombinant CK2 and ATP. See also Figure S2.
Figure 4
Figure 4
MDC1 Is Required for TOPBP1 Recruitment to Sites of DSBs in G1 Phase Cells (A) Schematic representation of the human MDC1 gene locus, illustrating the hybridization site of the gRNA selected for the generation of ΔMDC1 cell line used in this study (gRNA sequence in the Key Resources Table). (B) Western blots of total cell extract of irradiated WT U2OS cells and ΔMDC1 cells showing that the ATM and ATR pathways are normally activated in the knock-out cell line in response to IR (3 Gy). (C) Immunofluorescence experiment of irradiated WT U2OS cells and ΔMDC1 cells stained with NBS1 and 53BP1 antibodies. Cells were co-stained with MDC1 antibodies to show lack of MDC1 expression in the knock-out cell line. (D) Quantitative assessment of γH2AX foci in irradiated WT U2OS cells and ΔMDC1 cells (box and whiskers represent minimum to maximum and individual data points are also shown; t test, α = 0.05, at least 130 cells per condition). (E) Western blot showing no signal with the MDC1-pS168 and -pS196 phospho-specific antibodies in ΔMDC1 cells. NBS1 is a loading control. (F) Immunofluorescence experiment of WT U2OS cells, ΔMDC1 cells, and Δ53BP1 cells stained with TOPBP1 antibodies 3 h after IR (3 Gy). Cells were co-stained with Cyclin A antibodies to distinguish G1 phase from S/G2 phase cells. (G) Immunofluorescence experiment of irradiated WT U2OS cells and Δ53BP1 G1 cells stained with MDC1 and TOPBP1 antibodies 3 h after IR (3 Gy). All scale bars represent 10 μm. See also Figure S3.
Figure 5
Figure 5
Direct Interaction with MDC1 Is Essential for TOPBP1 Recruitment to DSBs in Mitotic Cells (A) Confocal microscopy of U2OS cells expressing GFP-tagged MDC1 WT and mutants 3 h after treatment with 3 Gy IR. (B) Quantitative analysis of GFP-MDC1 and TOPBP1 colocalization by SQUASSH. Upper graph: object number colocalization (fraction of objects in each channel that overlap ≥50%). Lower graph: object size colocalization (area of object overlap divided by total object area). Each data point represents one cell (n = 10); bars represent the mean. One-way ANOVA and Dunnett’s multiple comparison test were performed to test for difference of WT versus mutants. All mutant cell lines are significantly different from WT (p ≤ 0.0006). (C) Confocal microscopy of U2OS cells arrested in mitosis by nocodazole (100 ng/mL) and treated with 0.5 Gy IR. (D) Confocal microscopy of U2OS ΔMDC1 and Δ53BP1 cells arrested in mitosis by nocodazole (100 ng/mL) and treated with 0.5 Gy IR. (E) Quantitative analysis of TOPBP1-γH2AX colocalization in ΔMDC1 and Δ53BP1 cells by SQUASSH. Each data point represents one cell (n = 8); bars represent the mean. (F) Confocal microscopy of U2OS cells expressing GFP-tagged MDC1 WT and mutants, arrested in mitosis by nocodazole (100 ng/mL) 1 h after treatment with 0.5 Gy IR. (G) Quantitative analysis of GFP-MDC1 and TOPBP1 colocalization by SQUASSH. Upper graph: object number colocalization. Lower graph: object size colocalization. Each data point represents one cell (n = 10); bars represent the mean. All scale bars represent 10 μm. See also Figure S3.
Figure 6
Figure 6
The MDC1-TOPBP1 Interaction Promotes Genome Stability during Mitosis (A) Clonogenic survival assay of mitotic and interphase U2OS, ΔMDC1, and ΔMDC1 cells stably transfected with MDC1 WT and TOPBP1 binding mutants (mean of 3 independent experiments; error bars: ±SD). (B) Quantification of background γH2AX (−IR) and residual γH2AX foci 20 min, 6 h, and 24 h after irradiation of mitotic cells and subsequent release from mitotic arrest (red bars represent the mean; n = 3). One-way ANOVA and Dunnett’s multiple comparison test were performed for the 24 h time point to test for difference of the mean of ΔMDC1 versus complemented cell lines. (C) Quantification of micronuclei formation 4 h after irradiation of mitotic cells and subsequent release from mitotic arrest (bars represent mean ± SD, n = 3, unpaired t test, α = 0.05, at least 1,000 cells per condition). (D) Quantification of micronuclei formation in untreated U2OS cell lines after staining of micronuclei for CENPA (stacked bars represent means of two independent experiments of at least 700 cells assessed per condition). All scale bars represent 10 μm. See also Figure S4.
Figure 7
Figure 7
TOPBP1 Can Bridge MDC1-Bound DSBs Acquired during Mitosis (A) Examples of chromosomal aberrations in metaphase spreads derived from U2OS ΔMDC1 cells and ΔMDC1 cells stably transfected with TOPBP1 binding mutants, hybridized with a telomere Cy3-labeled PNA probe. Scale bar represents 10 μm. (B) Quantification of chromosomal aberrations: chromosome breaks, chromatid breaks, fragments, and chromosome fusions were scored (bars represent mean ± SD; n = 18, unpaired t test, α = 0.05). (C) Airyscan high-resolution confocal single slice images of GFP-TOPBP1 and MDC1 foci in mitosis 1 h after 0.5 Gy IR. “Intra” indicates an intrachromosomal TOPBP1 filament; “inter” indicates an interchromosomal TOPBP1 filament. (D) Quantification of TOPBP1 foci structures induced by IR in mitotic cells (100 foci scored). Foci structures were determined manually by inspecting images slice by slice in ZEN. Filaments were defined by >1 diffraction-limited spot connected within a TOPBP1 focus. See also Figures S5 and S6.

References

    1. Bang S.W., Kim G.S., Hwang D.S. Oligomerization of TopBP1 is necessary for the localization of TopBP1 to mitotic centrosomes. Biochem. Biophys. Res. Commun. 2013;436:31–34. - PubMed
    1. Beausoleil S.A., Jedrychowski M., Schwartz D., Elias J.E., Villén J., Li J., Cohn M.A., Cantley L.C., Gygi S.P. Large-scale characterization of HeLa cell nuclear phosphoproteins. Proc. Natl. Acad. Sci. USA. 2004;101:12130–12135. - PMC - PubMed
    1. Bizard A.H., Hickson I.D. Anaphase: a fortune-teller of genomic instability. Curr. Opin. Cell Biol. 2018;52:112–119. - PubMed
    1. Blackford A.N., Jackson S.P. ATM, ATR, and DNA-PK: the trinity at the heart of the DNA damage response. Mol. Cell. 2017;66:801–817. - PubMed
    1. Blackford A.N., Nieminuszczy J., Schwab R.A., Galanty Y., Jackson S.P., Niedzwiedz W. TopBP1 interacts with BLM to maintain genome stability but is dispensable for preventing BLM degradation. Mol. Cell. 2015;57:1133–1141. - PMC - PubMed

Publication types