. 2019 Jul:127:462-471.
doi: 10.1016/j.nbd.2019.03.013. Epub 2019 Mar 18.

Beta bursts during continuous movements accompany the velocity decrement in Parkinson's disease patients

Affiliations

Beta bursts during continuous movements accompany the velocity decrement in Parkinson's disease patients

Roxanne Lofredi et al. Neurobiol Dis. 2019 Jul.

Abstract

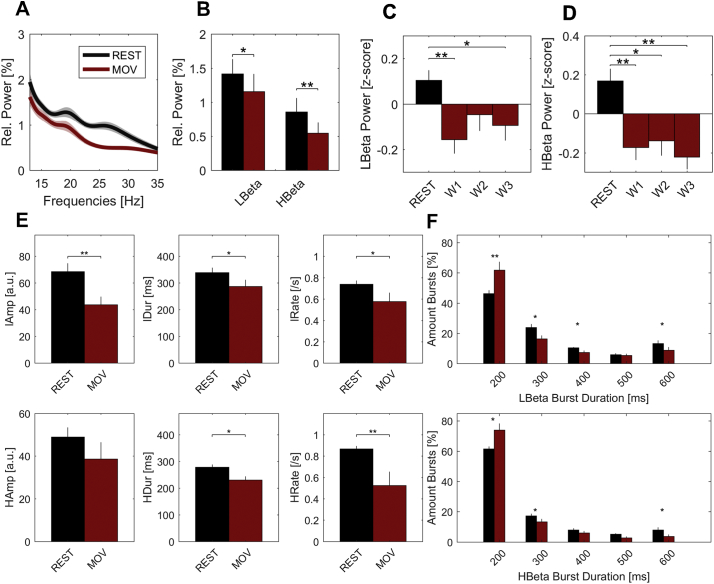
Bradykinesia is reported to correlate with subthalamic beta power (13-35 Hz) recorded at rest in Parkinson's disease (PD). Pilot studies suggest adaptive deep brain stimulation triggered by amplitude threshold crossings of beta activity defined at rest is effective. This is puzzling, given that beta is suppressed during repetitive movements when bradykinesia becomes apparent. Recently, increased beta power in PD has been linked to beta bursts. Here we investigate whether beta bursts also occur during repetitive movements and relate to progressive decrement in movement velocity. Therefore, subthalamic local field potentials were recorded in 12 PD patients off medication while performing 30s blocks of rotatory movements alternating with rest periods. Bursts were defined separately for the low (13-20 Hz) and high (20-35 Hz) beta band using thresholds defined at rest. As expected, velocity significantly decreased within movement blocks. Despite the sustained suppression of both beta sub-bands, bursts could still be detected during movement. Beta bursts were reduced in amplitude, duration and rate during movement with beta rate correlating best with beta power. A mixed-effects linear model revealed that percentage time spent in beta bursts predicted velocity decreases better than averaged power. This correlation was specific for the low beta band. Our results link beta bursts during movement to bradykinesia. This helps explain how beta activity may contribute to bradykinetic movement decrement even though mean beta power is reduced during movement. Moreover, our findings help explain the effectiveness of adaptive DBS triggered off beta bursts, even though these may be defined with respect to beta levels at rest.

Keywords: Beta bursts; Beta oscillations; Bradykinesia; Parkinson's disease; Subthalamic nucleus.


Figures

Fig. 1
Fig. 1
Schematic of task and examplary behavioural results. (A) Subjects were asked to continuously rotate a swivelling handle as quickly and with the largest amplitude possible for a block of 30 s (rotatory cycle in black). (B) Example movement trace from first movement block in case 1. (C) Each subject performed three blocks (B1–3) and velocity dropped across the blocks and also within the blocks which were each divided into three windows. Data averaged across subjects are shown. (D) Shown is an example movement trace from case 5. The movement velocity is shown in light grey. Peaks of movement velocity were interpolated (red trace), resulting in a continuous estimation of peak velocity in each 10s window (W1–3) of each block. Patients had 30 s rest between each block. To determine the change in velocity within each window we took the difference between the mean interpolated peak velocity over the 1 s at the beginning and end of each window. This is shown schematically for the first window of the first block in the figure. There was a stepwise decrease of movement velocity when averaging across movement blocks and across windows within a block. (For interpretation of the references to colour in this figure legend, the reader is referred to the web version of this article.)
Fig. 2
Fig. 2
Averaged power spectra and burst properties at rest and during movement. (A) Group average power spectra were estimated separately over movement (red) and rest periods (black). (B) When averaging over the low (13–20 Hz) and high (20–35 Hz) beta sub-bands, there was a significant power decrease in both beta sub-bands during movement. (C, D) Both low and high beta power were continuously suppressed when averaged over 10 s windows within movement blocks. (E) Group averaged data. Beta burst properties during movement (red bars) and rest (black bars) periods were compared separately for the low (upper panel) and high beta sub-bands (lower panel). There was a significant decrease in burst duration and rate during movement when compared to rest, in both beta sub-bands. Additionally, burst amplitude during movement was significantly decreased in the low beta band when compared to rest. (F) During movement, the percentage amount of short bursts (<200 ms) was higher. At rest, the amount of longer bursts was higher. Shaded areas in A and error lines indicate standard errors of the mean. Means and standard errors of the mean are shown. *P < .05; **P < .01. (For interpretation of the references to colour in this figure legend, the reader is referred to the web version of this article.)
Fig. 3
Fig. 3
Correlation between low beta bursting and decrease in peak velocity. (A) Example of the first 10 s (w1) in the first movement block (b1) from case 11 is shown. The peak velocity trace (red line, first row) is an interpolation of peaks of movement velocity (black line, first row) to give a continuous estimation. Note that in off-line analysis, the change in peak velocity within a given 10 s time window was assessed by averaging peak velocity over the first and last second (red shaded area) and subtracting the two values (mean peak velocity in first second – mean peak velocity in last second, here: 434–308 degrees/s.; see white lines). In the second row is shown the corresponding raw trace of the local field potential recording, filtered around the low beta band (13–20 Hz). The third row demonstrates the fluctuations of the low beta amplitude after wavelet transform. The burst threshold of this subject is shown as dotted grey line and bursting activity (with a minimum duration of 100 ms) is highlighted in light grey. Here, 34% of time is spent in low beta bursting, which is associated with an overall decrement across the whole 10s window. (B) Same but now for a window with sparse bursting throughout (3%) and maintained peak velocity. Shown are the first 10 s (w1) in the third movement bloc (b3) from case 9. (C) In red are labelled the two example cases when trials from all subjects (n = 108) are sorted by the change of peak velocity over 10 s of continuous movement. (D) Correlation plot showing the decrease in peak velocity over 10 s from all subjects as predicted by our statistical model on the x-axis and the original decrease in peak velocity over 10 s on the y-axis. Change in peak velocity over 10 s could be significantly (r = 0.498, P < .0001) predicted by time spent in low beta bursts, explaining 25% of the variance in peak velocity change across patients. Shown values are normalized. (For interpretation of the references to colour in this figure legend, the reader is referred to the web version of this article.)
Fig. 4
Fig. 4
Correlation between change in velocity and time in burst within and across subjects. (A) Shown are all measurements of change in velocity and time spent in low beta bursts within and across subjects as independent values. This shows a highly significant, negative correlation (R = –0.31, P = .004). (B) Shown are individual scatter plots of the change in velocity over ~10 s (y-axis, negative values indicate a decrease in velocity over time) and the percentage time spent in low beta bursting over the same ~10 s (x-axis). In 10/12 cases, there was a negative correlation (fitted regression line shown in red) between change in velocity and time spent in low beta bursts that was individually significant in 2/10 cases. In case 10 there was a positive correlation and in case 2 beta bursting was detected only in 2/9 assessed time windows which limits interpretability. Across patients, the regression slope between change in velocity and low beta bursting was −2.2 ± 0.96 (mean ± SE). (For interpretation of the references to colour in this figure legend, the reader is referred to the web version of this article.)
Supplementary Fig. 1
Localization of highest beta power.
Supplementary Fig. 2
Burst properties within movement blocks.

References

    1. Androulidakis A.G. Amplitude modulation of oscillatory activity in the subthalamic nucleus during movement. Eur. J. Neurosci. 2008;27:1277–1284. - PubMed
    1. Baker S.N., Olivier E., Lemon R.N. Coherent oscillations in monkey motor cortex and hand muscle EMG show task-dependent modulation. J. Physiol. 1997;501:225–241. - PMC - PubMed
    1. Benjamini Y., Hochberg Y. Controlling the false discovery rate: a practical and powerful approach to multiple testing. J. R. Stat. Soc. Ser. B. 1995;57:289–300.
    1. Bichsel O. Functionally separated networks for self-paced and externally-cued motor execution in Parkinson's disease: evidence from deep brain recordings in humans. Neuroimage. 2018;177:20–29. - PubMed
    1. Caire F., Ranoux D., Guehl D., Burbaud P., Cuny E. A systematic review of studies on anatomical position of electrode contacts used for chronic subthalamic stimulation in Parkinson's disease. Acta Neurochir. 2013;155:1647–1654. discussion 1654. - PubMed

Publication types