

Requirement for YAP1 signaling in myxoid liposarcoma
- PMID: 30898787
- PMCID: PMC6505681
- DOI: 10.15252/emmm.201809889
Requirement for YAP1 signaling in myxoid liposarcoma
Abstract
Myxoid liposarcomas (MLS), malignant tumors of adipocyte origin, are driven by the FUS-DDIT3 fusion gene encoding an aberrant transcription factor. The mechanisms whereby FUS-DDIT3 mediates sarcomagenesis are incompletely understood, and strategies to selectively target MLS cells remain elusive. Here we show, using an unbiased functional genomic approach, that FUS-DDIT3-expressing mesenchymal stem cells and MLS cell lines are dependent on YAP1, a transcriptional co-activator and central effector of the Hippo pathway involved in tissue growth and tumorigenesis, and that increased YAP1 activity is a hallmark of human MLS Mechanistically, FUS-DDIT3 promotes YAP1 expression, nuclear localization, and transcriptional activity and physically associates with YAP1 in the nucleus of MLS cells. Pharmacologic inhibition of YAP1 activity impairs the growth of MLS cells in vitro and in vivo These findings identify overactive YAP1 signaling as unifying feature of MLS development that could represent a novel target for therapeutic intervention.
Keywords: FUS‐DDIT3; Hippo pathway; YAP1; myxoid liposarcoma; verteporfin.
© 2019 The Authors. Published under the terms of the CC BY 4.0 license.
Conflict of interest statement
The authors declare that they have no conflict of interest.
Figures
- A
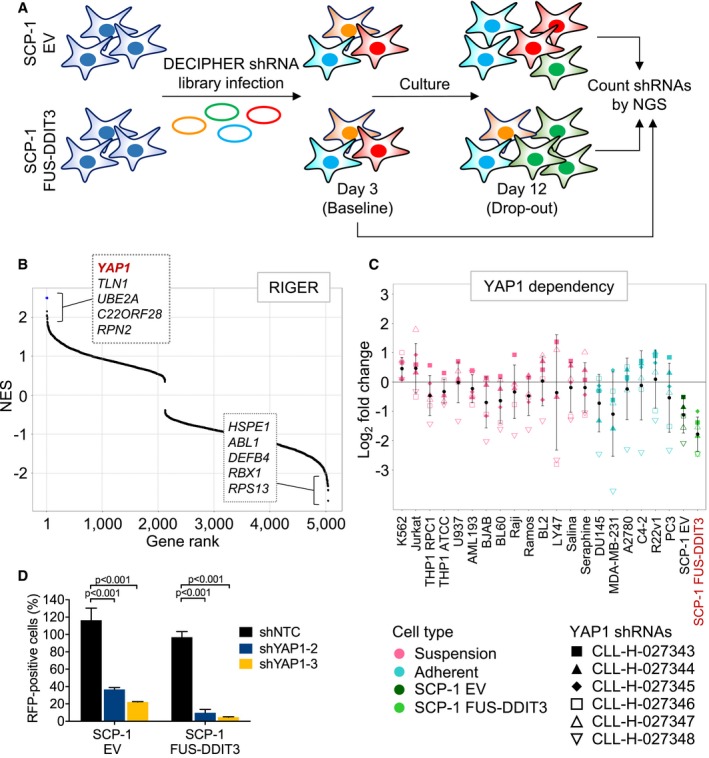
Schematic of RNAi screens. SCP‐1 cells expressing FUS‐DDIT3 or EV were transduced with Module 1 of the DECIPHER Pooled Lentiviral Human Genome‐Wide shRNA Library. Half of the cells were harvested on day 3 (baseline sample) and day 12 (drop‐out sample), respectively, and shRNA abundance was determined by next‐generation sequencing (NGS).
- B
RIGER analysis to identify genes that are preferentially essential in FUS‐DDIT3‐expressing SCP‐1 cells. EV‐transduced SCP‐1 cells and 20 FUS‐DDIT3‐negative cancer cell lines screened with the same shRNA library were used as reference set. Genes were ranked according to relative shRNA depletion, and YAP1 was identified as top FUS‐DDIT3‐specific essential gene. NES, normalized enrichment score.
- C
LFC change in YAP1 shRNA representation in 20 cancer cell lines and SCP‐1 cells transduced with FUS‐DDIT3 or EV. Black dots and error bars represent the mean ± SD of LFC scores for six independent shRNAs.
- D
Competition assays with SCP‐1 cells transduced with RFP‐labeled NTC or YAP1 shRNAs. Flow cytometric quantification of RFP‐positive cells on day 9 relative to day 3 showed that YAP1 knockdown was preferentially toxic to FUS‐DDIT3‐expressing cultures. Bars and error bars represent the mean ± SD of two independent experiments, two‐way ANOVA.
- A
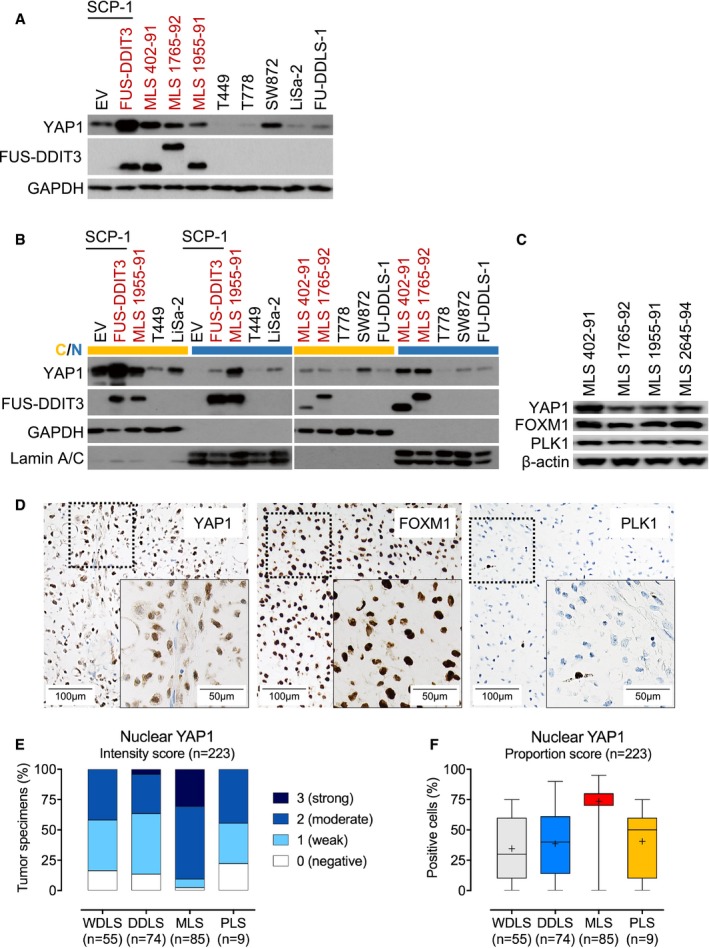
Expression of YAP1 in SCP‐1 cells transduced with FUS‐DDIT3 or EV and liposarcoma cell lines. One of at least two independent experiments with similar results is shown. FUS‐DDIT3‐expressing cell types are indicated in red.
- B
Expression of YAP1 in cytoplasmic (yellow) and nuclear (blue) fractions from SCP‐1 cells transduced with FUS‐DDIT3 or EV and liposarcoma cell lines. One of at least two independent experiments with similar results is shown. FUS‐DDIT3‐expressing cell types are indicated in red.
- C
Expression of FOXM1 and PLK1 in MLS cell lines. One of at least two independent experiments with similar results is shown.
- D
Strong nuclear expression of YAP1, FOXM1, and PLK1 in MLS patient samples (original magnification, ×10 [inset, ×20]).
- E
Intensity of nuclear YAP1 expression in liposarcoma patient samples. Immunoreactivity was assessed using a semi‐quantitative score (0, negative; 1, weak; 2, moderate; and 3, strong) defining the staining intensity in the positive control (hepatocellular carcinoma) as strong. Only tumors with at least moderate staining (semi‐quantitative score ≥ 2) and ≥ 30% YAP1‐positive cells were considered positive for the purposes of the study.
- F
Proportion of cells with nuclear YAP1 expression in liposarcoma patient samples. Boxes represent mean values and lower and upper quartiles. Whiskers represent minimum and maximum values.
- A
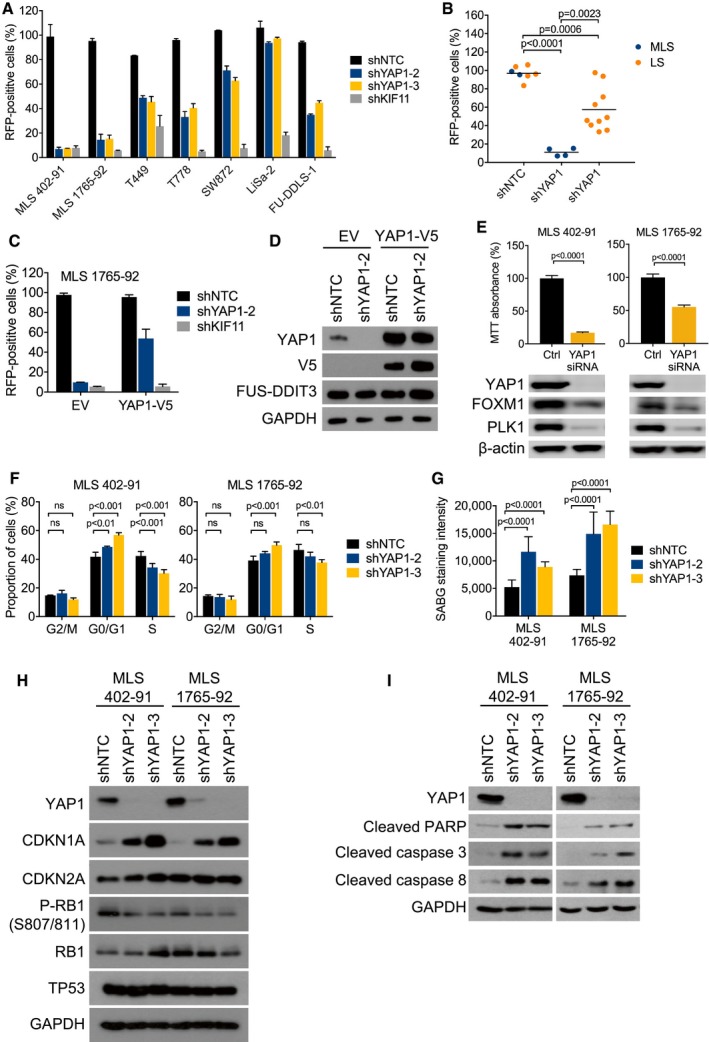
Competition assays with liposarcoma cell lines transduced with RFP‐labeled NTC or YAP1 shRNAs. Flow cytometric quantification of RFP‐positive cells on day 17 relative to day 3 showed that YAP1 knockdown was preferentially toxic to MLS cells. Bars and error bars represent the mean ± SD of two independent experiments.
- B
Aggregate data from competition assays shown in (A). Statistical significance was assessed using an unpaired t‐test. LS, non‐myxoid liposarcoma.
- C
Competition assays with MLS 1765‐92 cells transduced with an RFP‐labeled NTC shRNA or an RFP‐labeled shRNA against the YAP1 3′UTR following transduction with EV or the YAP1 coding sequence. Flow cytometric quantification of RFP‐positive cells on day 17 relative to day 3 showed that cell viability was rescued by expression of the shRNA‐resistant YAP1 cDNA. Bars and error bars represent the mean ± SD of two independent experiments.
- D
Expression of total and exogenous V5‐tagged YAP1 in MLS 1765‐92 cells shown in (C). One of at least two independent experiments with similar results is shown.
- E
Cell viability and expression of FOXM1 and PLK1 in MLS cell lines following siRNA‐mediated YAP1 knockdown. Bars and error bars represent the mean ± SD of three independent experiments, unpaired t‐test. The blots represent one of at least three independent experiments with similar results.
- F
Flow cytometric cell cycle analysis of MLS cell lines following shRNA‐mediated YAP1 knockdown. Bars and error bars represent the mean ± SD of three independent experiments, two‐way ANOVA; ns, not significant.
- G
Senescence‐associated β‐galactosidase (SABG) staining intensity in MLS cell lines following shRNA‐mediated YAP1 knockdown. Bars and error bars represent the mean ± SD of ten random microscopic fields, two‐way ANOVA.
- H
Expression of CDKN1A, CDKN2A, total and phosphorylated RB1, and TP53 in MLS cell lines following shRNA‐mediated YAP1 knockdown. One of at least two independent experiments with similar results is shown.
- I
Expression of cleaved PARP and cleaved caspase‐3/8 in MLS cell lines following shRNA‐mediated YAP1 knockdown. One of at least two independent experiments with similar results is shown.
- A
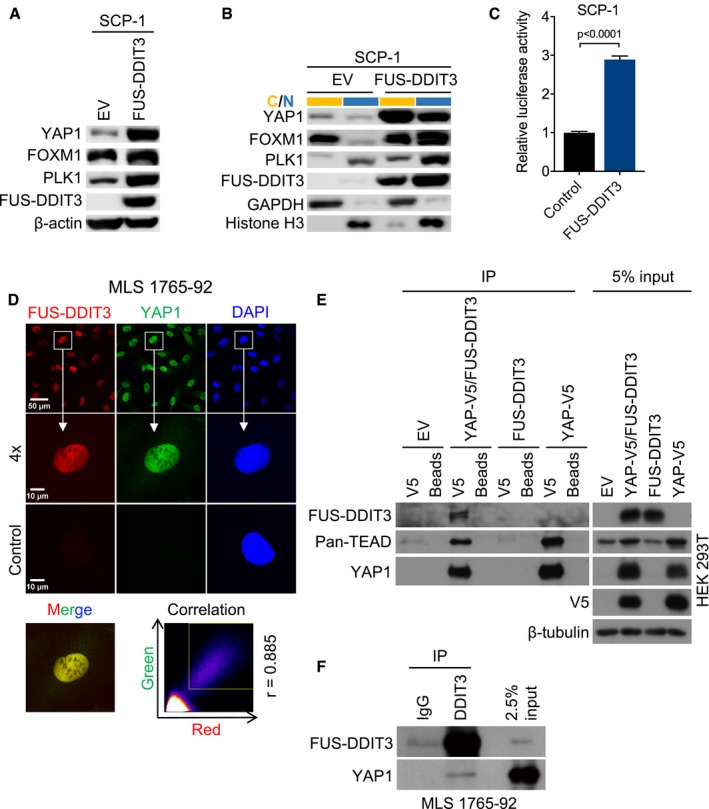
Expression of YAP1 and downstream effectors in SCP‐1 cells transduced with FUS‐DDIT3 or EV. One of at least three independent experiments with similar results is shown.
- B
Expression of YAP1 and downstream effectors in cytoplasmic (yellow) and nuclear (blue) fractions from SCP‐1 cells transduced with FUS‐DDIT3 or EV. One of at least two independent experiments with similar results is shown.
- C
YAP1‐responsive luciferase activity in SCP‐1 cells transduced with FUS‐DDIT3. Relative luciferase activity is displayed as fold change relative to control. Bars and error bars represent the mean ± SD of three independent experiments, unpaired t‐test.
- D
Localization of FUS‐DDIT3 and YAP1 in MLS 1765‐92. Nuclei were counterstained with DAPI. The original magnification was ×63, and images were zoomed in four times for co‐localization analysis. The correlation between red and green fluorescence was determined by Pearson coefficient analysis (square, area for signal acquisition).
- E
Co‐IP of transiently expressed FUS‐DDIT3 and YAP1 from HEK293T cells. V5‐tagged YAP1 was pulled down using an anti‐V5 antibody, and interacting proteins were detected by immunoblotting. One of at least two independent experiments with similar results is shown.
- F
Co‐IP of endogenous FUS‐DDIT3 and YAP1 from MLS 1765‐92 cells. FUS‐DDIT3 was pulled down using an anti‐DDIT3 antibody, and interacting proteins were detected by immunoblotting. One of at least two independent experiments with similar results is shown.
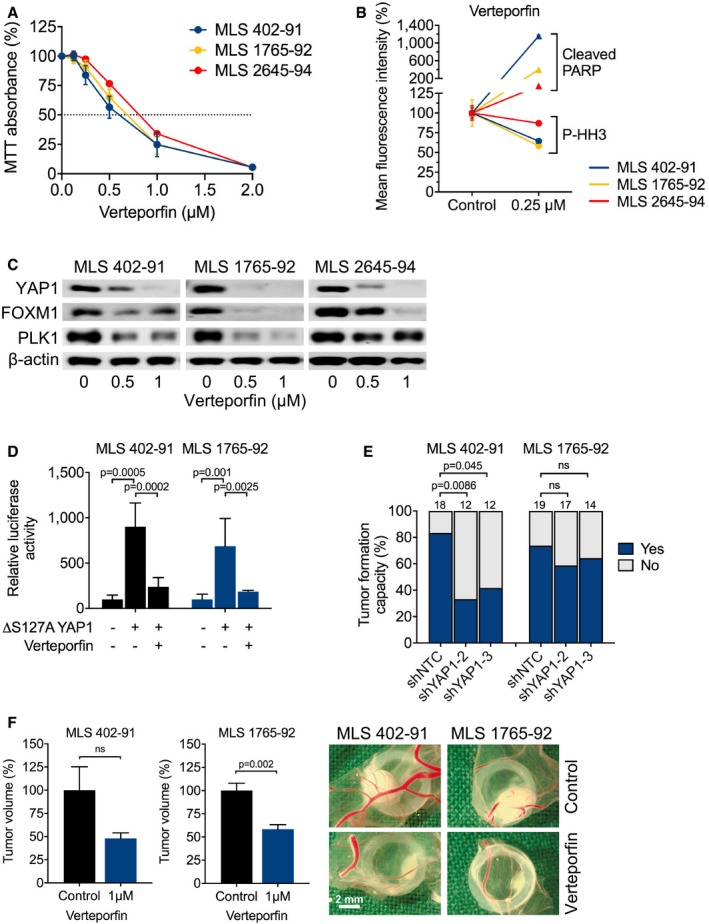
- A
Viability and proliferation of MLS 402‐91, MLS 1765‐92, and MLS 2645‐94 cells cultured in the presence of verteporfin. Data points and error bars represent the mean ± SEM of one representative experiment performed in quintuplicate.
- B
Flow cytometric analysis of apoptosis (cleaved PARP) and mitotic fraction (phosphorylated histone H3S10) in MLS cell lines cultured in the presence of 0.25 μM verteporfin. One of two independent experiments with similar results is shown.
- C
Expression of total YAP1 and downstream effectors (FOXM1 and PLK1) in MLS cell lines treated with 0.5 or 1 μM verteporfin for 15 h. One of at least three independent experiments with similar results is shown.
- D
YAP1‐responsive luciferase activity in MLS cell lines transfected with a constitutively active YAP1S127A mutant and treated with 1 μM verteporfin. Relative luciferase activity is displayed relative to control. Bars and error bars represent the mean ± SD of three independent experiments, unpaired t‐test.
- E
Tumor formation on chicken CAM of MLS cell lines following shRNA‐mediated YAP1 knockdown. The number of tumors is given above each bar, Fisher exact test; ns, not significant.
- F
Tumor growth on chicken CAM of MLS cell lines following treatment with 1 μM verteporfin. Shown are tumor volumes and representative photographs of tumors. Bars and error bars represent the mean ± SEM of at least four tumors, unpaired t‐test.
Similar articles
-
FUS::DDIT3 Fusion Protein in the Development of Myxoid Liposarcoma and Possible Implications for Therapy.Biomolecules. 2024 Oct 14;14(10):1297. doi: 10.3390/biom14101297. Biomolecules. 2024. PMID: 39456230 Free PMC article. Review.
-
Nuclear expression of FLT1 and its ligand PGF in FUS-DDIT3 carrying myxoid liposarcomas suggests the existence of an intracrine signaling loop.BMC Cancer. 2010 Jun 1;10:249. doi: 10.1186/1471-2407-10-249. BMC Cancer. 2010. PMID: 20515481 Free PMC article.
-
Exploiting WEE1 Kinase Activity as FUS::DDIT3-Dependent Therapeutic Vulnerability in Myxoid Liposarcoma.Clin Cancer Res. 2024 Nov 1;30(21):4974-4986. doi: 10.1158/1078-0432.CCR-24-1152. Clin Cancer Res. 2024. PMID: 39207225
-
Fusion protein-driven IGF-IR/PI3K/AKT signals deregulate Hippo pathway promoting oncogenic cooperation of YAP1 and FUS-DDIT3 in myxoid liposarcoma.Oncogenesis. 2022 Apr 22;11(1):20. doi: 10.1038/s41389-022-00394-7. Oncogenesis. 2022. PMID: 35459264 Free PMC article.
-
Vulvar Myxoid Liposarcoma and Well Differentiated Liposarcoma With Molecular Cytogenetic Confirmation: Case Reports With Review of Malignant Lipomatous Tumors of the Vulva.Int J Gynecol Pathol. 2015 Jul;34(4):390-5. doi: 10.1097/PGP.0000000000000170. Int J Gynecol Pathol. 2015. PMID: 25851712 Review.
Cited by
-
Metabolic landscapes in sarcomas.J Hematol Oncol. 2021 Jul 22;14(1):114. doi: 10.1186/s13045-021-01125-y. J Hematol Oncol. 2021. PMID: 34294128 Free PMC article. Review.
-
FUS::DDIT3 Fusion Protein in the Development of Myxoid Liposarcoma and Possible Implications for Therapy.Biomolecules. 2024 Oct 14;14(10):1297. doi: 10.3390/biom14101297. Biomolecules. 2024. PMID: 39456230 Free PMC article. Review.
-
FUS-DDIT3 Fusion Oncoprotein Expression Affects JAK-STAT Signaling in Myxoid Liposarcoma.Front Oncol. 2022 Feb 3;12:816894. doi: 10.3389/fonc.2022.816894. eCollection 2022. Front Oncol. 2022. PMID: 35186752 Free PMC article.
-
Selective targeting of KRAS-driven lung tumorigenesis via unresolved ER stress.JCI Insight. 2021 Apr 8;6(7):e137876. doi: 10.1172/jci.insight.137876. JCI Insight. 2021. PMID: 33830081 Free PMC article.
-
[Meeting report of the Bone, Joint and Soft Tissue Pathology Working Group : DGP Conference, 13 June 2019, Frankfurt].Pathologe. 2019 Dec;40(Suppl 3):388-391. doi: 10.1007/s00292-019-00672-z. Pathologe. 2019. PMID: 31659392 German. No abstract available.
References
-
- Antonescu CR, Tschernyavsky SJ, Decuseara R, Leung DH, Woodruff JM, Brennan MF, Bridge JA, Neff JR, Goldblum JR, Ladanyi M (2001) Prognostic impact of P53 status, TLS‐CHOP fusion transcript structure, and histological grade in myxoid liposarcoma: a molecular and clinicopathologic study of 82 cases. Clin Cancer Res 7: 3977–3987 - PubMed
Publication types
MeSH terms
Substances
LinkOut - more resources
Full Text Sources
Research Materials
