. 2019 May 3;294(18):7445-7459.
doi: 10.1074/jbc.RA118.006271. Epub 2019 Mar 21.

Leukodystrophy-associated POLR3A mutations down-regulate the RNA polymerase III transcript and important regulatory RNA BC200

Affiliations

Leukodystrophy-associated POLR3A mutations down-regulate the RNA polymerase III transcript and important regulatory RNA BC200

Karine Choquet et al. J Biol Chem. .

Abstract

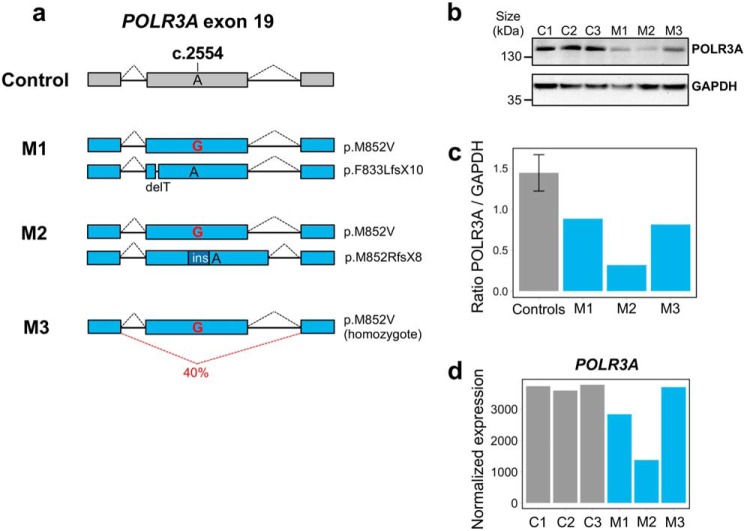
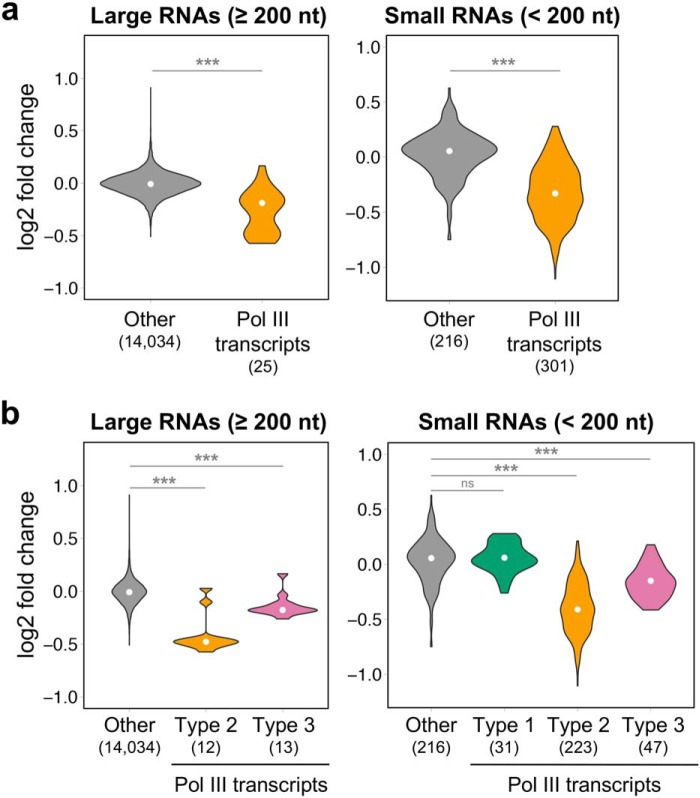
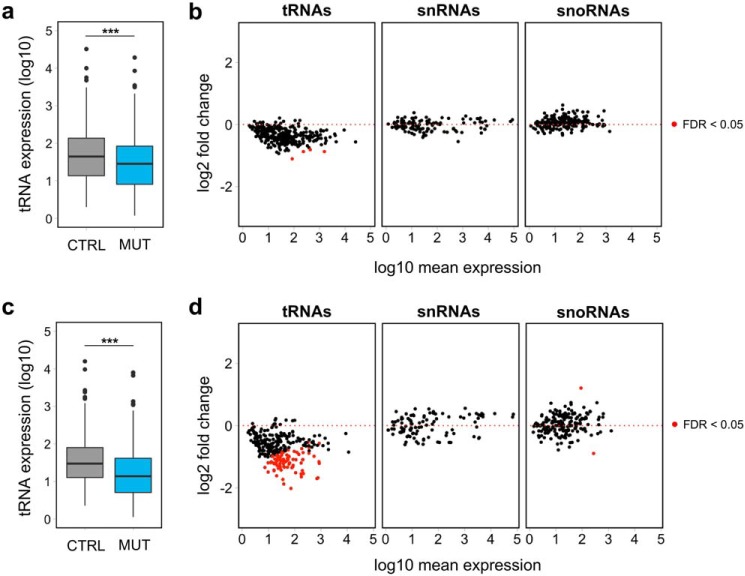
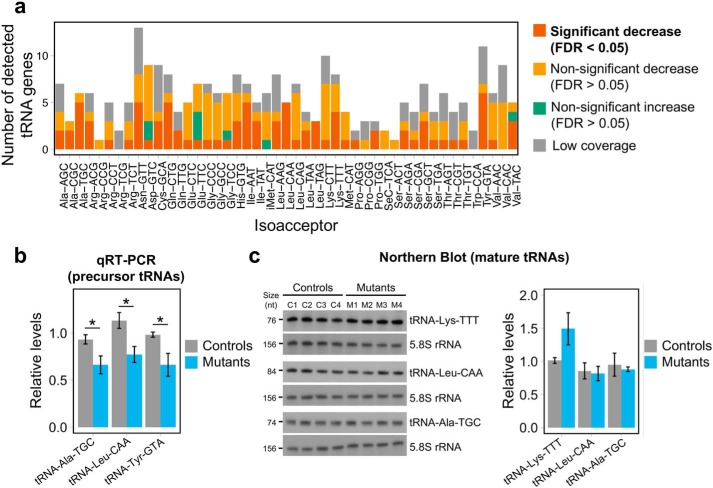
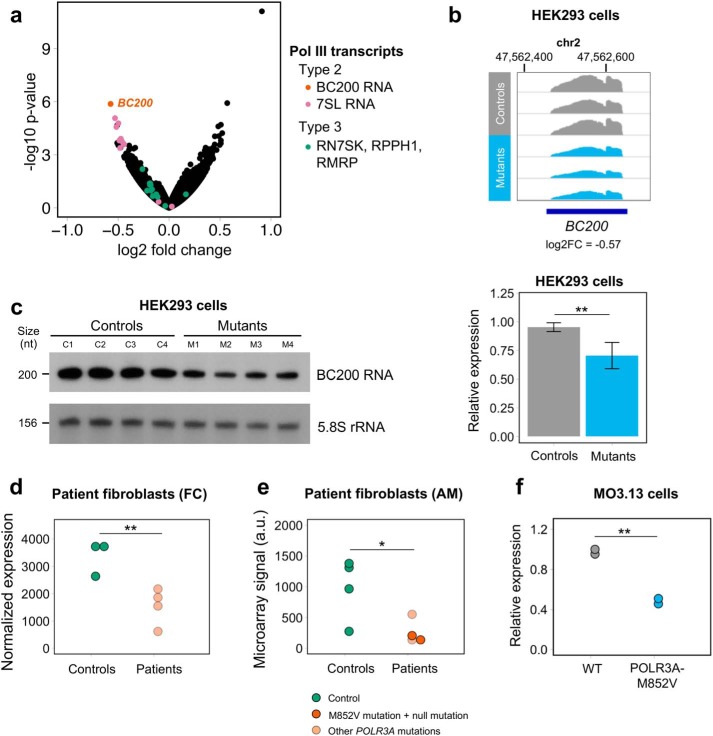
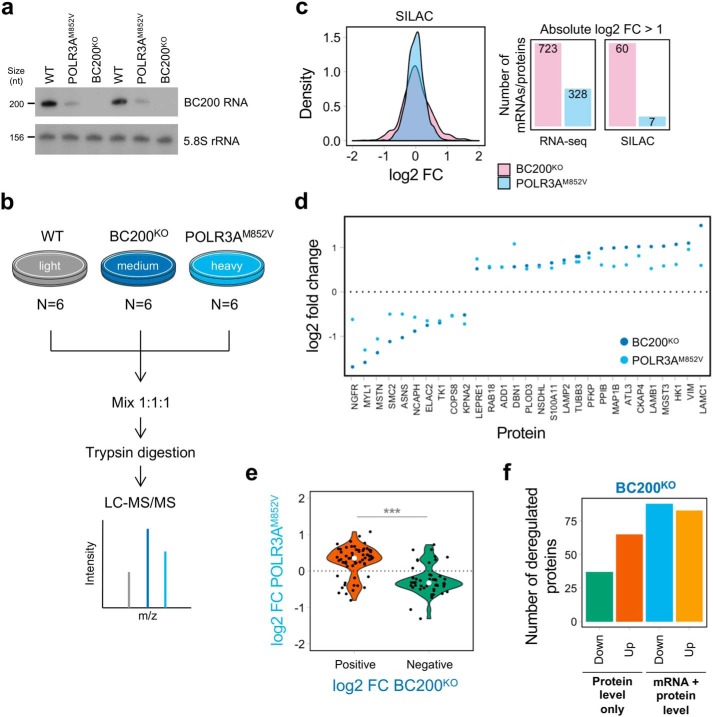
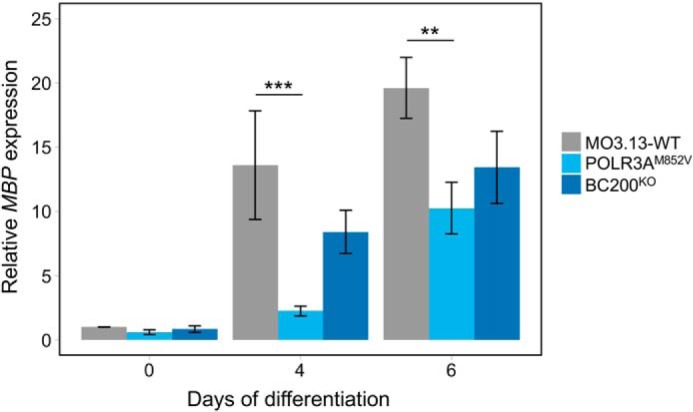
RNA polymerase III (Pol III) is an essential enzyme responsible for the synthesis of several small noncoding RNAs, a number of which are involved in mRNA translation. Recessive mutations in POLR3A, encoding the largest subunit of Pol III, cause POLR3-related hypomyelinating leukodystrophy (POLR3-HLD), characterized by deficient central nervous system myelination. Identification of the downstream effectors of pathogenic POLR3A mutations has so far been elusive. Here, we used CRISPR-Cas9 to introduce the POLR3A mutation c.2554A→G (p.M852V) into human cell lines and assessed its impact on Pol III biogenesis, nuclear import, DNA occupancy, transcription, and protein levels. Transcriptomic profiling uncovered a subset of transcripts vulnerable to Pol III hypofunction, including a global reduction in tRNA levels. The brain cytoplasmic BC200 RNA (BCYRN1), involved in translation regulation, was consistently affected in all our cellular models, including patient-derived fibroblasts. Genomic BC200 deletion in an oligodendroglial cell line led to major transcriptomic and proteomic changes, having a larger impact than those of POLR3A mutations. Upon differentiation, mRNA levels of the MBP gene, encoding myelin basic protein, were significantly decreased in POLR3A-mutant cells. Our findings provide the first evidence for impaired Pol III transcription in cellular models of POLR3-HLD and identify several candidate effectors, including BC200 RNA, having a potential role in oligodendrocyte biology and involvement in the disease.

Keywords: CRISPR/Cas; RNA polymerase III; RNA-seq; brain cytoplasmic 200 RNA (BCYRN1); leukodystrophy; myelin; oligodendrocyte; proteomics; transcription; transfer RNA (tRNA).


Conflict of interest statement

The authors declare that they have no conflicts of interest with the contents of this article

Figures

Figure 1.
Figure 1.
Characterization of POLR3A mutant clones obtained by CRISPR-Cas9. a, schematic of the genotypes in POLR3A mutant clones. Mutants M1 and M2 are compound-heterozygous for the M852V mutation and a deletion/insertion leading to a premature stop codon. The predicted protein change is indicated on the right. Mutant M3 is homozygous for the M852V mutation, but this results in partial exon 19 skipping at the mRNA level (see Fig. S2 for details). Exon and intron sizes are not at scale. b, POLR3A protein levels in control and mutant clones. GAPDH was used as a loading control. c, quantification of POLR3A protein levels normalized to GAPDH levels. The three controls were grouped together. d, POLR3A mRNA levels in control and mutant clones, quantified by RNA-seq. Mutant M3 has normal levels of POLR3A mRNA, suggesting exon 19 skipping does not affect mRNA stability. ins indicates insertion.
Figure 2.
Figure 2.
Pol III transcripts with type 2 internal promoter elements are decreased in POLR3A mutants. a, violin plots representing the distribution of expression log2 fold change (mutants/controls) for Pol III transcripts detected in rRNA-depleted RNA-seq (left) or small RNA-seq (right) compared with all other expressed genes in the respective datasets. b, same as a, but Pol III transcripts were partitioned into the three types of Pol III promoters. White points indicate the median. The number of transcripts in each group are indicated in parentheses below the graph. nt, nucleotide; ns, non-significant p-value. ***, p < 0.0001, Wilcoxon rank-sum test.
Figure 3.
Figure 3.
Differential expression analysis shows decreased tRNA precursor levels in mutants. a and c, distribution of normalized expression for all detected tRNAs in the small RNA-seq data, showing a general decrease in global tRNA levels in three mutants (MUT) (M1–M3) compared with three controls (CTRL) (C1–C3) (a) and biological triplicates of mutant M2 and control C3 (c). ***, p value < 0.0001, Wilcoxon rank-sum test. b and d, MA plots for all detected tRNAs, snRNAs, and snoRNAs in the small RNA-seq data, showing a general down-regulation of tRNA genes in three mutants (M1–M3) compared with three controls (C1–C3) (b) and biological triplicates of mutant M2 and control C3 (d). In contrast, snRNAs and snoRNAs are not affected by the POLR3A mutation, consistent with the fact that the majority is not synthesized by Pol III.
Figure 4.
Figure 4.
Global decrease in tRNA levels in POLR3A mutants. a, differential expression results from small RNA-seq for detected tRNA genes, categorized by isoacceptor families, showing that affected tRNAs belong to most families. The threshold for low tRNA coverage was mean normalized expression <10. b, expression of three tRNA genes measured by qRT-PCR in total RNA from three controls (C1–C3) and three mutants (M1–M3). tRNA gene expression was normalized to the stable genes SDHA, PSMB6, and COPS7A using the ΔΔCt method. For tRNA–Leu–CAA and tRNA–Tyr–GTA, primers are specific to the precursor form, and primers for tRNA–Ala–TGC do not discriminate between the precursor and mature forms at the sequence level. Groups were compared using a one-tailed Student's t test. c, left, expression of mature tRNAs measured by Northern blotting in four control (C1–C4) and four POLR3A mutant (M1–M4) HEK293 cell lines. The top blot was sequentially probed with BC200 RNA (Fig. 5c), tRNA–Lys–TTT, and 5.8S rRNA, which was used as a loading control for both figures. The middle and bottom blots were sequentially probed with tRNA–Leu–CAA or tRNA–Ala–TGC and 5.8S rRNA as a loading control. Transcript sizes in nucleotides (nt) are indicated on the left. Right, quantification of the Northern blotting. tRNA levels were normalized by 5.8S rRNA levels. *, p value < 0.05.
Figure 5.
Figure 5.
BC200 RNA is the top down-regulated Pol III transcript in multiple datasets of POLR3A mutant cells. a, volcano plot representing the results of differential expression analysis between HEK293 controls and mutants using rRNA-depleted RNA-seq (long RNA transcriptome). Expressed genes and pseudogenes encoding Pol III transcripts are shown in distinct colors based on their promoter type. b, Integrative Genomics Viewer screenshot of normalized BC200 expression in HEK293 controls and mutants. All samples are represented on the same scale (0–2900). c, left, expression of BC200 RNA measured by Northern blotting in four control and four POLR3A mutant HEK293 cell lines. Transcript sizes in nucleotides (nt) are indicated on the left. This blot was sequentially probed with BC200 RNA, tRNA–Lys–TTT (Fig. 4c), and 5.8S rRNA, which was used as a loading control for both figures. Right, quantification of the Northern blotting. BC200 RNA levels were normalized by 5.8S rRNA levels. The two groups were compared with a one-sided Student's t test. d, RNA-seq BC200 RNA normalized expression in primary fibroblasts from controls and French Canadian (FC) POLR3–HLD patients. e, microarray signal for a probe targeting the 3′ unique sequence of BC200 RNA in fibroblasts from controls and American (AM) POLR3–HLD patients. The two carriers of the M852V mutation are shown in darker orange. The two groups were compared with a one-tailed Student's t test. f, expression of BC200 RNA measured by qRT-PCR in the WT and POLR3A mutant MO3.13 cells. BC200 RNA expression was normalized to PMM1 and NDUSF2 using the ΔΔCt method. The two groups were compared with a one-tailed Student's t test. *, p value < 0.05; **, p < 0.01.
Figure 6.
Figure 6.
BC200 KO causes important changes at the proteome level in MO3.13 cells. a, Northern blotting showing decreased expression of BC200 RNA in POLR3AM852V cells compared with WT and complete absence of BC200 RNA in BC200KO cells. 5.8S rRNA was used as a loading control. The experiment was performed for biological duplicates. Transcript sizes in nucleotides (nt) are indicated on the left. b, overview of the SILAC protocol. Light refers to unlabeled amino acids; medium to Lys-4 and Arg-6, and heavy to Lys-8 and Arg-10. c, left, distribution of the SILAC log2 fold change for POLR3AM852V/WT and BC200KO/WT. Right, number of mRNAs/proteins with absolute log2 fold change of >1 in POLR3AM852V/WT and BC200KO/WT. More proteins have high fold changes in BC200KO (p value = 3.02 × 10⁻⁸, two-sample Kolmogorov-Smirnov test). d, log2 fold change for proteins that are differentially abundant (FDR <0.05, absolute log2 fold change >0.5) and move in the same direction in both mutant conditions compared with WT. e, distribution of log2 fold change in POLR3AM852V for proteins that showed statistically significant differences (FDR <0.05) in both mutant conditions and had a significant fold change in BC200KO (log2 FC >0.5). Proteins tend to change in the same direction in both conditions but with a lower effect size in POLR3AM852V compared with BC200KO. ***, p < 0.001, Wilcoxon rank-sum test. f, number of mRNA/protein pairs where the protein shows substantially greater fold changes than the mRNA in BC200KO versus WT (protein level only) and where the protein and mRNA have similar fold changes (mRNA + protein level). Each category is further separated into up- and down-regulated proteins in BC200KO. FC indicates fold change.
Figure 7.
Figure 7.
Decreased MBP expression in POLR3AM852V cells during MO3.13 differentiation. MO3.13-WT, POLR3AM852V, and BC200KO cells were cultured in serum-free medium supplemented with 100 nm PMA to induce their differentiation. Cells were collected, and RNA was extracted after 0 (untreated), 4, and 6 days of differentiation, and MBP mRNA expression was measured by qRT-PCR and normalized to the stable genes PMM1 and NDUFS2 using the ΔΔCt method. Data are represented as mean ± S.E. of four independent experiments. Conditions were compared with a two-way ANOVA and Tukey's multiple comparisons test. ***, p < 0.001; **, p < 0.01.

References

    1. Tetreault M., Choquet K., Orcesi S., Tonduti D., Balottin U., Teichmann M., Fribourg S., Schiffmann R., Brais B., Vanderver A., and Bernard G. (2011) Recessive mutations in POLR3B, encoding the second largest subunit of Pol III, cause a rare hypomyelinating leukodystrophy. Am. J. Hum. Genet. 89, 652–655 10.1016/j.ajhg.2011.10.006 - DOI - PMC - PubMed
    1. Thiffault I., Wolf N. I., Forget D., Guerrero K., Tran L. T., Choquet K., Lavallée-Adam M., Poitras C., Brais B., Yoon G., Sztriha L., Webster R. I., Timmann D., van de Warrenburg B. P., Seeger J., et al. (2015) Recessive mutations in POLR1C cause a leukodystrophy by impairing biogenesis of RNA polymerase III. Nat. Commun. 6, 7623 10.1038/ncomms8623 - DOI - PMC - PubMed
    1. Bernard G., Chouery E., Putorti M. L., Tétreault M., Takanohashi A., Carosso G., Clément I., Boespflug-Tanguy O., Rodriguez D., Delague V., Abou Ghoch J., Jalkh N., Dorboz I., Fribourg S., Teichmann M., et al. (2011) Mutations of POLR3A encoding a catalytic subunit of RNA polymerase Pol III cause a recessive hypomyelinating leukodystrophy. Am. J. Hum. Genet. 89, 415–423 10.1016/j.ajhg.2011.07.014 - DOI - PMC - PubMed
    1. Kevelam S. H., Steenweg M. E., Srivastava S., Helman G., Naidu S., Schiffmann R., Blaser S., Vanderver A., Wolf N. I., and van der Knaap M. S. (2016) Update on leukodystrophies: a historical perspective and adapted definition. Neuropediatrics 47, 349–354 10.1055/s-0036-1588020 - DOI - PubMed
    1. Wolf N. I., Vanderver A., van Spaendonk R. M., Schiffmann R., Brais B., Bugiani M., Sistermans E., Catsman-Berrevoets C., Kros J. M., Pinto P. S., Pohl D., Tirupathi S., Strømme P., de Grauw T., Fribourg S., et al. (2014) Clinical spectrum of 4H leukodystrophy caused by POLR3A and POLR3B mutations. Neurology 83, 1898–1905 10.1212/WNL.0000000000001002 - DOI - PMC - PubMed

Publication types