. 2019 Apr;29(4):590-601.
doi: 10.1101/gr.240952.118. Epub 2019 Mar 21.

The origins and evolution of chromosomes, dosage compensation, and mechanisms underlying venom regulation in snakes

Affiliations

The origins and evolution of chromosomes, dosage compensation, and mechanisms underlying venom regulation in snakes

Drew R Schield et al. Genome Res. 2019 Apr.

Abstract

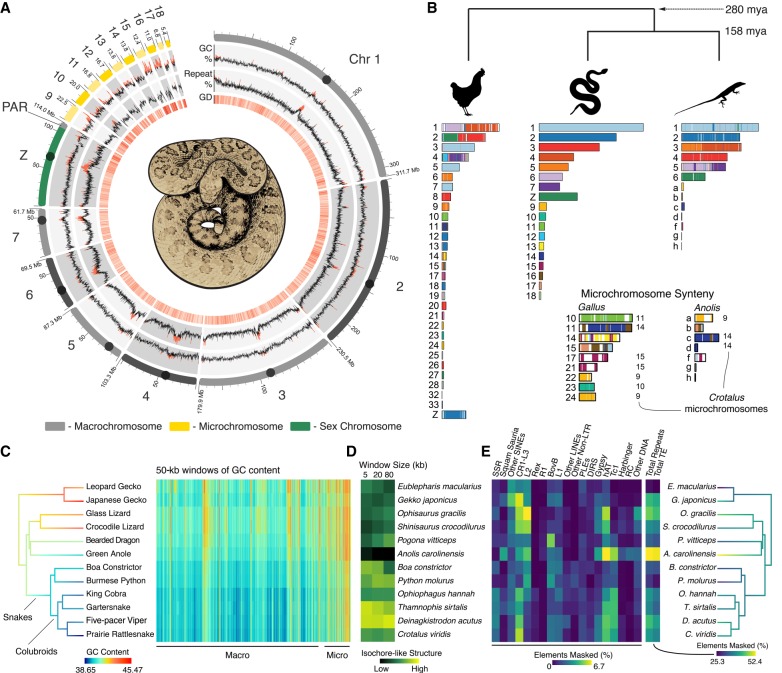
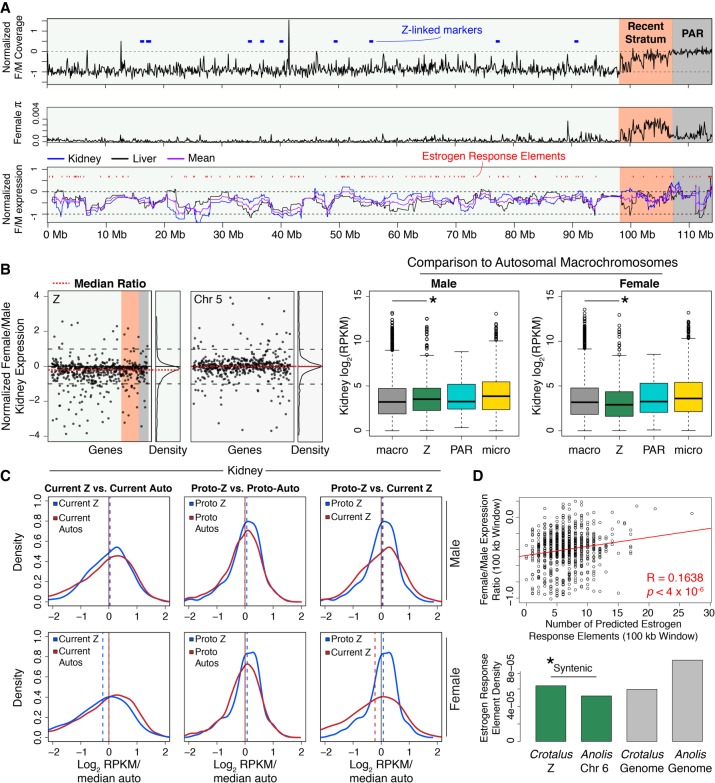
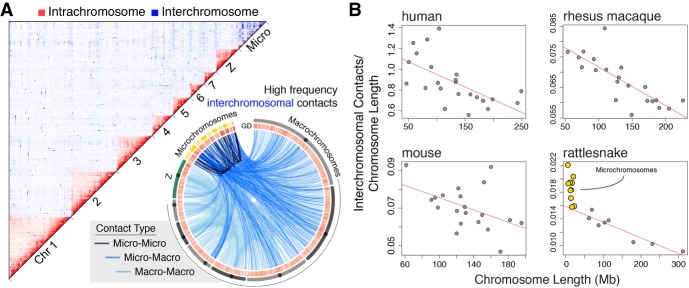
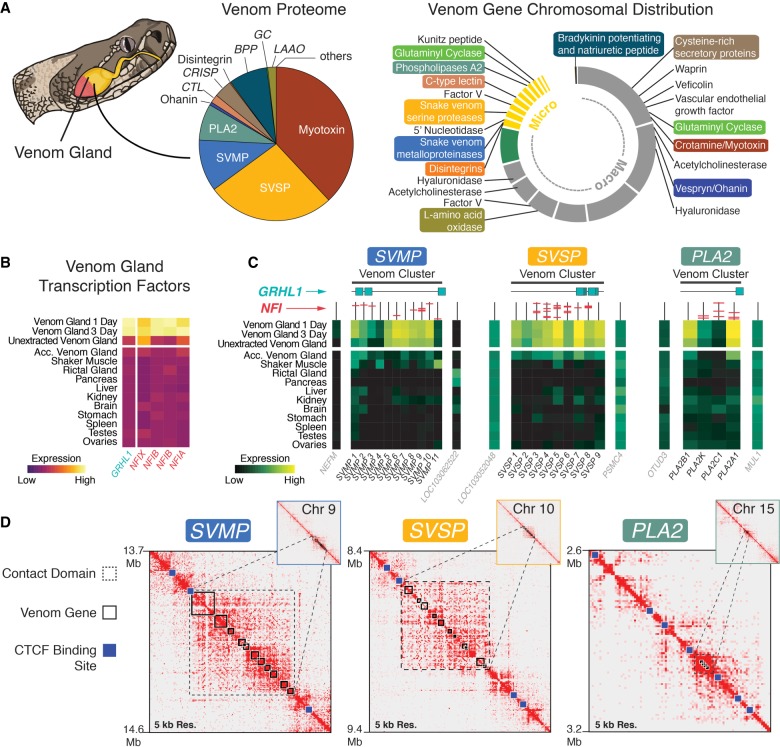
Here we use a chromosome-level genome assembly of a prairie rattlesnake (Crotalus viridis), together with Hi-C, RNA-seq, and whole-genome resequencing data, to study key features of genome biology and evolution in reptiles. We identify the rattlesnake Z Chromosome, including the recombining pseudoautosomal region, and find evidence for partial dosage compensation driven by an evolutionary accumulation of a female-biased up-regulation mechanism. Comparative analyses with other amniotes provide new insight into the origins, structure, and function of reptile microchromosomes, which we demonstrate have markedly different structure and function compared to macrochromosomes. Snake microchromosomes are also enriched for venom genes, which we show have evolved through multiple tandem duplication events in multiple gene families. By overlaying chromatin structure information and gene expression data, we find evidence for venom gene-specific chromatin contact domains and identify how chromatin structure guides precise expression of multiple venom gene families. Further, we find evidence for venom gland-specific transcription factor activity and characterize a complement of mechanisms underlying venom production and regulation. Our findings reveal novel and fundamental features of reptile genome biology, provide insight into the regulation of snake venom, and broadly highlight the biological insight enabled by chromosome-level genome assemblies.


Figures

Figure 1.
Figure 1.
Structure and content of the rattlesnake genome. (A) Regional variation in GC content, genomic repeat content, and gene density (for 100-kb windows) are shown on to-scale chromosomes, with centromere locations represented by circles; values above the genome-wide median are red. GD is gene density, or the number of genes per 100-kb window; higher density shown in darker red. (B) Synteny between rattlesnake, chicken, and anole genomes. Colors on chicken and anole chromosomes correspond with homologous rattlesnake sequence. Numbers to the right of chromosomes in the microchromosome inset represent rattlesnake microchromosomes syntenic with a given chicken or anole chromosomes for >80% of their length. Divergence times are shown in millions of years (mya). (C) Patterns of GC content from genome alignment of 12 squamate species, with tree branches colored according to genomic GC content. The heat map to the right depicts GC content in 50-kb windows of aligned sequence, with macro- and microchromosome regions labeled below. (D) Genomic GC isochore structure measured by the standard deviation in GC content among 5-, 20-, and 80-kb windows. (E) Genomic repeat content among 12 squamate species, with tree branches colored by total genomic repeat content.
Figure 2.
Figure 2.
The Z Chromosome of the rattlesnake and the evolution of snake dosage compensation. (A) Normalized (log2) female/male genomic read coverage, female π, and windowed (30-gene) log2 normalized female/male gene expression. Known Z-linked markers (Matsubara et al. 2006) shown as blue blocks. In expression plot, red marks represent predicted estrogen response elements (EREs). On each plot, the pseudoautosomal region (PAR) and Recent Stratum are highlighted in gray and orange, respectively. (B) Normalized (log2) female/male kidney gene expression per gene (black dots) across the Z shown next to expression on Chromosome 5, a similarly sized autosome (left panels). The red dashed lines are the median ratios, and relative density is shown to the right of each panel. Gene expression (log2 RPKM) distributions for male and female across macrochromosomes, Z Chromosome, the PAR, and microchromosomes (center and right panels). Asterisks depict significant differences between autosomal and Z Chromosome expression. (C) Density plots of current and inferred ancestral patterns of gene expression (log2 RPKM) in male and female kidney, respectively. Dashed lines represent the median of each distribution. (D) EREs drive partial dosage compensation. The correlation (red line) between predicted EREs and female/male gene expression ratios in 100-kb windows (top panel) is shown with evidence for accumulation of EREs on the rattlesnake Z (bottom panel). Each bar shows the density of EREs found in specific chromosomes (rattlesnake Z and Anolis 6 shown in green) and genome-wide (gray bars). The asterisk depicts a significantly greater density of EREs on the rattlesnake Z than Anolis Chromosome 6.
Figure 3.
Figure 3.
Genome-wide chromosomal contacts in the rattlesnake venom gland. (A) 2D heat map of intrachromosomal (red) and interchromosomal (blue) contacts among rattlesnake chromosomes (top). Locations of interchromosomal contacts (bottom), where light blue lines are contacts between macrochromosomes, medium blue lines are micro-to-macrochromosome contacts, and dark blue lines are contacts between microchromosomes. (B) Comparison of interchromosomal contacts normalized by chromosome length versus chromosome length for different species from Hi-C data sets. Red lines depict negative linear relationships for macrochromosomes.
Figure 4.
Figure 4.
Genomic context for venom gene regulation and production. (A) Pie chart of the venom proteome with relative abundance of venom families (redrawn from Saviola et al. 2015). Chromosomal location of venom gene families (right); colored labels correspond to families from the proteome chart. (B) Gene expression across tissues of transcription factors (TFs) significantly up-regulated in the venom gland. (C) Heat maps of gene expression across tissues for venom genes in each of the three focal venom gene families and the genes immediately flanking (i.e., outside of) each venom cluster (labeled in gray). Vertical lines above each gene represent their promoters, with predicted NFI binding sites shown in red. Predicted GRHL1 binding sites in venom clusters are shown as turquoise squares. (D) Hi-C heat maps showing contact domains (black dashed boxes), for the SVMP, SVSP, and PLA2 venom genes (solid black boxes). Blue squares are predicted CTCF binding sites. Values to the left of heat maps are start and end coordinates (in Mb) of each region, visualized at 5-kb resolution.

References

    1. Alföldi J, Di Palma F, Grabherr M, Williams C, Kong L, Mauceli E, Russell P, Lowe CB, Glor RE, Jaffe JD, et al. 2011. The genome of the green anole lizard and a comparative analysis with birds and mammals. Nature 477: 587–591. 10.1038/nature10390 - DOI - PMC - PubMed
    1. Backström N, Forstmeier W, Schielzeth H, Mellenius H, Nam K, Bolund E, Webster MT, Öst T, Schneider M, Kempenaers B. 2010. The recombination landscape of the zebra finch Taeniopygia guttata genome. Genome Res 20: 485–495. 10.1101/gr.101410.109 - DOI - PMC - PubMed
    1. Baker RJ, Bull JJ, Mengden GA. 1972. Karyotypic studies of thirty-eight species of North American snakes. Copeia 257 10.2307/1442486 - DOI
    1. Beckstette M, Homann R, Giegerich R, Kurtz S. 2006. Fast index based algorithms and software for matching position specific scoring matrices. BMC Bioinformatics 7: 389 10.1186/1471-2105-7-389 - DOI - PMC - PubMed
    1. Bellott DW, Skaletsky H, Cho TJ, Brown L, Locke D, Chen N, Galkina S, Pyntikova T, Koutseva N, Graves T. 2017. Avian W and mammalian Y chromosomes convergently retained dosage-sensitive regulators. Nat Genet 49: 387–394. 10.1038/ng.3778 - DOI - PMC - PubMed

Publication types

LinkOut - more resources