. 2019 May 7;9(5):1623-1632.
doi: 10.1534/g3.118.200840.

An Ultra-Dense Haploid Genetic Map for Evaluating the Highly Fragmented Genome Assembly of Norway Spruce (Picea abies)

Affiliations

An Ultra-Dense Haploid Genetic Map for Evaluating the Highly Fragmented Genome Assembly of Norway Spruce (Picea abies)

Carolina Bernhardsson et al. G3 (Bethesda). .

Abstract

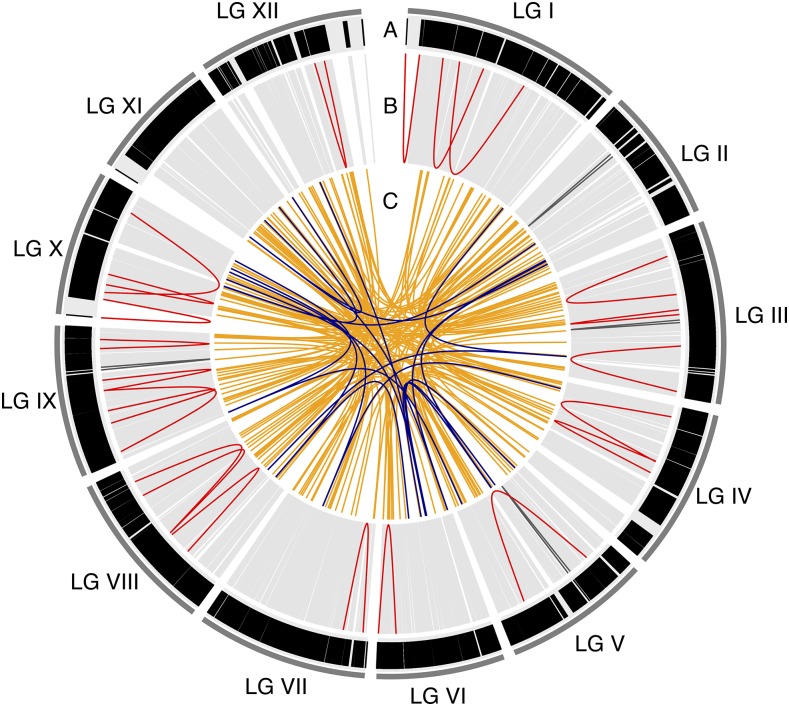
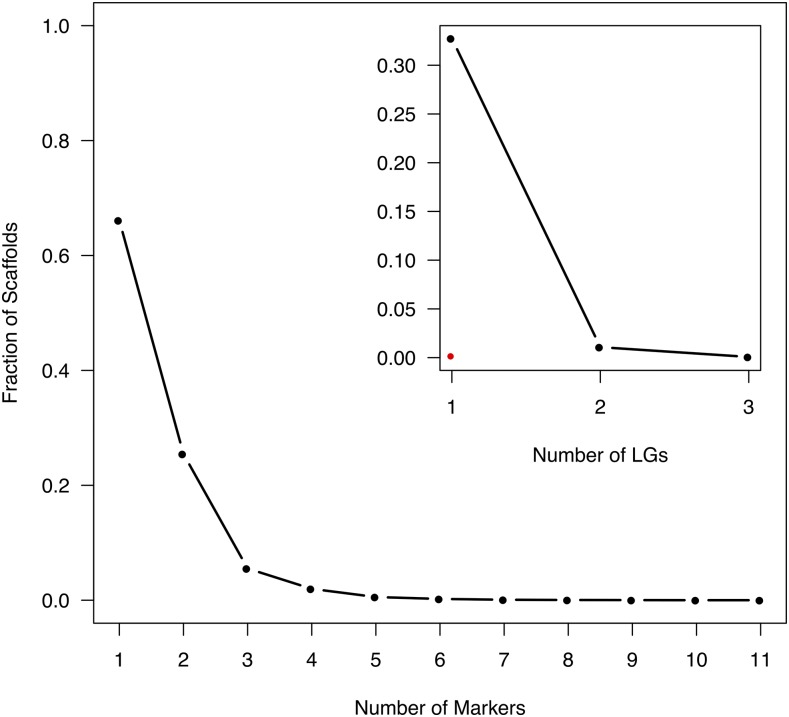
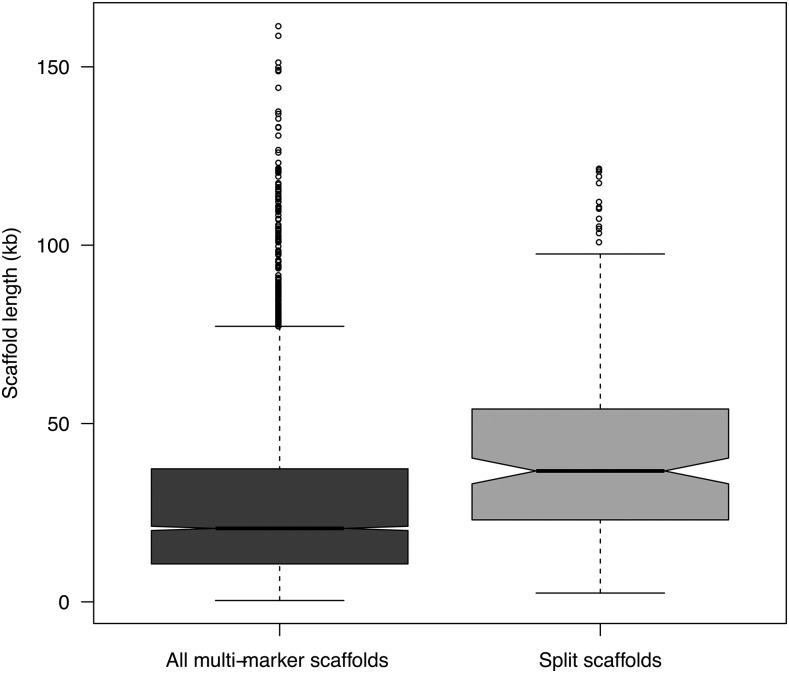
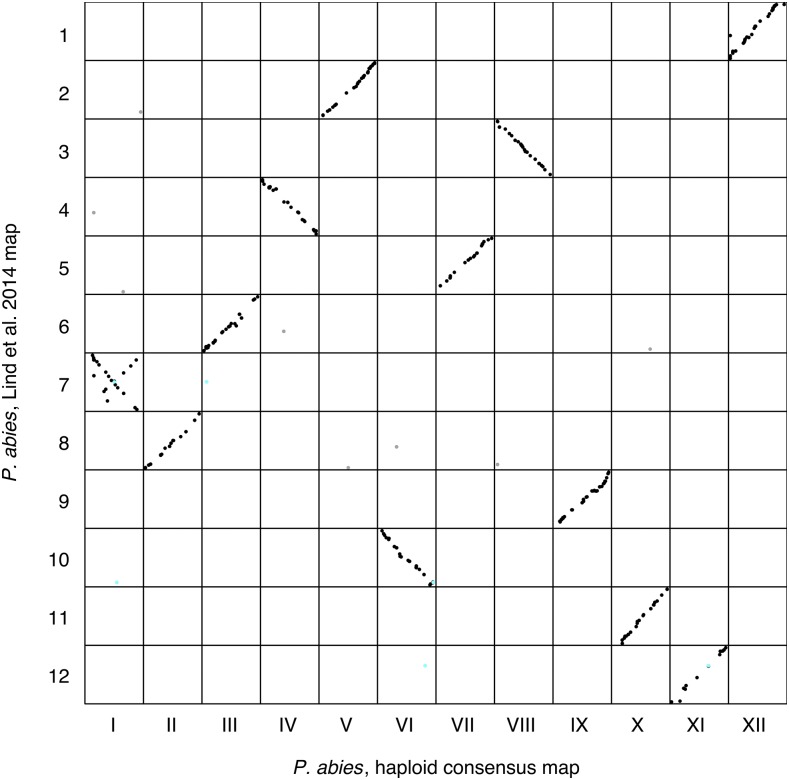
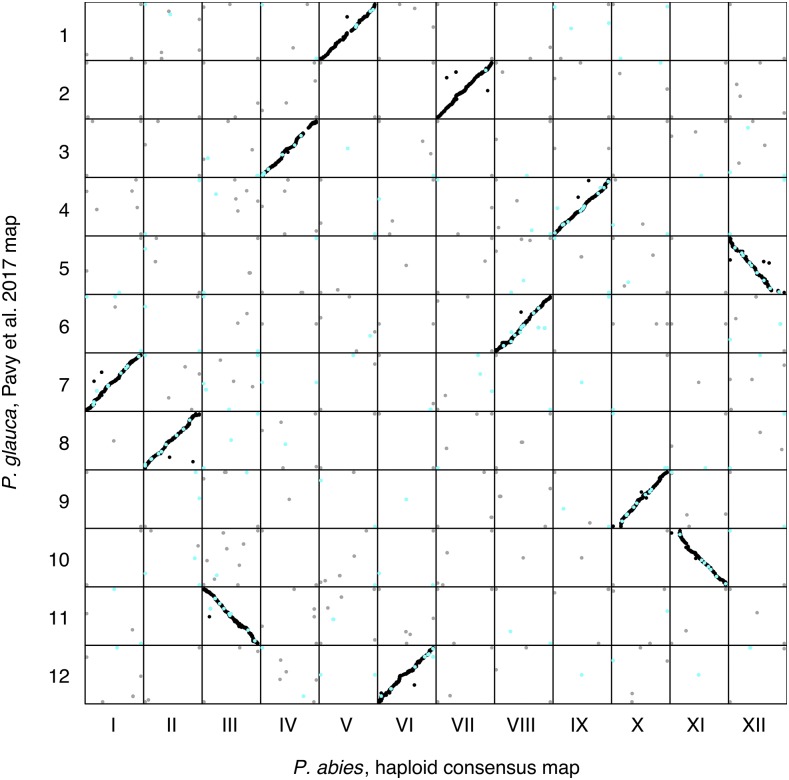
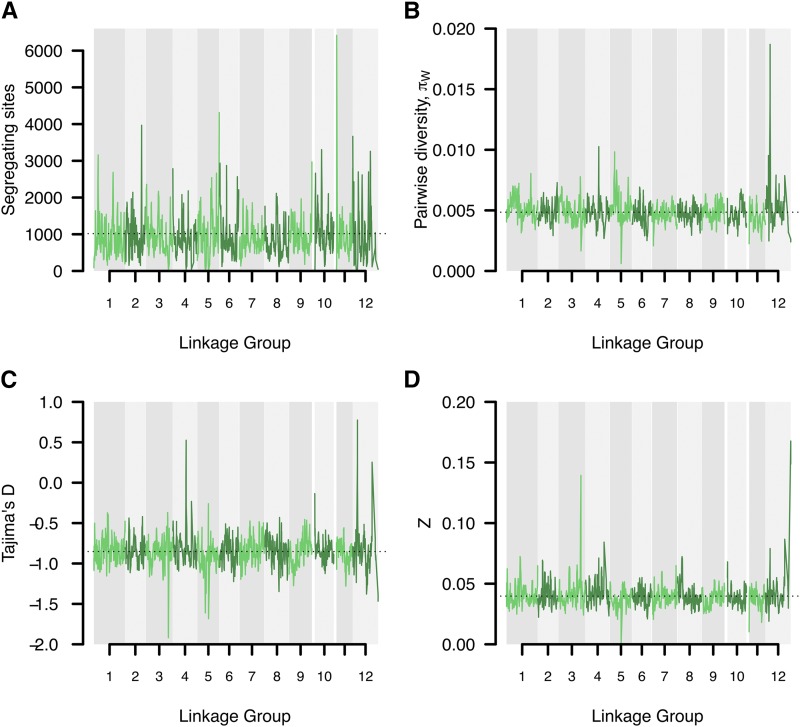
Norway spruce (Picea abies (L.) Karst.) is a conifer species of substanital economic and ecological importance. In common with most conifers, the P. abies genome is very large (∼20 Gbp) and contains a high fraction of repetitive DNA. The current P. abies genome assembly (v1.0) covers approximately 60% of the total genome size but is highly fragmented, consisting of >10 million scaffolds. The genome annotation contains 66,632 gene models that are at least partially validated (www.congenie.org), however, the fragmented nature of the assembly means that there is currently little information available on how these genes are physically distributed over the 12 P. abies chromosomes. By creating an ultra-dense genetic linkage map, we anchored and ordered scaffolds into linkage groups, which complements the fine-scale information available in assembly contigs. Our ultra-dense haploid consensus genetic map consists of 21,056 markers derived from 14,336 scaffolds that contain 17,079 gene models (25.6% of the validated gene models) that we have anchored to the 12 linkage groups. We used data from three independent component maps, as well as comparisons with previously published Picea maps to evaluate the accuracy and marker ordering of the linkage groups. We demonstrate that approximately 3.8% of the anchored scaffolds and 1.6% of the gene models covered by the consensus map have likely assembly errors as they contain genetic markers that map to different regions within or between linkage groups. We further evaluate the utility of the genetic map for the conifer research community by using an independent data set of unrelated individuals to assess genome-wide variation in genetic diversity using the genomic regions anchored to linkage groups. The results show that our map is sufficiently dense to enable detailed evolutionary analyses across the P. abies genome.

Keywords: Norway spruce; Picea abies; genetic map; genome assembly; sequence capture.


Figures

Figure 1
Figure 1
Circos plot of the consensus map. A) Marker distribution over the 12 linkage groups (LG I-LG XII). Each black vertical line represents a marker (21,056 in total) in the map and is displayed according to the marker positions in cM. Track B-C visualizes multi marker scaffolds, where each line is a pairwise position comparison of probe-markers from the same scaffold. B) Position comparisons of probe-markers from the same scaffold that are located on the same LG. Light gray lines indicate probe-markers that are located < 5cM from each other, dark gray lines indicate probe-markers located 5-10 cM apart and red lines indicate probe-markers >10 cM apart. C) Position comparisons of probe-markers from the same scaffold that are mapping to different LGs. Orange lines indicated probe-markers from the same scaffold split over 2 LGs, while dark blue lines indicated probe-markers split over 3 LGs.
Figure 2
Figure 2
Fraction of scaffolds that are being represented by 1-11 unique markers in the consensus map. Insert: Fraction of scaffolds that have multiple probe-markers (2-11) that are distributed over 1-3 linkage groups (inter-split scaffolds). Red dot indicate the fraction of scaffolds with multiple probe-markers which are positioned > 5cM apart on the same linkage group (intra-split scaffolds).
Figure 3
Figure 3
Box plot of scaffold lengths for all multi-marker scaffolds (dark gray box) and for scaffolds showing a split within or across LGs (light gray box). The split scaffolds are significantly longer than the multi-marker scaffolds in general (t = -7.70, df = 193.39, p-value = 7.00e-13).
Figure 4
Figure 4
Marker order comparison between Linkage Groups (LGs) from the haploid consensus map presented here and the Picea abies map from Lind et al. (2014). Consensus LG I - LG XII are located on the x-axis from left to right. Lind et al. LG 1 - LG 12 are located on the y-axis from top to bottom. Each dot represents a marker comparison from the same scaffold, where black coloration represents the LG where the majority of marker comparisons are mapped. Gray coloration represents markers mapping to a different LG compared to the majority of markers. Turquoise coloration represents markers located on split scaffolds, which are indicative of assembly errors.
Figure 5
Figure 5
Marker order comparison of Linkage Groups (LGs) between the Picea abies haploid consensus map presented here and the Picea glauca map from Pavy et al. (2017). Consensus LG I - LG XII are located on the x-axis from left to right. Pavy et al. LG 1 - LG 12 are located on the y-axis from top to bottom. Each dot represents a marker comparison from the same scaffold, where black coloration represents markers mapping to the same LG in the two species, gray coloration represents markers mapping to different LGs. Turquoise coloration represents markers located on split scaffolds, indicating an assembly error.
Figure 6
Figure 6
Sliding window analysis of neutrality statistics. Analyses were performed using 10 cM windows with 1 cM incremental steps along the consensus map linkage groups and visualized using coloring alternates between adjacent LGs. A) Number of segregating sites. Dashed horizontal line indicates the overall average of 1017. B) Pairwise nucleotide diversity (π). Dashed horizontal line indicates the overall average of 0.005. C) Tajima’s D. Dashed horizontal line indicates the overall average of -0.852. D) Linkage disequilibrium Zn scores. Dashed horizontal line indicates the overall average of 0.040.

References

    1. Baison J., Vidalis A., Zhou L., Chen Z.-Q., Li Z., et al. , 2018. Association mapping identified novel candidate loci affecting wood formation in Norway spruce. bioRxiv. 10.1101/292847 - DOI - PMC - PubMed
    1. Bartholomé J., Mandrou E., Mabiala A., Jenkins J., Nabihoudine I., et al. , 2015. High-Resolution Genetic Maps of Eucalyptus Improve Eucalyptus Grandis Genome Assembly. New Phytol. 206: 1283–1296. 10.1111/nph.13150 - DOI - PubMed
    1. Cartwright D. A., Troggio M., Velasco R., Gutin A., 2007. Genetic Mapping in the Presence of Genotyping Errors. Genetics 176: 2521–2527. 10.1534/genetics.106.063982 - DOI - PMC - PubMed
    1. Danecek P., Auton A., Abecasis G., Albers C. A., Banks E., et al. , 2011. The Variant Call Format and VCFtools. Bioinformatics 27: 2156–2158. 10.1093/bioinformatics/btr330 - DOI - PMC - PubMed
    1. De La Torre A. R., Birol I., Bousquet J., Ingvarsson P. K., Jansson S., et al. , 2014. Insights into Conifer Giga-Genomes. Plant Physiol. 166: 1724–1732. http://www.plantphysiol.org/content/166/4/1724.short. 10.1104/pp.114.248708 - DOI - PMC - PubMed

Publication types

Substances

LinkOut - more resources