. 2019 Mar 22;363(6433):1345-1349.
doi: 10.1126/science.aat8515.

High-fructose corn syrup enhances intestinal tumor growth in mice

Affiliations

High-fructose corn syrup enhances intestinal tumor growth in mice

Marcus D Goncalves et al. Science. .

Abstract

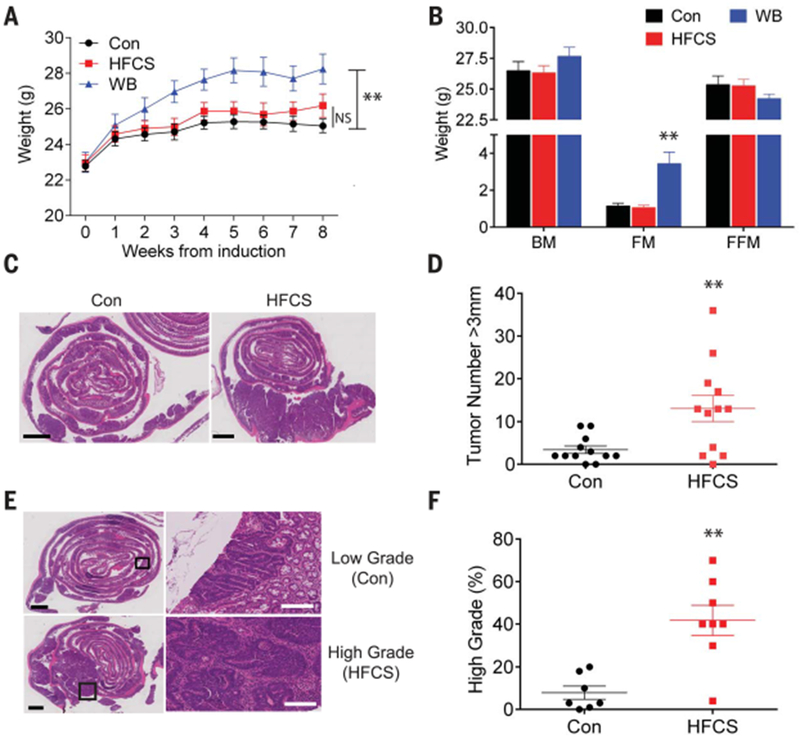
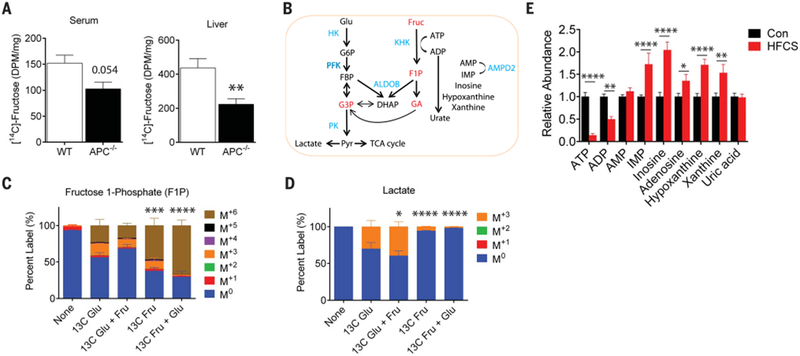
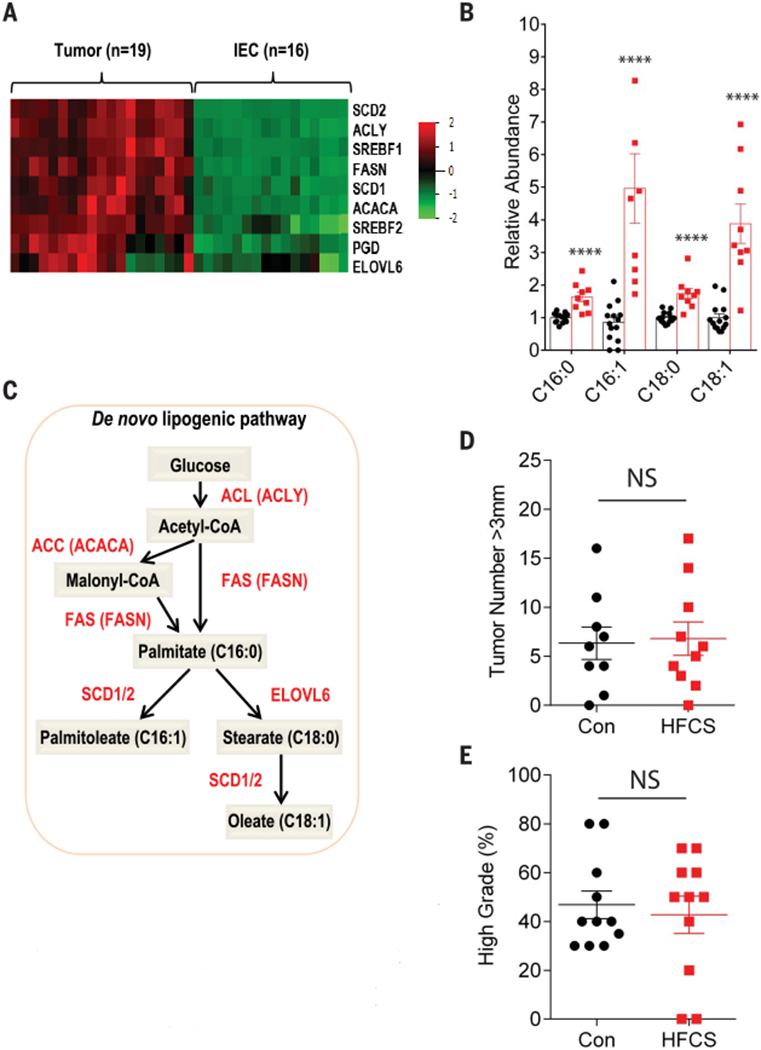
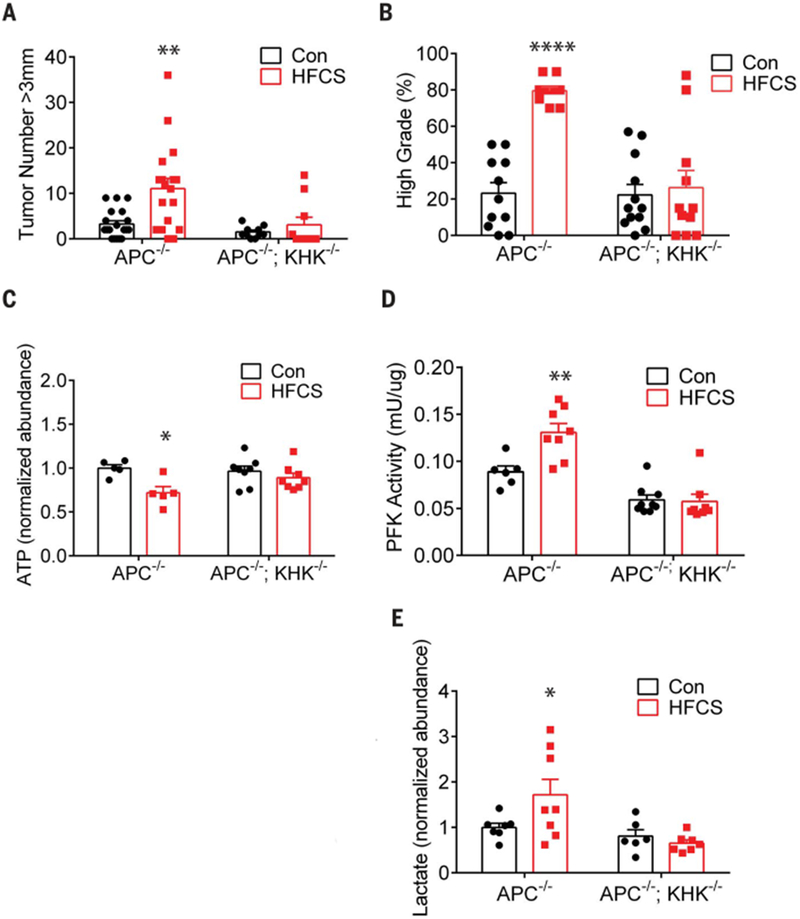
Excessive consumption of beverages sweetened with high-fructose corn syrup (HFCS) is associated with obesity and with an increased risk of colorectal cancer. Whether HFCS contributes directly to tumorigenesis is unclear. We investigated the effects of daily oral administration of HFCS in adenomatous polyposis coli (APC) mutant mice, which are predisposed to develop intestinal tumors. The HFCS-treated mice showed a substantial increase in tumor size and tumor grade in the absence of obesity and metabolic syndrome. HFCS increased the concentrations of fructose and glucose in the intestinal lumen and serum, respectively, and the tumors transported both sugars. Within the tumors, fructose was converted to fructose-1-phosphate, leading to activation of glycolysis and increased synthesis of fatty acids that support tumor growth. These mouse studies support the hypothesis that the combination of dietary glucose and fructose, even at a moderate dose, can enhance tumorigenesis.


Figures

Fig. 1.
Fig. 1.. HFCS enhances intestinal tumor growth in APC-deficient mice independent of obesity.
(A) Mean weight of untreated APC−/− mice (Con), APC−/− mice treated with a daily oral gavage of HFCS, and APC−/− mice fed with unlimited HFCS in drinking water bottle (WB) following the induction of intestinal tumors. n = 12. (B) Body composition of APC−/− mice in Con (n = 8), HFCS (n = 6), and WB (n = 9) groups were measured after 8 weeks of treatment using magnetic resonance. BM, body mass; FM, fat mass; FFM, fat-free mass. (C) H&E (hematoxylin and eosin) staining of the distal small intestine from APC−/− mice treated with Con or HFCS via daily oral gavage for 8 weeks. Black bar indicates 2 mm. (D) The size of each tumor (diameter) in the intestine was determined in whole-mount tissue after methylene blue staining, using a dissecting microscope. Data represent the number of tumors over 3 mm in diameter in Con and HFCS-treated APC−/− mice. n = 12. (E) Representative pathologic grading of intestinal sections from Con and HFCS-treated APC−/− mice. Black bar indicates 2 mm. White bar indicates 200 μm. (F) Percentage of high-grade lesions from Con (n = 7) and HFCS-treated (n = 8) APC−/− mice. (A) and (B): Two-way analysis of variance (ANOVA) followed by Holm-Sidak post-test for multiple comparisons; (D) and (F): Student’s t test; NS: not significant. **P<0.01. All data represent means ± SEM.
Fig. 2.
Fig. 2.. Intestinal tumors from APC-deficient mice facilitate glycolysis by using both glucose and fructose.
(A) The amount of radioactivity in the serum (left) and liver (right) 20 min after an oral bolus of HFCS that contained U-[14C]-fructose tracer in wild-type (WT) (n = 4) and tumor-bearing APC−/− mice (n = 6). Radioactivity amount is presented as disintegrations per minute (DPM) per microliter (serum) or per microgram of protein input (liver). WT and APC−/− compared by Student’s t test, **P < 0.01. (B) Schematic depicting key enzymes and metabolites in glycolysis, fructolysis, and purine salvage pathways. Red indicates key fructose metabolites; blue indicates enzymes. Glu, glucose; Fruc, fructose; G6P, glucose 6-phosphate; FBP, fructose 1,6-bisphosphate; G3P, glyceraldehyde 3-phosphate; Pyr, pyruvate; F1P, fructose 1-phosphate; GA, glyceraldehyde; DHAP, dihydroxyacetone phosphate; ATP, adenosine triphosphate; ADP, adenosine diphosphate; AMP, adenosine monophosphate; IMP, inosine monophosphate; HK, hexokinase; PFK, phosphofructokinase; PK, pyruvate kinase; ALDOB, aldolase B; KHK, ketohexokinase; AMPD2, AMP deaminase 2. (C) Percent labeling of fructose 1-phosphate and (D) lactate following a 10-min ex vivo incubation with 10 mM U-[13C]-glucose, 10 mM U-[13C]-glucose with 10 mM fructose, 10 mM U-[13C]-fructose, and 10 mM U-[13C]-fructose with 10 mM glucose. The isotopic labeling of each metabolite is indicated by the M+# designation indicated in the legend where the # represents how many [12C] were replaced with [13C]. For example, the M+3 species for fructose 1-phosphate has the chemical formula 13C312C3H13O9P. n = 3 to 4 per group. Two-way ANOVA with Holm-Sidak post-test compared to the U-[13C]-glucose condition. *P < 0.05, ***P < 0.001, ****P < 0.0001, 13C Glu, U-[13C]-glucose; 13C Fru, U-[13C]-fructose. (E) Relative abundance of key metabolites in the adenine purine salvage pathway. Con (n = 14), HFCS (n = 9). Two-way ANOVA with Holm-Sidak post-test *P < 0.05, **P < 0.01, ***P < 0.001, ****P < 0.0001. All data represent means ± SEM.
Fig. 3.
Fig. 3.. HFCS treatment accelerates de novo fatty acid synthesis in intestinal tumors from APCdeficient mice.
(A) Heatmap depicting the relative expression of the indicated genes involved in fatty acid synthesis from APC−/− tumors (n = 16) and intestinal epithelial cells (IECs, n = 16) using RNA-seq data. (B) Relative abundance of saturated and unsaturated 16- and 18-carbon fatty acid species in APC−/− tumors treated daily with water (Con, n = 14) or HFCS (n = 9). Groups compared by Student’s t test with correction for multiple comparisons using the Holm-Sidak method. ****P < 0.0001. (C) Schematic depicting key enzymes, genes, and metabolites in the de novo lipogenesis pathway. Red, enzyme name; red in parentheses, gene name. (D) APC−/−; FASN−/− mice were treated with a daily oral gavage containing water (Con, n = 9) or HFCS (n = 10) starting the day after tamoxifen injection and killed at 8 weeks. The size of each tumor (diameter) in the intestine was determined in whole-mount tissue after methylene blue staining, using a dissecting microscope. Data represent the number of tumors >3 mm in diameter in Con and HFCS-treated mice. Groups compared by Student’s t test. NS, not significant. (E) Percentage of high-grade tumors (n = 11 per group) from Con and HFCS-treated APC−/−; FASN−/− mice. Student’s t test. NS, not significant. All data represent means ± SEM.
Fig. 4.
Fig. 4.. KHK deletion abolishes tumor phenotypes in APC-deficient mice treated with HFCS.
(A) The size of each tumor (diameter) in the intestine was determined in wholemount tissue after methylene blue staining, using a dissecting microscope. Data represent the number of tumors >3 mm in diameter in Con (n = 19) and HFCS-treated (n = 18) APC−/− and APC−/−; KHK−/− mice (n = 10 per group). Groups compared by two-way ANOVA with Holm-Sidak post-test. **P < 0.01. (B) Percentage of high-grade tumors from Con (n = 11) and HFCS-treated (n = 10) APC−/− and APC−/−;KHK−/− mice (Con n = 12, HFCS n = 11). Groups compared by two-way ANOVA with Holm-Sidak post-test. ****P < 0.0001. (C) Normalized abundance of ATP in tumors from APC−/− (n = 5 per group) and APC−/−; KHK−/− (n = 8 per group) mice treated ex vivo with and without 10 mM HFCS for 10 min. Two-way ANOVA with Holm-Sidak post-test. *P < 0.05. (D) Normalized phosphofructokinase (PFK) activity (mU/μg) in tumors from APC−/− (Con n = 6, HFCS n = 8) and APC−/−; KHK−/− (Con n = 9, HFCS n = 8) mice treated for 8 weeks. Two-way ANOVA with Holm-Sidak post-test. **P < 0.01. (E) Normalized abundance of lactate in tumors from APC−/− (Con n = 7, HFCS n = 8) and APC−/−; KHK−/− (Con n = 6, HFCS n = 7) mice treated ex vivo with and without 10 mM HFCS for 10 min. Two-way ANOVA with Holm-Sidak post-test. *P < 0.05. All data represent means ± SEM.

References

    1. Malik VS, Schulze MB, Hu FB, Am. J. Clin. Nutr 84, 274–288 (2006). - PMC - PubMed
    1. Hodge AM, Bassett JK, Milne RL, English DR, Giles GG, Public Health Nutr. 21, 1618–1626 (2018). - PMC - PubMed
    1. Tappy L, Lê KA, Physiol. Rev 90, 23–46 (2010). - PubMed
    1. Singh GM et al., PLOS ONE 10, e0124845 (2015). - PMC - PubMed
    1. Siegel RL, Miller KD, Jemal A, JAMA 318, 572–574 (2017). - PMC - PubMed

Publication types

Substances