. 2019 Mar 21;10(1):1307.
doi: 10.1038/s41467-019-09014-2.

DNA damage-induced PARP1 activation confers cardiomyocyte dysfunction through NAD+ depletion in experimental atrial fibrillation

Affiliations

DNA damage-induced PARP1 activation confers cardiomyocyte dysfunction through NAD+ depletion in experimental atrial fibrillation

Deli Zhang et al. Nat Commun. .

Abstract

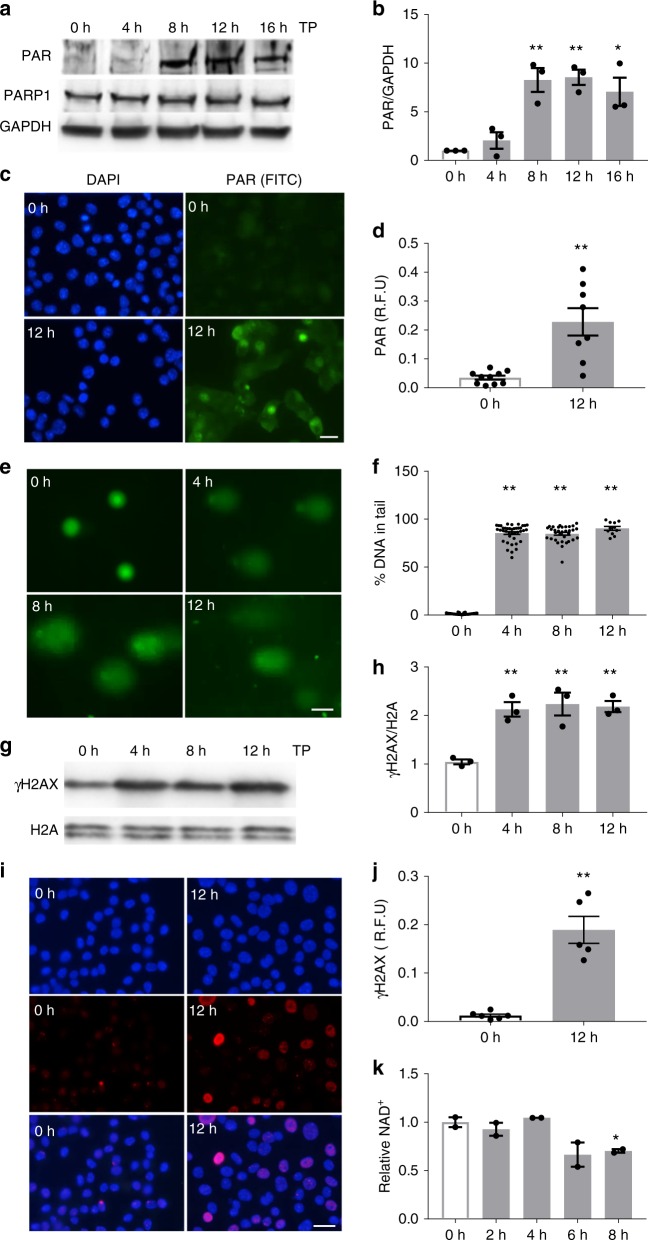
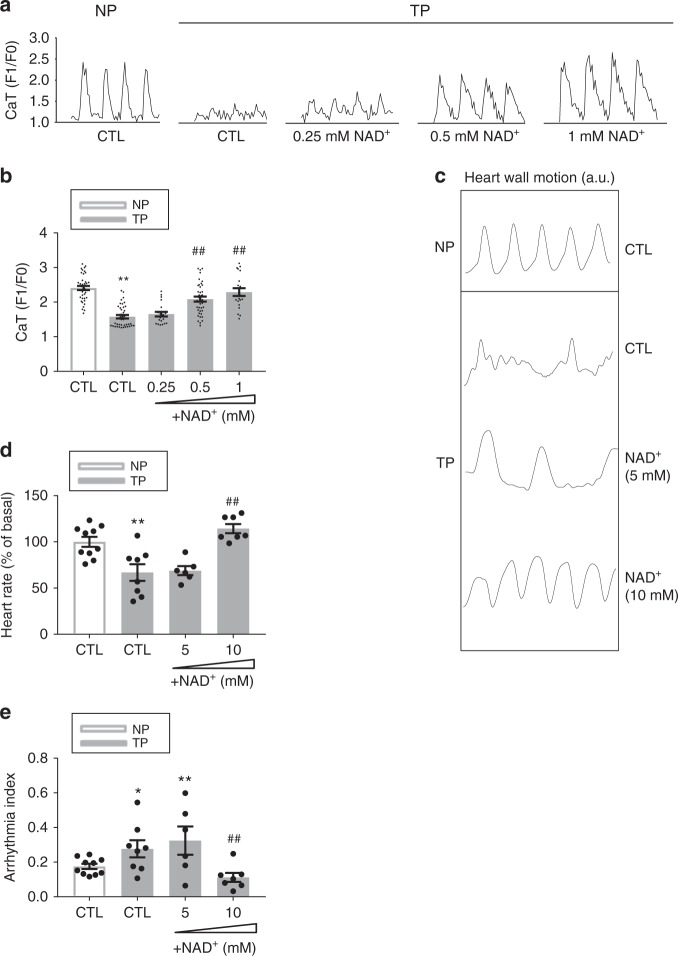
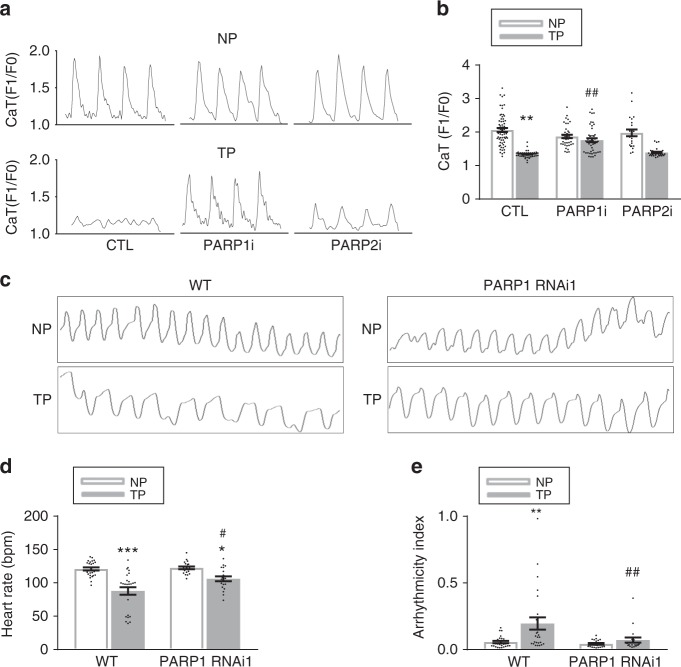
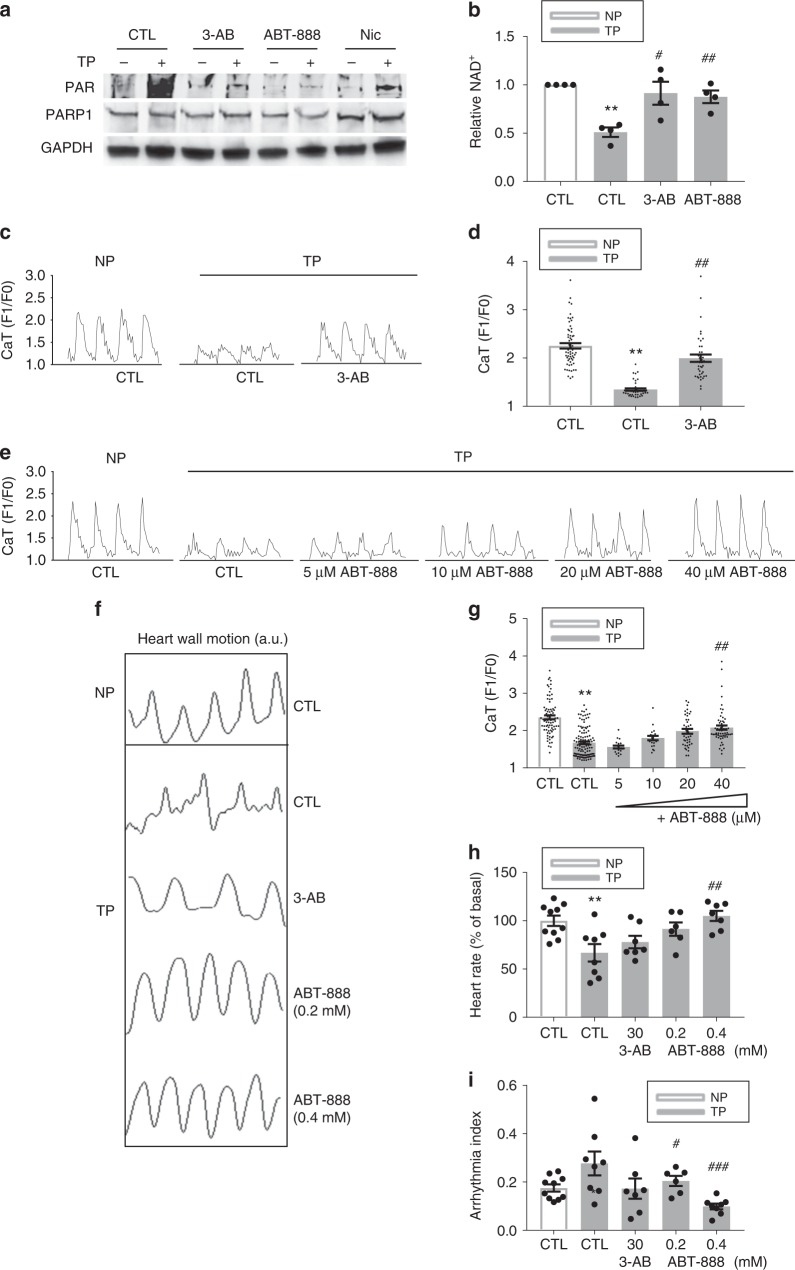
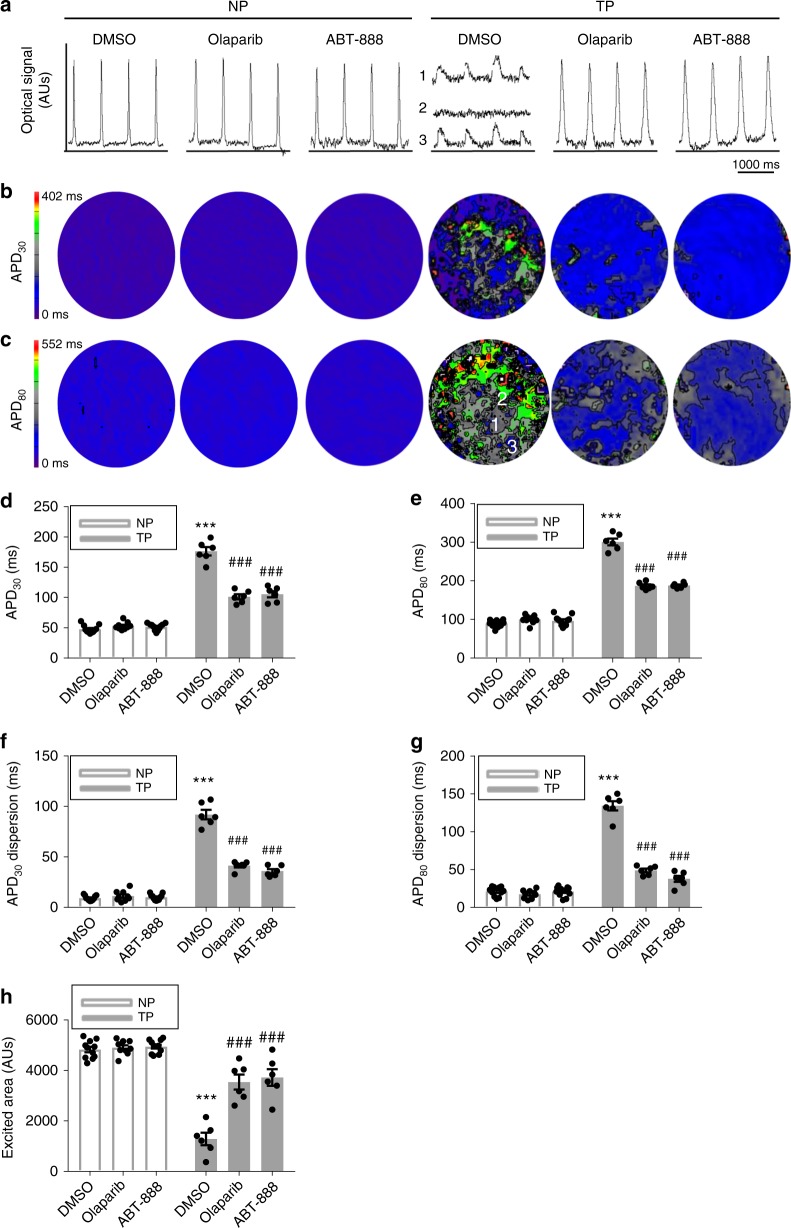
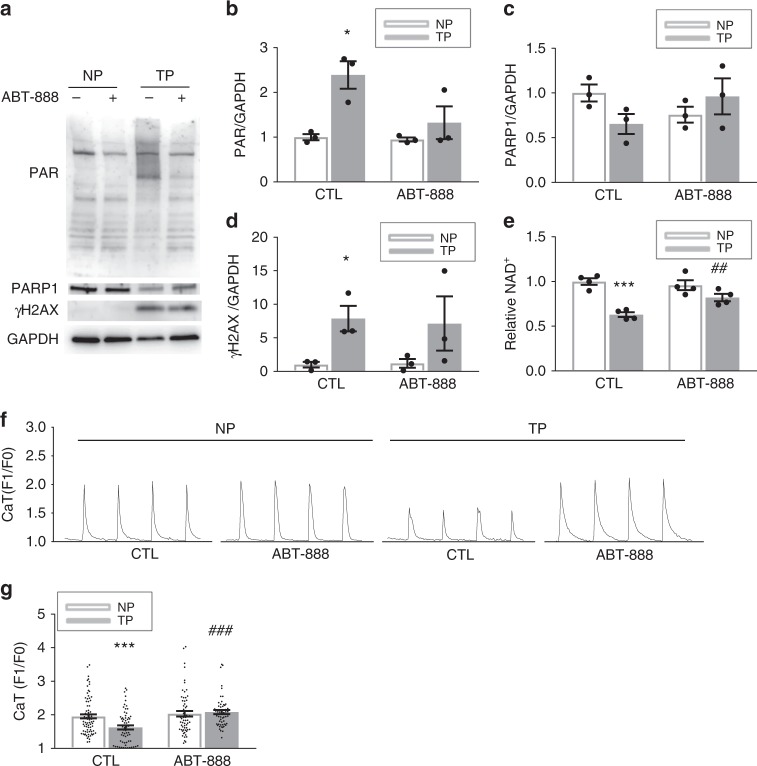
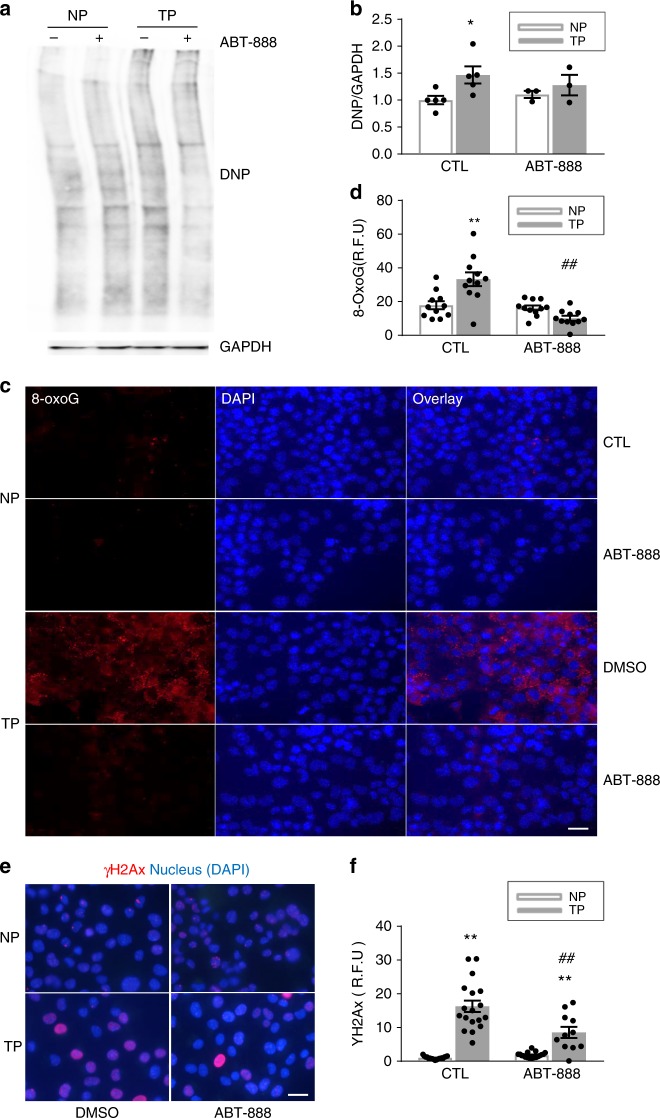
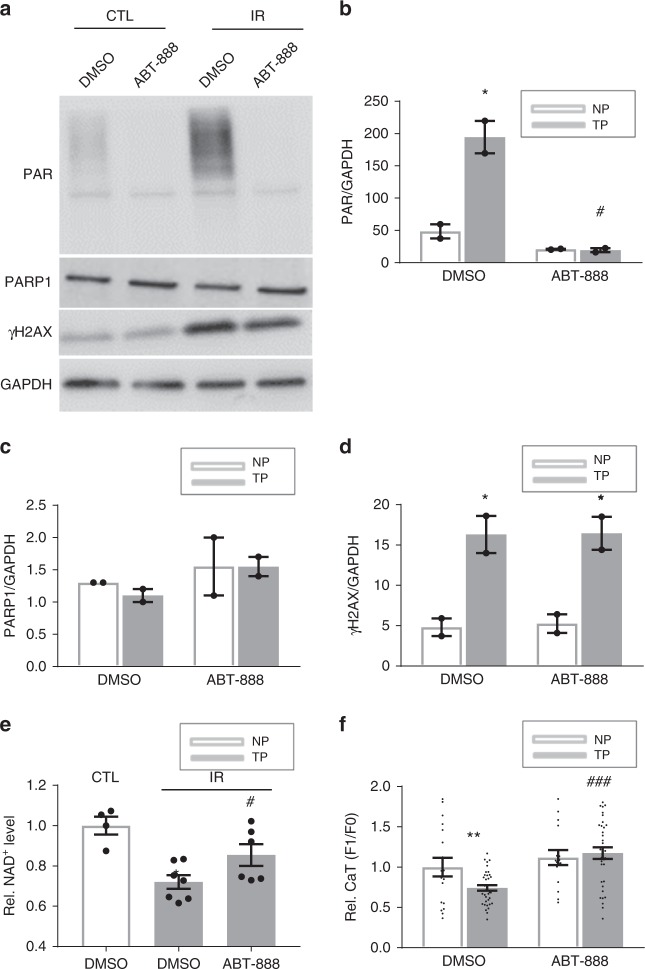
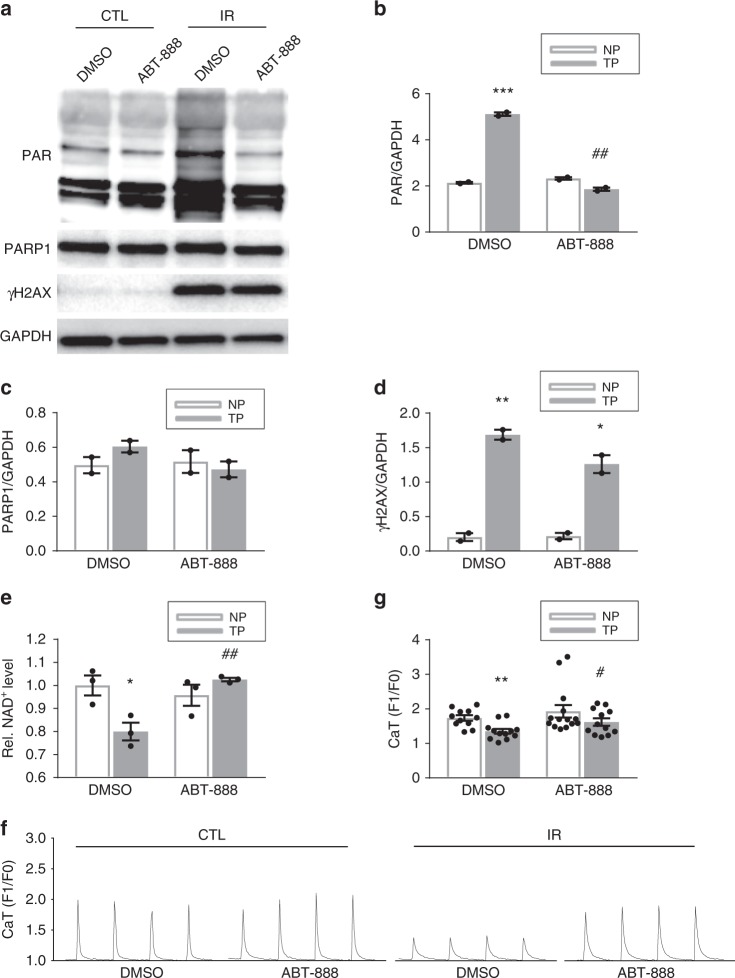
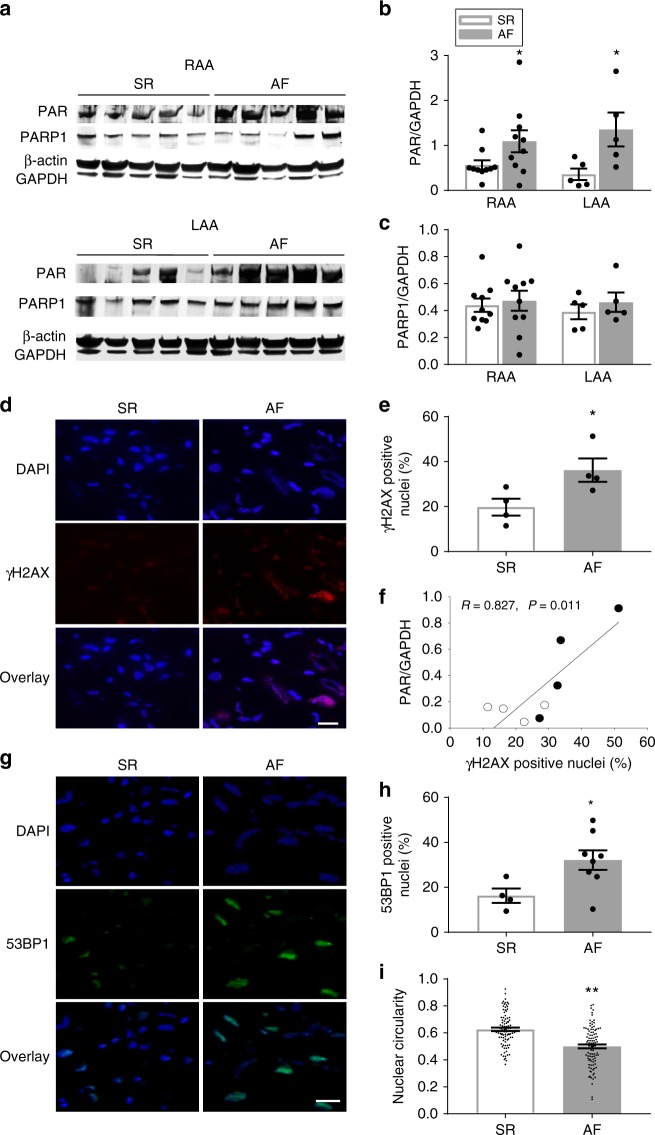
Atrial fibrillation (AF) is the most common clinical tachyarrhythmia with a strong tendency to progress in time. AF progression is driven by derailment of protein homeostasis, which ultimately causes contractile dysfunction of the atria. Here we report that tachypacing-induced functional loss of atrial cardiomyocytes is precipitated by excessive poly(ADP)-ribose polymerase 1 (PARP1) activation in response to oxidative DNA damage. PARP1-mediated synthesis of ADP-ribose chains in turn depletes nicotinamide adenine dinucleotide (NAD+), induces further DNA damage and contractile dysfunction. Accordingly, NAD+ replenishment or PARP1 depletion precludes functional loss. Moreover, inhibition of PARP1 protects against tachypacing-induced NAD+ depletion, oxidative stress, DNA damage and contractile dysfunction in atrial cardiomyocytes and Drosophila. Consistently, cardiomyocytes of persistent AF patients show significant DNA damage, which correlates with PARP1 activity. The findings uncover a mechanism by which tachypacing impairs cardiomyocyte function and implicates PARP1 as a possible therapeutic target that may preserve cardiomyocyte function in clinical AF.


Conflict of interest statement

The authors declare no competing interests.

Figures

Fig. 1
Fig. 1
Tachypacing induces PARP activation, DNA damage, and NAD+ depletion in HL-1 cardiomyocytes. a Representative Western blot of PAR and PARP1 levels in control nonpaced (0 h) and tachypaced (TP) HL-1 cardiomyocytes for durations as indicated. b Quantified data of PAR expression levels from three independent experiments. *P < 0.05 vs. 0 h, **P < 0.01 vs. 0 h. c, d Immunofluorescent staining and quantified data of PAR levels in control (0 h), and in 12 h TP of HL-1 cardiomyocytes. **P < 0.01 vs. 0 h, n = 10 images for 0 h, n = 8 images for 12 h from over 200 cardiomyocytes. e Representative immunofluorescence images of HL-1 cardiomyocytes with time-course TP (0–12 h), showing tail DNA. f Quantified percentage of tail DNA in HL-1 cardiomyocytes **P < 0.01 vs. 0 h, n = 49 cardiomyocytes for 0 h, n = 40 for 4 h, n = 33 for 8 h, n = 11 for 12 h. g, h Representative Western blot of γH2AX, H2A, and quantified data of γH2AX during time-course of TP in HL-1 cardiomyocytes. **P < 0.01 vs. 0 h, n = 3 independent experiments. i, j Representative immunofluorescent staining and quantified data of γH2AX levels in NP (0 h) and TP (12 h) HL-1 cardiomyocytes. **P < 0.01 vs. 0 h, n = 7 images for 0 h, n = 6 images for 12 h from over 200 cardiomyocytes. k Relative NAD+ levels in HL-1 cardiomyocytes during time-course of TP (2–8 h) compared to control (0 h). *P < 0.05 vs. 0 h. n = 2 independent experiments. Scalebar is 15 µm for c, e and i. Data are all expressed as mean ± s.e.m. Individual group mean differences were evaluated with the two-tailed Student’s t test
Fig. 2
Fig. 2
Repletion of NAD+ dose-dependently attenuates contractile dysfunction in HL-1 cardiomyocytes and Drosophila. a, b Representative CaT traces and quantified CaT amplitude data of control non-paced (NP) and tachypaced (TP) HL-1 cardiomyocytes pretreated with or without different doses of NAD+ (0.25, 0.5, 1 mM). **P < 0.01 vs. Control (CTL) NP ##P < 0.01 vs. CTL TP, n = 40 cardiomyocytes CTL NP, n = 40 for CTL TP, n = 20 for NAD+ (0.25 mM) TP, n = 40 for NAD+ (0.5 mM) TP, and n = 20 for NAD+ (1 mM) TP. c Representative heart wall motions (during 3.3 s). d, e Quantified data of relative heart rate and arrhythmicity index to control NP Drosophila. Drosophila were treated with or without NAD+ (5 or 10 mM). *P < 0.05, **P < 0.01 vs. CTL NP ##P < 0.01 vs. CTL TP. n = 10 Drosophila prepupae for CTL NP, n = 8 for CTL TP, n = 6 for NAD+ (5 mM) TP, n = 7 for NAD+ (10 mM). Data are all expressed as mean ± s.e.m. Individual group mean differences were evaluated with the two-tailed Student’s t test
Fig. 3
Fig. 3
PARP1, not PARP2, is the key enzyme mediating tachypacing-induced contractile dysfunction in HL-1 cardiomyocytes and Drosophila. a, b Representative CaT traces and quantified CaT amplitude data in control nonpaced (NP) or tachypaced (TP) HL-1 cardiomyocytes transfected with scrambled siRNA (CTL), PARP1 siRNA (PARP1i), and PARP2 si RNA (PARP2i). **P < 0.01 vs. CTL NP, ##P < 0.01 vs. CTL TP. n = 62 cardiomyocytes for CTL NP, n = 39 for PARP1i NP, n = 22 for PARP2i NP, n = 56 for CTL TP, n = 47 for PARP1i TP, n = 27 for PARP2i TP. c Representative traces (10 s) prepared from high-speed movies of Drosophila prepupae. Movies were made from nonpaced (NP) and tachypaced (TP) Drosophila prepupae in wild-type (WT) and PARP1 knockdown (PARP1 RNAi1) strains. d, e Quantified heart rate (bpm: beats per minute) and arrhythmicity index in milliseconds (ms). Arrhythmicity index was defined as the standard deviation of the heart periodicity. *P < 0.05, **P < 0.01, ***P < 0.001 vs. WT NP, #P < 0.05 vs. WT TP, n = 26 Drosophila prepupae for WT, n = 20 Drosophila prepupae for PARP1i. Data are all expressed as mean ± s.e.m. Individual group mean differences were evaluated with the two-tailed Student’s t test
Fig. 4
Fig. 4
PARP1 inhibitors dose-dependently protect against contractile dysfunction in HL-1 cardiomyocytes and Drosophila. a Representative Western blot showing that the PARP inhibitors 3-AB (3 mM), ABT-888 (40 µM), and nicotinamide (Nic, 10 mM) inhibit tachypacing (TP)-induced PAR formation (PARylation), which is an indicator of PARP activity. b 3-AB (3 mM) and ABT-888 (40 µM) conserved NAD+ levels after TP. The average value of four independent experiments is shown. **P < 0.01 vs. control (CTL) NP, #P < 0.05 vs. CTL TP, ##P < 0.01 vs. CTL TP. c, d Representative CaT traces and quantified CaT amplitude in control non-paced (NP) or tachypaced (TP) HL-1 cardiomyocytes pretreated with 3-AB (3 mM) or vehicle (CTL). **P < 0.01 vs. CTL NP, ##P < 0.01 vs. CTL TP, n = 60 cardiomyocytes for CTL NP, n = 40 for CTL TP, n = 40 for 3-AB TP. e, f Representative CaT and quantified CaT amplitude of nonpaced (NP) and tachypaced (TP) HL-1 cardiomyocytes pretreated with ABT-888 at different doses (5–40 µM) or vehicle DMSO (CTL). **P < 0.01 vs. CTL NP, ##P < 0.01 vs. CTL TP, n = 80 HL-1 cardiomyocytes for CTL NP, n = 119 for CTL TP, n = 20 for 5 μM ABT-888 TP, n = 20 for 10 μM ABT-888 TP, n = 40 for 40 μM ABT-888. gi Representative heart wall contraction measurements and quantified relative heart rate and arrhythmicity index of control NP or TP Drosophila pretreated with 3-AB (30 mM), ABT-888 (0.2 mM, 0.4 mM), or vehicle (CTL). *P < 0.05, **P < 0.01 vs. CTL NP, #P < 0.05, ###P < 0.001 vs. CTL TP, n = 10 Drosophila prepupae for CTL, n = 7 for 3-AB, n = 6 for ABT-888 (0.2 mM), n = 7 for ABT-888 (0.4 mM). Data are all expressed as mean ± s.e.m. Individual group mean differences were evaluated with the two-tailed Student’s t test
Fig. 5
Fig. 5
PARP1 inhibitors significantly attenuated tachypacing-induced electrophysiological deterioration in HL-1 cardiomyocytes. ah Optical voltage mapping of HL-1 cardiomyocyte monolayers following 1-Hz electrical stimulation in control nonpaced (NP) or 8 h tachypaced (TP) HL-1 cardiomyocytes with 20 µM olaparib, 40 µM ABT-888 or vehicle DMSO 12-h pretreatment before tachypacing. a Representative filtered optical signal traces. To indicate electrical heterogeneity, three tracers which vary in time and space [1 and 3] to excitation block [2] in the TP DMSO group are depicted b typical APD30 and c APD80 maps for indicated groups. dh Corresponding quantitative analysis of APD30, APD80, APD30 dispersion, APD80 dispersion and excited cell surface area, showing that TP resulted in significant APD prolongation (a, d, e), an increase in APD dispersion (b, c, f, g) and a significant decrease of excited cell surface area (h) in HL-1 cardiomyocyte monolayers. Pretreatment of HL-1 cultures with ABT-888 or olaparib significantly prevented the tachypacing-induced electrophysiological deteriorations (ah). ***P < 0.001 vs. DMSO NP, ###P < 0.001 vs. DMSO TP. n = 11 for NP DMSO, n = 9 for NP olaparib TP, n = 11 for NP ABT-888, n = 6 for TP DMSO, n = 6 for TP olaparib, n = 6 for TP + ABT-888. n = number of experiments. Data are all expressed as mean ± s.e.m. Individual group mean differences were evaluated with the two-tailed Student’s t test
Fig. 6
Fig. 6
The PARP inhibitor ABT-888 attenuates tachypacing-induced PARP1 activation, NAD+ depletion and CaT loss in adult rat atrial cardiomyocytes. ad Representative Western blot and quantified data of PAR, PARP1, and γH2AX expression levels in rat atrial cardiomyocytes. Tachypacing (TP) significantly increased PAR levels, which was inhibited by the PARP inhibitor ABT-888. PARP1 protein levels were not changed by TP. TP significantly increased DNA damage (γH2AX) compared to NP. *P < 0.05 vs. control (CTL) NP, n = 3 independent experiments. e TP reduced NAD+ levels, which was prevented by PARP inhibitor ABT-8888. ***P < 0.001 vs. CTL NP ##P < 0.01 vs. CTL TP, n = 4 independent experiments. f, g Representative CaT traces and quantified CaT amplitude in control normal-paced (NP) or TP rat atrial cardiomyocytes pretreated with ABT-888 or vehicle DMSO (CTL). ***P < 0.001 vs. CTL NP, ###P < 0.001 vs. CTL TP, n = 79 cardiomyocytes for CTL NP, n = 61 for ABT-888 NP, n = 63 for CTL TP, n = 57 for CTL TP. Data are all expressed as mean ± s.e.m. Individual group mean differences were evaluated with the two-tailed Student’s t test
Fig. 7
Fig. 7
ABT-888 inhibits tachypacing-induced oxidative stress in HL-1 cardiomyocytes. HL-1 cardiomyocytes were pretreated with ABT-888 (40 µM) or vehicle DMSO (CTL) 12 h before tachypacing (TP). a, b Representative Western blot of protein carbonyl oxidation levels by DNP antibody staining and quantified data from n = 5 independent experiments for DMSO NP and TP, n = 3 independent experiments for ABT-888 NP and TP. *P < 0.05 vs. nonpaced (NP) DMSO. c, d Representative immunofluorescence staining of oxidative DNA damage marker 8-oxoguine (8-OxoG). n = 11 images from over 1000 cardiomyocytes. **P < 0.01 vs. NP CTL, ##P < 0.01 vs. CTL TP. e, f Representative immunofluorescence staining of DNA damage marker γH2Ax and quantified data from n = 19 images for DMSO NP and ABT-888 NP; n = 18 images for DMSO TP, n = 11 for ABT-888 TP from over 200 cardiomyocytes. **P < 0.01 vs NP CTL, ##P < 0.01 vs CTL TP. Scalebar is 15 µm. Data are all expressed as mean ± s.e.m. Individual group mean differences were evaluated with the two-tailed Student’s t test
Fig. 8
Fig. 8
Irradiation-induced DNA damage results in PARP1 activation, NAD+ reduction and contractile dysfunction in HL-1 cardiomyocytes. a Representative Western blot of PAR and γH2AX in control (CTL) and irradiated (IR) HL-1 cardiomyocytes treated either with vehicle (DMSO) or ABT-888. bd Quantified data of Western blot in a, showing significant increase in PAR and γH2AX levels, indicating PARP1 activation and presence of DNA damage, respectively, due to IR. ABT-888 pretreatment protected against PAR induction. *P < 0.05, **P < 0.01 vs. CTL. n = 2 independent experiments. No significant difference was found in the amount of PARP1. e Relative NAD+ levels in CTL and IR HL-1 cardiomyocytes. IR resulted in reduction in NAD+ levels, which was prevented by ABT-888 pretreatment. *P < 0.05 vs. CTL treated with vehicle DMSO, #P < 0.05 vs. IR treated with vehicle DMSO, n = 4 independent experiments for CTL DMSO, n = 7 independent experiments for IR DMSO, n = 6 independent experiments for IR ABT-888. f Quantified CaT amplitude in CTL or IR HL-1 cardiomyocytes pretreated with ABT-888 (3 mM) or vehicle (CTL). ABT-888 protected against IR-induced CaT loss. **P < 0.01 vs. CTL DMSO; ###P < 0.0001 vs. IR DMSO, n = 18 cardiomyocytes for CTL DMSO, n = 37 for IR DMSO, n = 16 for CTL ABT-888, n = 34 for IR ABT-888. Data are all expressed as mean ± s.e.m. Individual group mean differences were evaluated with the two-tailed Student’s t test
Fig. 9
Fig. 9
Irradiation-induced DNA damage results in PARP1 activation, NAD+ reduction and contractile dysfunction in rat atrial cardiomyocytes. a Representative Western blot showing PAR and γH2AX levels due to irradiation (IR) with and without ABT-888 pretreatment. bd Quantified data of Western blot in a, showing significant increase in PAR and γH2AX levels, indicating PARP activation and presence of DNA damage, respectively, due to IR. ABT-888 pretreatment protected against PAR induction. *P < 0.05, **P < 0.01, ***P < 0.001 vs. control nonirradiated (CTL) rat atrial cardiomyocytes treated with vehicle DMSO. ##P < 0.01 vs. IR treated with vehicle DMSO, n = 2 independent experiments. No significant difference was found in the amount of PARP1. e Relative NAD+ levels in CTL and IR rat atrial cardiomyocytes treated with DMSO or ABT. IR resulted in reduction in NAD+ levels which was prevented by ABT-888 pretreatment *P < 0.05 vs. CTL treated with vehicle DMSO, ##P < 0.01 vs. IR treated with vehicle DMSO, n = 3 independent experiments. f Quantified CaT amplitude in CTL or IR rat atrial cardiomyocytes pretreated with ABT-888 or vehicle (CTL). ABT-888 protected against IR-induced CaT loss. **P < 0.01 vs. CTL DMSO; #P < 0.05 vs. IR DMSO, n = 11 atrial cardiomyocytes for CTL DMSO, n = 14 for CTL ABT-888, n = 12 for IR DMSO and IR ABT-888. Data are all expressed as mean ± s.e.m. Individual group mean differences were evaluated with the two-tailed Student’s t test
Fig. 10
Fig. 10
Patients with AF reveal DNA damage and PARP1 activation. ac Representative Western blots of PAR and PARP1 levels in RAA and LAA of SR and AF patients with underlying mitral valve disease, showing significant increase in PAR levels in AF patients compared to SR. PARP1 expression levels remain unchanged between AF and SR patients. n = 10 for SR RAA, n = 5 for SR LAA, n = 10 for AF RAA, n = 5 for AF LAA *P < 0.05 SR RAA vs. AF RAA, SR LAA vs. AF LAA. d Representative immunofluorescence staining of γH2AX in RAA of SR and AF patients. e Quantified data of positive nuclear γH2AX staining of RAA from SR and AF patients. n = 4 for SR, n = 5 for AF. f PARP1 activity (PAR) correlates significantly with DNA damage (γH2AX positive nuclei). n = 4 for each group. SR: open circle and AF: filled circle. g Representative immunofluorescent staining of 53BP1 in RAA of SR and AF patients. h Quantified data of positive nuclear 53BP1 staining in RAA of SR and AF patients. n = 4 for SR, n = 7 for AF. i Quantification of nuclear circularity in SR and AF patients showing AF patients with elongated nuclei. n = 94 nuclei from 4 SR patients and n = 104 nuclei from 7 AF patients. di *P < 0.05 SR vs. AF, **P < 0.01 SR vs. AF. Scalebar is 40 µm. Data are all expressed as mean ± s.e.m. Individual group mean differences were evaluated with the two-tailed Student’s t test

References

    1. Nattel S. New ideas about atrial fibrillation 50 years on. Nature. 2002;415:219–226. doi: 10.1038/415219a. - DOI - PubMed
    1. Ke L, et al. Calpain mediates cardiac troponin degradation and contractile dysfunction in atrial fibrillation. J. Mol. Cell. Cardiol. 2008;45:685–693. doi: 10.1016/j.yjmcc.2008.08.012. - DOI - PubMed
    1. Brundel BJJM, et al. Activation of proteolysis by calpains and structural changes in human paroxysmal and persistent atrial fibrillation. Cardiovasc. Res. 2002;54:380–389. doi: 10.1016/S0008-6363(02)00289-4. - DOI - PubMed
    1. Brundel BJ, Kampinga HH, Henning RH. Calpain inhibition prevents pacing-induced cellular remodeling in a HL-1 myocyte model for atrial fibrillation. Cardiovasc. Res. 2004;62:521–528. doi: 10.1016/j.cardiores.2004.02.007. - DOI - PubMed
    1. Zhang D, et al. Effects of different small HSPB members on contractile dysfunction and structural changes in a Drosophila melanogaster model for atrial fibrillation. J. Mol. Cell. Cardiol. 2011;51:381–389. doi: 10.1016/j.yjmcc.2011.06.008. - DOI - PubMed

Publication types

MeSH terms

LinkOut - more resources