. 2019 Mar 21;10(1):1296.
doi: 10.1038/s41467-019-09179-w.

Targeting glutamine-addiction and overcoming CDK4/6 inhibitor resistance in human esophageal squamous cell carcinoma

Affiliations

Targeting glutamine-addiction and overcoming CDK4/6 inhibitor resistance in human esophageal squamous cell carcinoma

Shuo Qie et al. Nat Commun. .

Abstract

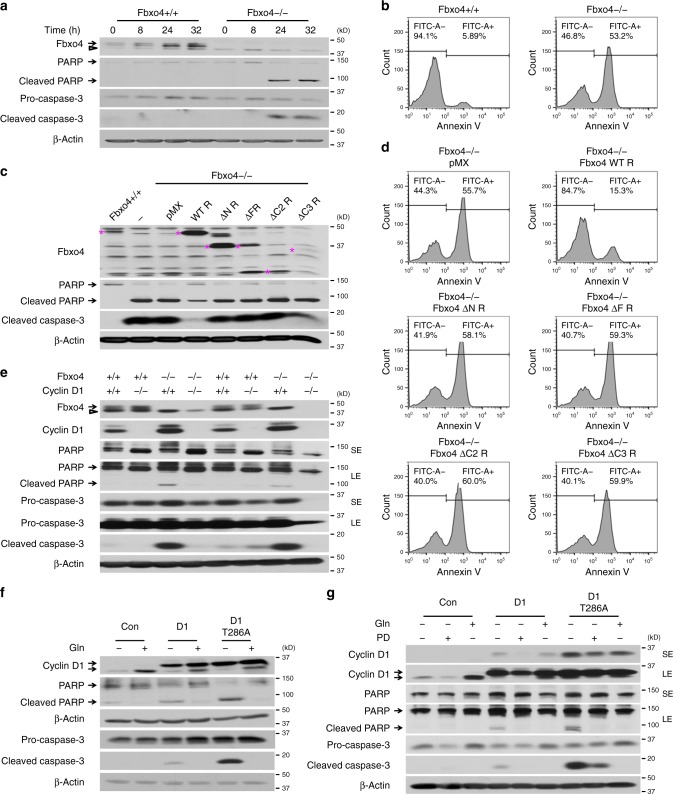
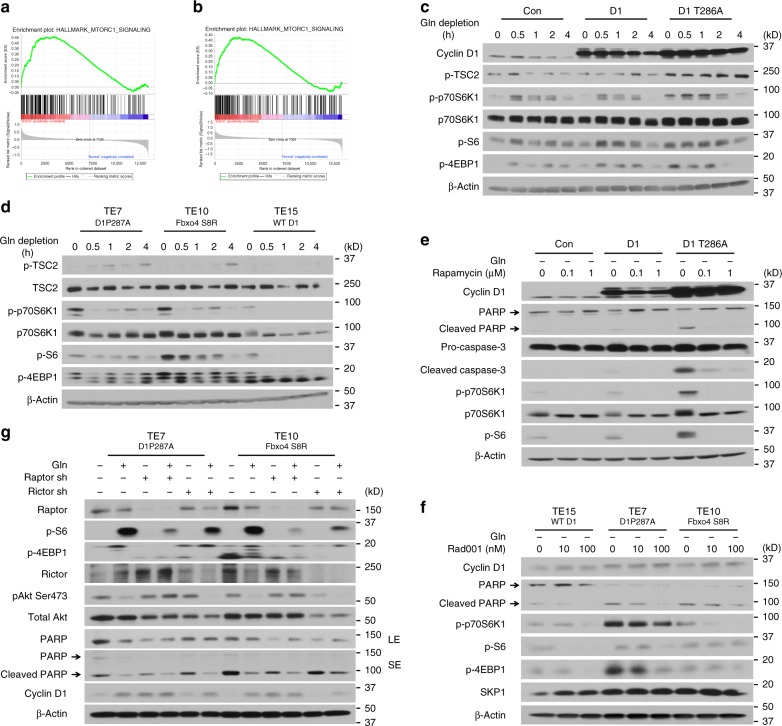
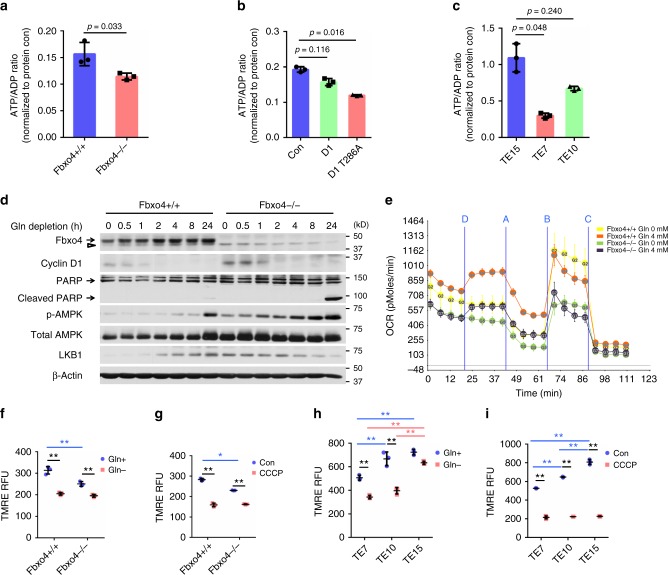
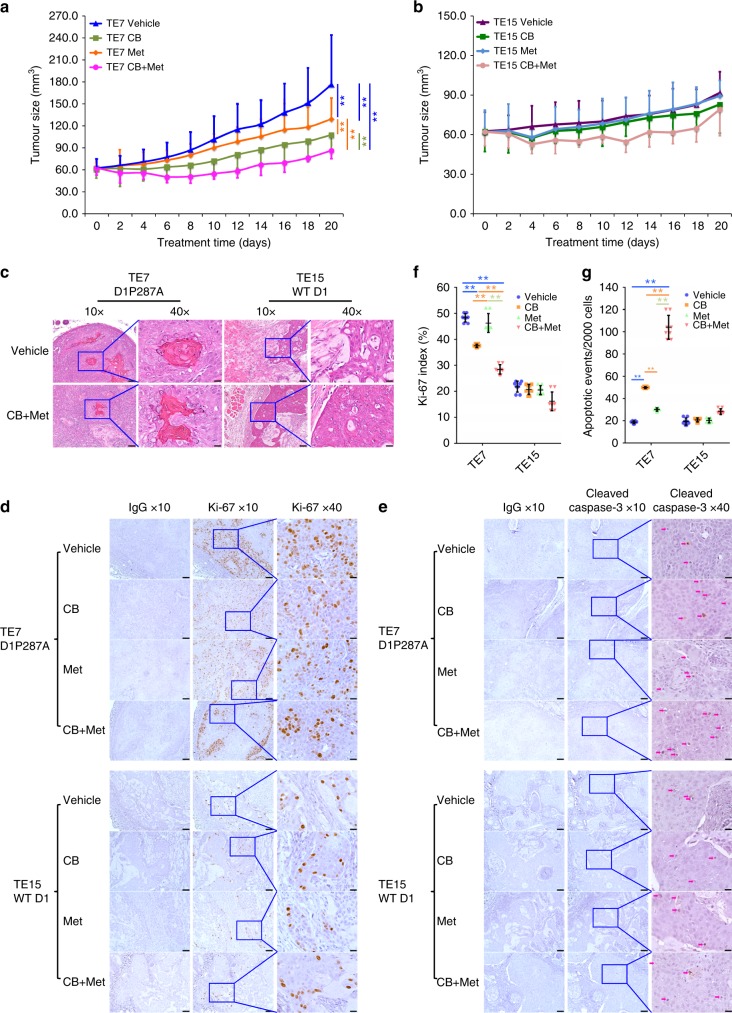
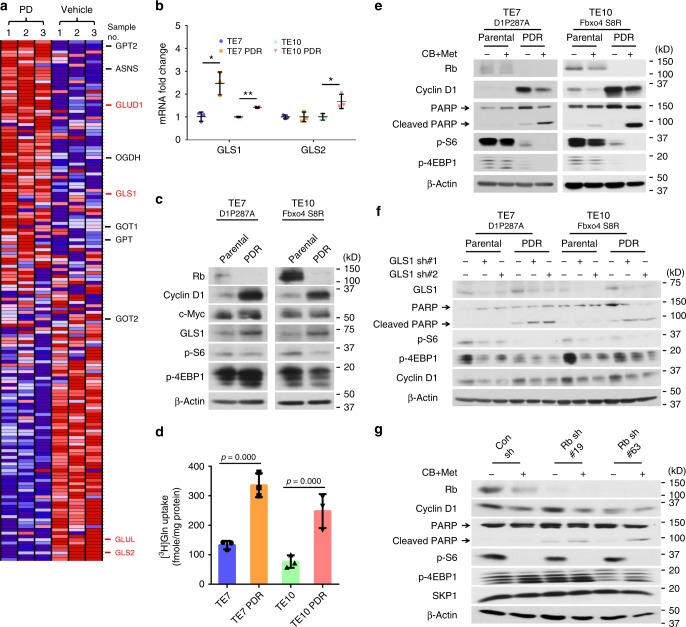
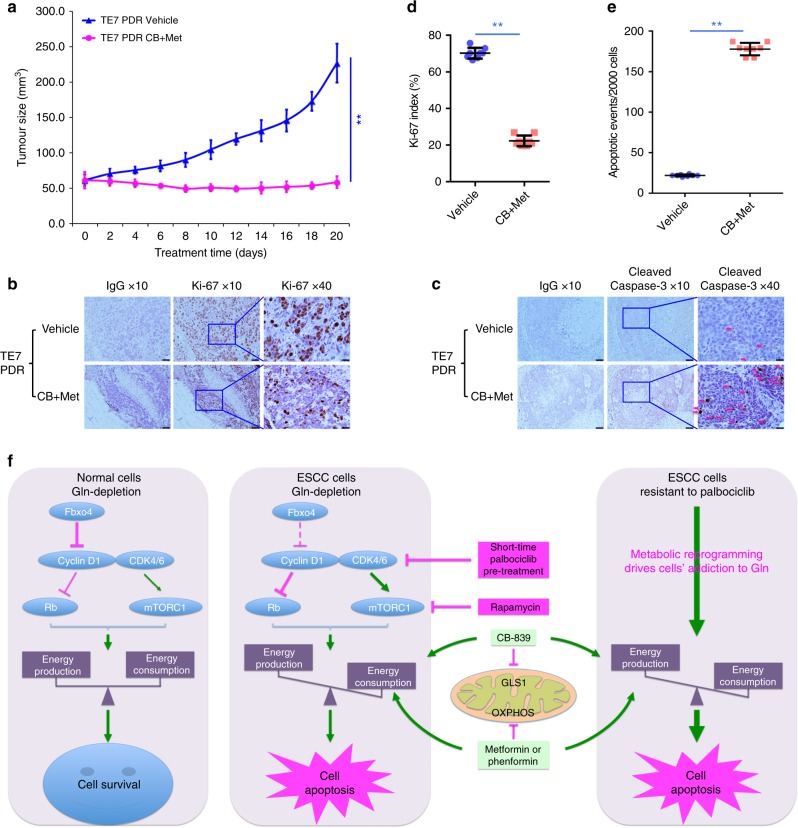
The dysregulation of Fbxo4-cyclin D1 axis occurs at high frequency in esophageal squamous cell carcinoma (ESCC), where it promotes ESCC development and progression. However, defining a therapeutic vulnerability that results from this dysregulation has remained elusive. Here we demonstrate that Rb and mTORC1 contribute to Gln-addiction upon the dysregulation of the Fbxo4-cyclin D1 axis, which leads to the reprogramming of cellular metabolism. This reprogramming is characterized by reduced energy production and increased sensitivity of ESCC cells to combined treatment with CB-839 (glutaminase 1 inhibitor) plus metformin/phenformin. Of additional importance, this combined treatment has potent efficacy in ESCC cells with acquired resistance to CDK4/6 inhibitors in vitro and in xenograft tumors. Our findings reveal a molecular basis for cancer therapy through targeting glutaminolysis and mitochondrial respiration in ESCC with dysregulated Fbxo4-cyclin D1 axis as well as cancers resistant to CDK4/6 inhibitors.


Conflict of interest statement

The authors declare no competing interests.

Figures

Fig. 1
Fig. 1
Dysregulated Fbxo4-cyclin D1 axis leads to Gln-addiction. a Western analysis for cleaved PARP and cleaved caspase-3 in Fbxo4−/− mouse embryonic fibroblasts (MEFs) following Gln-depletion. b FACS for Annexin V-positive cells following 48 h Gln-depletion. c Western analysis for cleaved PARP and cleaved caspase-3 following 24 h Gln-depletion in Fbxo4−/− MEFs with ectopic expression of Fbxo4 WT, ΔN, ΔF, ΔC2, or ΔC3. Magenta stars indicate Fbxo4 bands. d FACS for Annexin V-positive cells following 48 h Gln-depletion. e Cyclin D1 knockout antagonizes apoptosis in a Fbxo4−/− background following 24 h Gln-depletion. In order to show cyclin D1 expression, cyclin D1 blot was performed in medium with Gln, because Gln-depletion reduces endogenous cyclin D1 expression. f Overexpression of cyclin D1 promotes apoptosis in NIH3T3 cells upon 24 h Gln-depletion. g One micromolar PD-0332991 (PD) suppresses apoptosis induced by 24 h Gln-depletion in NIH3T3 cells with ectopic cyclin D1 or D1T286A. SE: short exposure; LE: long exposure. Arrow: specific band; open triangle: non-specific band
Fig. 2
Fig. 2
Dysregulated Fbxo4-cyclin D1 axis promotes Gln-addiction in esophageal squamous cell carcinoma (ESCC) cells. a Gene set enrichment analysis (GSEA) enrichment of ESCC versus normal tissues for gene set “Cell Cycle Regulation” in NCBI GEO dataset (GSE100942): NES = 1.4644697, FDR q-val = 0.45459393. b GSEA enrichment of ESCC versus normal tissues for gene set related to “Gln Metabolism” in NCBI GEO dataset (GSE100942): NES = 1.5255251, FDR q-val = 0.06451613. c Expression of Gln metabolism genes correlates with poor prognosis of ESCC patients. Dysregulated Gln Met: dysregulated Gln metabolism; HR: hazard ratio; CI: confidence interval. d Increased PARP cleavage following 24 h Gln-depletion in TE7 and TE10 versus TE15 cells. e WT Fbxo4 suppresses PARP cleavage following 24 h Gln-depletion in TE10 cells. f Overexpression of cyclin D1 or D1T286A promotes the sensitivity of TE15 cells to 24 h Gln-depletion. g Increased PARP cleavage in TE1 versus TE15 cells upon 24 h Gln-depletion. h FACS for Annexin V-positive cells with or without 48 h Gln-depletion in TE7, TE10, TE1, and TE15 cells. Arrow: band of interest; open triangle: non-specific band
Fig. 3
Fig. 3
mTORC1 contributes to Gln-addiction in cells with dysregulated cyclin D1. a, b Gene set enrichment analysis (GSEA) enrichment plots for expression profiles of esophageal squamous cell carcinoma (ESCC) versus normal tissues for gene sets correlated to mTORC1 signaling in NCBI GEO datasets: a GSE100942—NES = 1.4599689, FDR q-val = 0.12097056 and b GSE20347—NES = 1.269795, FDR q-val = 0.3669077. c Western blot for the indicated mTORC1 effectors in NIH3T3 cells expressing cyclin D1 or D1T286A. d Western blot analysis for mTORC1 effectors in TE7, TE10, and TE15 cells. e Rapamycin compromises mTORC1 activation and apoptosis induced by ectopic cyclin D1 expression in NIH3T3 cells upon 24 h Gln-depletion. f Rad001 inhibits mTORC1 activation and apoptosis in TE7 and TE10 cells upon 24 h Gln-depletion. g Raptor knockdown suppresses apoptosis in TE7 and TE10 cells upon 24 h Gln-depletion. SE: short exposure; LE: long exposure. Arrow: specific band
Fig. 4
Fig. 4
Cyclin D1 accumulation promotes mitochondrial dysfunction. ac ATP/ADP ratio in Fbxo4+/+ and −/− mouse embryonic fibroblasts (MEFs) (a), NIH3T3 cells (b), and esophageal squamous cell carcinoma (ESCC) cells (c) detected by ApoSENSOR™ ADP/ATP ratio bioluminescent assay. a Data represent as mean ± s.d., two-tailed Student t-test was used to compare means (n = 3); b, c Data represent as mean ± s.d., one-way ANOVA was used to compare means with Bonferroni as Post Hoc test (n = 3); p-values are listed. d Western analysis for the indicated proteins in Fbxo4+/+ versus −/− MEFs upon Gln-depletion. Arrow: band of interest; open triangle: non-specific band. e Seahorse analysis for Fbxo4+/+ and −/− MEFs; data were normalized to protein concentration. Injections: Port D: Gln; Port A: Oligomycin; Port B: Carbonyl cyanide-4-(trifluoromethoxy)phenylhydrazone (FCCP) and Port C: Antimycin A & Rotenone. f, g Mitochondrial membrane potential analysis of Fbxo4+/+ and −/− MEFs; g Carbonyl cyanide m-chlorophenyl hydrazone (CCCP) treatment as positive control. h, i Mitochondrial membrane potential analysis of TE7, TE10, and TE15 cells; i CCCP treatment as positive control. TMRE, tetramethylrhodamine, ethyl ester; RFU, relative fluorescence units. All data in fi represent as mean ± s.d., one-way ANOVA was used to compare means with Bonferroni as Post Hoc test (n = 3). *p < 0.05; **p < 0.01
Fig. 5
Fig. 5
CB-839 plus Phenformin/Metformin synergistically induces apoptosis. a Western analysis of PARP and caspase-3 cleavage in Fbxo4−/− versus +/+ mouse embryonic fibroblasts (MEFs) treated with Phenformin following 24 h Gln-depletion. b Western analysis for the indicated proteins in Fbxo4+/+ versus −/− MEFs treated with CB-839 plus phenformin for 24 h. c Western analysis for PARP cleavage following 24 h treatment with CB-839 and/or phenformin in TE7, TE10, and TE15 cells. d Combined treatment for 24 h induces more apoptosis in TE15 cells with ectopic cyclin D1 or D1T286A expression. SE: short exposure; LE: long exposure. e FACS for Annexin V-positive cells following combined CB-839 (CB) and metformin (Met) treatment for 48 h. f, g Mitochondrial membrane potential analysis of Fbxo4+/+ and −/− MEFs with the indicated treatments; g CCCP treatment as positive control. h, i Mitochondrial membrane potential analysis of TE7, TE10, and TE15 cells with indicated treatments; i CCCP treatment as positive control. All data represent as mean ± s.d., one-way ANOVA was used to compare means with Bonferroni as Post Hoc test (n = 3). *p < 0.05; **p < 0.01. CB-839 concentration is 10 μM and phenformin/metformin concentration is 1 mM for panels ai. Arrow: specific band; open triangle: non-specific band
Fig. 6
Fig. 6
Combined treatment inhibits xenograft growth and induces apoptosis in vivo. a, b Growth curve of TE7 (a) and TE15 (b) xenografts. Data represent as mean ± s.d., two-way ANOVA was used to compare means with Bonferroni as Post Hoc test (n = 8). **p < 0.01. c H&E staining sections from TE7 and TE15 xenografts. d IHC staining of Ki-67 in xenograft tissues. e IHC staining of cleaved caspase-3 in xenograft tissues, magenta arrow indicates positive cells. f Comparison of Ki-67 index among different groups. g Quantification of cleaved caspase-3 positive cells per 2000 cells. All data in f and g represent as mean ± s.d., one-way ANOVA was used to compare means with Bonferroni as Post Hoc test (n = 8). **p < 0.01. Scale bar, 10 μm
Fig. 7
Fig. 7
Combined treatment overcomes CDK4/6 inhibitor resistance in esophageal squamous cell carcinoma (ESCC) cells. a Blue-Pink O’ Gram in the Space of the Analyzed Gene Set with NCBI GEO (GSE40513), the comparison of Gln metabolism genes between palbociclib and vehicle-treated mouse breast cancer V720 cells. Glutamate-ammonia ligase (GLUL), glutamate dehydrogenase (GLUD), asparagine synthetase (ASNS), glutamic-oxaloacetic transaminase (GOT), and glutamic-pyruvic transaminase (GPT). Red color indicates gene upregulation; blue color indicates gene downregulation. b The expression of GLS1 and GLS2 mRNAs in parental and PDR cells. Data represent as mean ± s.d., two-tailed Student t-test was used to compare means (n = 3). *p < 0.05, **p < 0.01. c Western blot analysis of GLS1 levels in parental and PDR cells. d PDR ESCC cells exhibit increased [3H]Gln uptake relative to parental counterparts (1 × 105 cells used). Data represent as mean ± s.d., one-way ANOVA was used to compare means with Bonferroni as Post Hoc test (n = 3); p-values are listed. e CB-839 plus metformin treatment for 24 h induces more apoptosis in both TE7PDR and TE10PDR cells. f GLS1 knockdown increases apoptosis in both TE7PDR and TE10PDR cells. g Rb knockdown induces cell apoptosis in TE15 cells upon combined treatment for 24 h. Arrow: band of interest
Fig. 8
Fig. 8
Combined treatment suppresses TE7PDR xenograft growth and induces cell apoptosis in vivo. a Growth curve of TE7PDR xenografts in nude mice. Data represent as mean ± s.d., two-way ANOVA was used to compare means with Bonferroni as Post Hoc test (n = 8). **p < 0.01. b IHC staining of Ki-67 in xenograft tissues. c IHC staining of cleaved caspase-3 in xenograft tissues, magenta arrow indicates positive cells. d Comparison of Ki-67 index between vehicle and treated groups. e Quantification of cleaved caspase-3 positive cells per 2000 cells between vehicle and treated groups. All data in d and e represent as mean ± s.d., two-tailed Student t-test was used to compare means (n = 8). **p < 0.01. Scale bar, 10 μm. f Schematic illustration of the working model. In normal cells, the homeostatic regulation of Fbxo4-cyclin D1 axis keeps the downstream pathway balanced; however, in tumor cells, dysregulated Fbxo4-cyclin D1 axis suppresses Rb and hyperactivates mTORC1, leading to the imbalance between energetic production and consumption, and finally, Gln-addiction. By targeting this genetic vulnerability, combined CB-839 and metformin/phenformin disrupts the metabolic balance, leading to cell apoptosis and the suppression of cell proliferation. In addition, palbociclib-resistant ESCC cells demonstrate metabolic reprogramming characterized by Gln-addiction, resulting in increased sensitivity to combined treatment. This model provides promising therapeutic targets for cancer treatment

Similar articles

Cited by

References

    1. Rustgi AK, El-Serag HB. Esophageal carcinoma. N. Engl. J. Med. 2014;371:2499–2509. doi: 10.1056/NEJMra1314530. - DOI - PubMed
    1. Pennathur A, Gibson MK, Jobe BA, Luketich JD. Oesophageal carcinoma. Lancet. 2013;381:400–412. doi: 10.1016/S0140-6736(12)60643-6. - DOI - PubMed
    1. Chen XX, et al. Genomic comparison of esophageal squamous cell carcinoma and its precursor lesions by multi-region whole-exome sequencing. Nat. Commun. 2017;8:524. doi: 10.1038/s41467-017-00650-0. - DOI - PMC - PubMed
    1. Sharpless NE, Sherr CJ. Forging a signature of in vivo senescence. Nat. Rev. Cancer. 2015;15:397–408. doi: 10.1038/nrc3960. - DOI - PubMed
    1. Gennaro VJ, et al. Control of CCND1 ubiquitylation by the catalytic SAGA subunit USP22 is essential for cell cycle progression through G1 in cancer cells. Proc. Natl Acad. Sci. USA. 2018;115:E9298–E9307. doi: 10.1073/pnas.1807704115. - DOI - PMC - PubMed

Publication types

MeSH terms