. 2019 Mar 21;10(1):1311.
doi: 10.1038/s41467-019-09222-w.

Capturing site-specific heterogeneity with large-scale N-glycoproteome analysis

Affiliations

Capturing site-specific heterogeneity with large-scale N-glycoproteome analysis

Nicholas M Riley et al. Nat Commun. .

Abstract

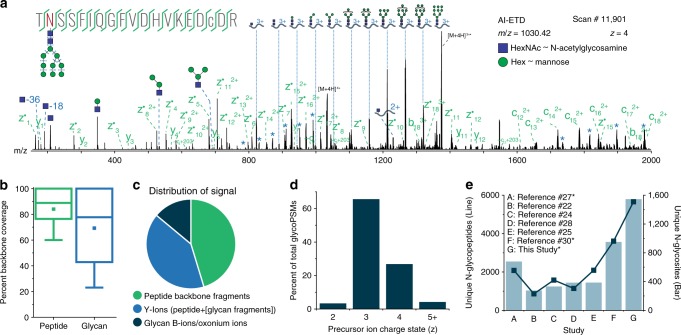
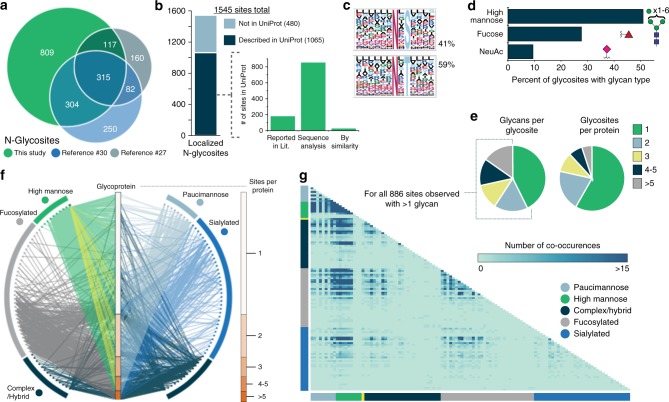
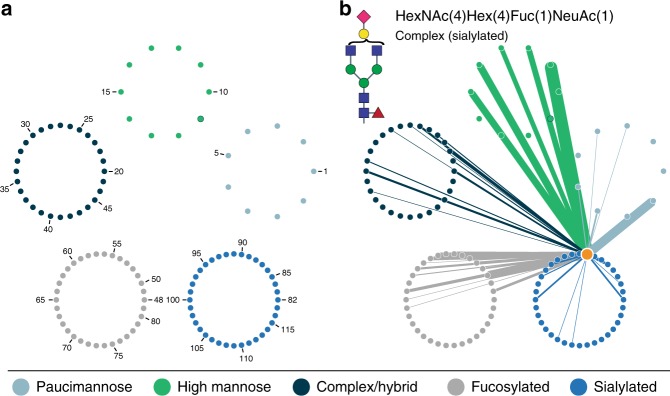
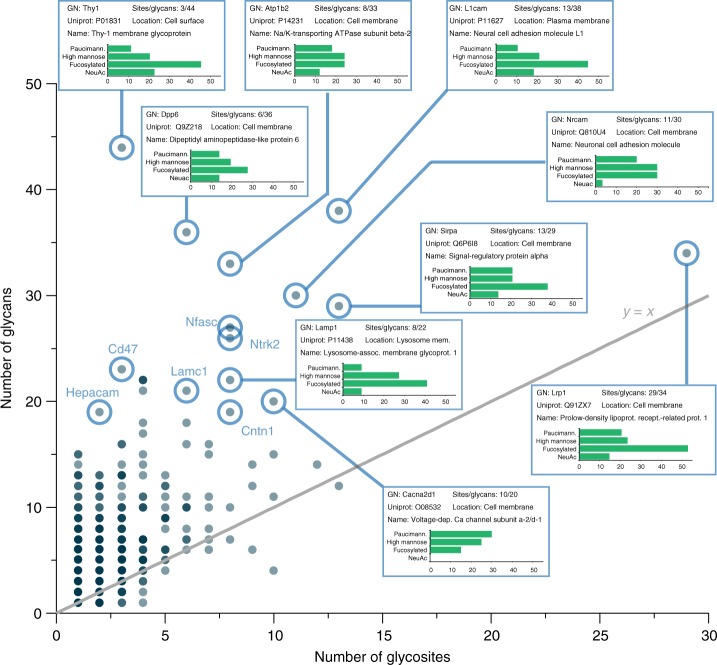
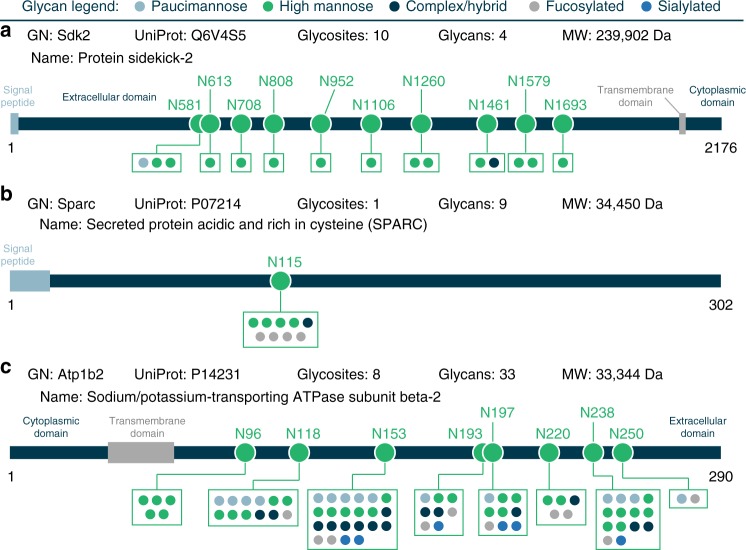
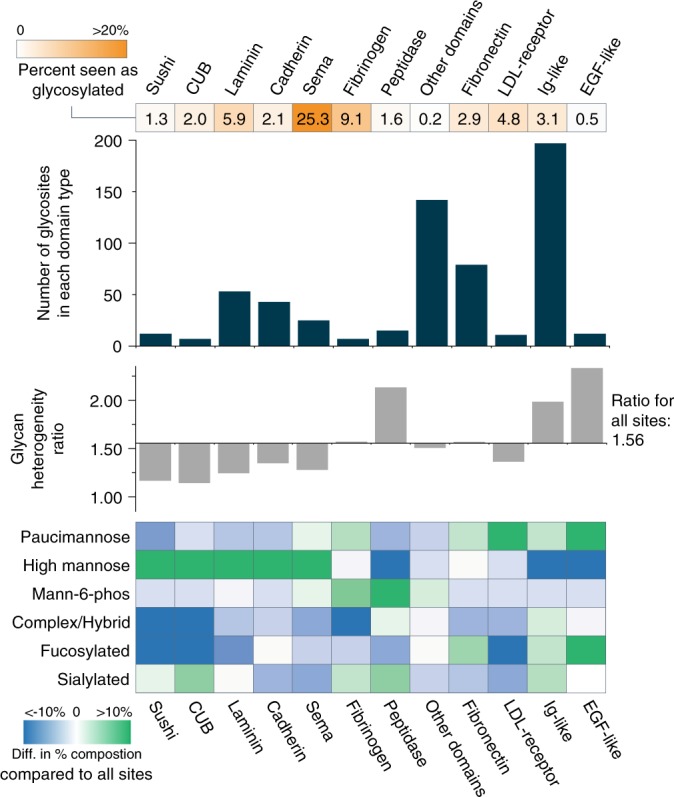
Protein glycosylation is a highly important, yet poorly understood protein post-translational modification. Thousands of possible glycan structures and compositions create potential for tremendous site heterogeneity. A lack of suitable analytical methods for large-scale analyses of intact glycopeptides has limited our abilities both to address the degree of heterogeneity across the glycoproteome and to understand how this contributes biologically to complex systems. Here we show that N-glycoproteome site-specific microheterogeneity can be captured via large-scale glycopeptide profiling methods enabled by activated ion electron transfer dissociation (AI-ETD), ultimately characterizing 1,545 N-glycosites (>5,600 unique N-glycopeptides) from mouse brain tissue. Our data reveal that N-glycosylation profiles can differ between subcellular regions and structural domains and that N-glycosite heterogeneity manifests in several different forms, including dramatic differences in glycosites on the same protein. Moreover, we use this large-scale glycoproteomic dataset to develop several visualizations that will prove useful for analyzing intact glycopeptides in future studies.


Conflict of interest statement

J.J.C. is an inventor of electron transfer dissociation and is a consultant for Thermo Fisher Scientific. The other authors declare no competing interests.

Figures

Fig. 1
Fig. 1
Identifying intact glycopeptides with AI-ETD. a Annotated single AI-ETD spectrum (i.e., no averaging) of N-glycopeptide TN*SSFIQGFVDHVKEDcDR modified with a high mannose-type glycan [HexNAc(2)Hex(9)]. The red asparagine indicates the site of glycosylation, and the lowercase cysteine indicates carbamidomethylation. Green fragments are products from peptide backbone cleavage, triply charged Y-ions are annotated along the top, and B-ions include only glycan moieties. Blue asterisks (*) denote doubly and quadruply charged Y-ions (from 1700 to 2000 and 750 to 1000 Th, respectively), each which differ by one hexose residue. Peptide fragments retain the glycan modification unless denoted by a “~”. b Distribution of percent peptide backbone coverage and glycan coverage seen in AI-ETD spectra. Median and quartile values are provided by the center line and box boundaries, respectively. Whiskers show 10th and 90th percentiles, and the small square indicates the average. c Average percent of explained ion current in product ions in AI-ETD spectra from peptide backbone cleavage fragments, Y-ions (i.e., intact peptide sequence with fragments of the glycan moiety), and B-ions/oxonium ions. d Distribution of precursor ion charge states successfully identified in the 24,099 glyco PSMs from this study, given as a percentage of the total. e Comparison of recent large-scale N-glycopeptide studies showing the number of unique N-glycopeptides (left axis, dark blue line) and unique N-glycosites (right axis, light blue bars) identified. Asterisks (*) by the study name indicate that mouse brain was the system investigated
Fig. 2
Fig. 2
Characteristics of glycosites identified with AI-ETD. a Overlap of mouse brain N-glycosites identified in this study with those from Liu et al. and Trinidad et al. studies. b Approximately 69% of identified glycosites are described as known glycosites in the UniProt database, and the majority of them have that description based on sequence analysis (i.e., prediction of glycosite based on the presence of the N-X-S/T sequon). c Sequence motifs for N-glycosites having either the N-X-S or N-X-T sequon and their relative percentage in the unique glycosites identified. d Percentage of total glycosites that had glycans of high mannose type or that contained a fucose or NeuAc residue. e Distribution of the number of different glycans seen at a given glycosite, i.e., the degree of glycan microheterogeneity (left), and the number of glycosites per glycoprotein identified (right). f A glycoprotein-glycan network maps which glycans (outer circle, 117 total) modify which proteins (inner bar, 771 total). Glycoproteins are sorted by number of glycosites (scale to the right). Glycans are organized by classification, and edges are colored by the glycan node from which they originate, except for mannose-6-phosphate which has yellow edges. See Supplementary Fig. 11 and Supplementary Table 1 for glycan identifiers. g A glycan co-occurrence heat map represents the number of times glycan pairs appeared together at the same glycosite, indicating which glycans contribute most to microheterogeneity of the >880 sites that had more than one glycan modifying them
Fig. 3
Fig. 3
Glycan co-occurrence networks. a The organization of the glycan co-occurrence network is given, where glycans are sorted into circles based on glycan type, each node is one of the 117 glycans identified, and the numbers indicate glycans identities given in Supplementary Table 3. Glycan 19 (green with dark blue border) indicates mannose-6-phosphate. b The glycan co-occurrence network shows all the glycans that co-occurred with HexNAc(4)Hex(4)Fuc(1)NeuAc(1) (highlighted as an orange node, i.e., the source node), with the relative number of occurrences indicated by edge thickness. Edge color indicates the target node
Fig. 4
Fig. 4
Glycan heterogeneity by glycoprotein. A scatter plot showing the number of glycans identified per glycoprotein vs. the number of glycosites identified for that protein summarizes a degree of glycosylation heterogeneity at the protein level. An y = x line is shown in gray to provide an eye guide for proteins that had a particularly high number of glycans relative to the number of glycosites identified, some of which are highlighted. Boxes for highlighted proteins display gene name (GN), UniProt accession number, number of glycosites/glycans identified, the cellular location assigned to this protein, and a common name for the protein. Additionally, they provide a bar chart that displays the percentage of the total number of identified glycans (i.e., the x-axis) that can be classified as paucimannose, high mannose, fucosylated, or sialylated (NeuAc). Note, if a paucimannose or sialylated glycan was fucosylated, it was also counted as fucosylated for this calculation. Gene names of other interesting proteins with a high glycan-to-glycosite ratio are also provided
Fig. 5
Fig. 5
Glycan microheterogeneity can manifest in several different forms. Glycosites can have small or large degrees of glycan heterogeneity, and this level of glycan diversity can even differ for glycosites on the same protein. Here three examples of different modes of heterogeneity are provided: a several glycosites on one protein with limited glycan heterogeneity (Protein sidekick-2), b a protein with one glycosite that has some degree of heterogeneity (SPARC), and c several glycosites on one protein that show either low or high glycan heterogeneity (Na/K-transporting ATPase subunit beta-2)
Fig. 6
Fig. 6
Delineating glycosylation profiles by subcellular cellular locations. a Glycosylation profiles for glycoproteins from 12 subcellular locations (derived from GO cellular component terms) are shown, with colors indicating glycan type and line thickness indicating frequency. Orange denotes mannose-6-phosphate. b Euclidean distances were calculated between each of the 12 subcellular localizations to indicate similarity in their glycosylation types (darker indicates a higher degree of similarity). c Number of GO cellular component terms associated with identified glycoproteins
Fig. 7
Fig. 7
Mapping glycosites to protein domains. The number of glycosites mapping to a given domain and the percent of a given domain observed as glycosylated are provided in the dark blue bar chart and the orange heat map above it, respectively. The gray bar graph compares glycan heterogeneity ratios for domains compared to the ratio for all 1545 glycosites (with an average ratio of 1.56 for all sites), and the heat map at the bottom indicates differences in glycan types observed at sites within a domain type compared to the distribution of glycan types seen in all 1545 sites

Similar articles

Cited by

References

    1. Leymarie N, et al. Interlaboratory study on differential analysis of protein glycosylation by mass spectrometry: the ABRF glycoprotein research multi-institutional study 2012. Mol. Cell. Proteom. 2013;12:2935–2951. doi: 10.1074/mcp.M113.030643. - DOI - PMC - PubMed
    1. Thaysen-Andersen M, Packer NH, Schulz BL. Maturing glycoproteomics technologies provide unique structural insights into the N -glycoproteome and its regulation in health and disease. Mol. Cell. Proteom. 2016;15:1773–1790. doi: 10.1074/mcp.O115.057638. - DOI - PMC - PubMed
    1. Varki, A. et al. Essentials of Glycobiology. Essentials of Glycobiology (Cold Spring Harbor Laboratory Press, NY, 2015).
    1. Moremen KW, Tiemeyer M, Nairn AV. Vertebrate protein glycosylation: diversity, synthesis and function. Nat. Rev. Mol. Cell Biol. 2012;13:448–462. doi: 10.1038/nrm3383. - DOI - PMC - PubMed
    1. Zhu Z, Desaire H. Carbohydrates on proteins: site-specific glycosylation analysis by mass spectrometry. Annu. Rev. Anal. Chem. 2015;8:463–483. doi: 10.1146/annurev-anchem-071114-040240. - DOI - PubMed

Publication types

MeSH terms