. 2019 Mar 21;10(1):1305.
doi: 10.1038/s41467-019-09285-9.

Cervicovaginal microbiota and local immune response modulate the risk of spontaneous preterm delivery

Affiliations

Cervicovaginal microbiota and local immune response modulate the risk of spontaneous preterm delivery

Michal A Elovitz et al. Nat Commun. .

Abstract

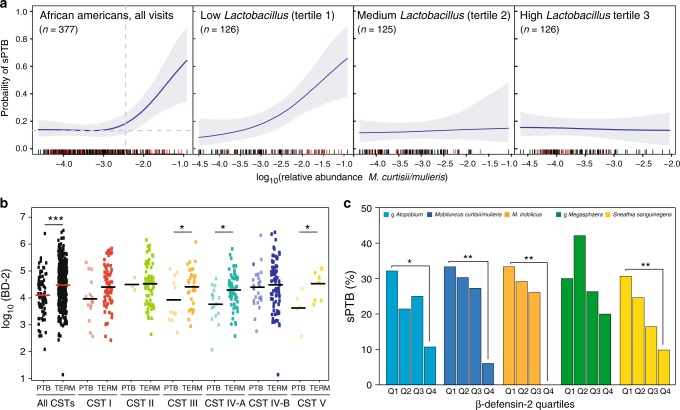
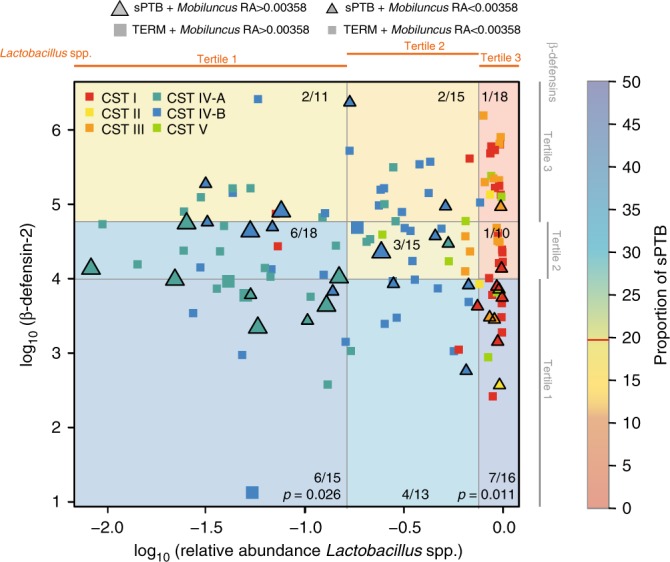
Failure to predict and understand the causes of preterm birth, the leading cause of neonatal morbidity and mortality, have limited effective interventions and therapeutics. From a cohort of 2000 pregnant women, we performed a nested case control study on 107 well-phenotyped cases of spontaneous preterm birth (sPTB) and 432 women delivering at term. Using innovative Bayesian modeling of cervicovaginal microbiota, seven bacterial taxa were significantly associated with increased risk of sPTB, with a stronger effect in African American women. However, higher vaginal levels of β-defensin-2 lowered the risk of sPTB associated with cervicovaginal microbiota in an ethnicity-dependent manner. Surprisingly, even in Lactobacillus spp. dominated cervicovaginal microbiota, low β-defensin-2 was associated with increased risk of sPTB. These findings hold promise for diagnostics to accurately identify women at risk for sPTB early in pregnancy. Therapeutic strategies could include immune modulators and microbiome-based therapeutics to reduce this significant health burden.


Conflict of interest statement

M.A.E., P.G., and J.R. are inventors on a patent application (number PCT/US2018/012185) submitted by the Trustees of the University of Pennsylvania that covers compositions and methods for predicting risk of preterm birth. The authors declare no other competing interests.

Figures

Fig. 1
Fig. 1
Vaginal microbiota composition and structure and risk of sPTB. a Frequency of each CST in non-AA and AA pregnant women when considering samples collected at all three visits or visit 1 (16–20 weeks of gestation). b Frequency of each CST stratified by outcomes (sPTB vs term) in all subjects, non-AA and AA when considering samples collected at all three visits or visit 1 alone. n represents the number of samples included in the analysis. For (a) and (b) p-values were estimated using mixed effects Poisson regression models (all visits) or ordinary logistic regression models (single visit) (c) Volcano plot for seven bacterial taxa statistically significantly associated with increased risk of sPTB in all subjects (red) and AA (blue) showing the effect size on the x-axis and the strength of the association on the y-axis. The gray horizontal lines indicate q-value of 0.05. The median relative abundance of each phylotype is indicated by the size of the point. Dependence of the risk of sPTB (defined as <37 weeks of gestation) on the log10 relative abundance of M. curtisii/mulieris and S. sanguinegens in all subjects and AA is shown on the right. Effect size is the difference between the lowest and highest probability of sPTB. Greyed area indicates 95% credible region. Dotted line corresponds to the significant risk of sPTB threshold values (taxa log10 relative abundance above which the risk is significant different from baseline). n represents the number of samples in which the bacterial taxon was detected and included in the analysis. (d) is the same as (c) but with sPTB defined as birth at <34 weeks of gestation. N represents the number of subjects in each group. Statistically significant taxa were identified using a Bayesian logistic regression nonparametric adaptive spline models. e Kaplan–Meier survival plot for M. indolicus, M. curtisii/mulieris and S. sanguinegens in all and AA women who harbor these bacterial taxa at relative abundance (RA) below (blue) or above (orange) the threshold values above which the risk of sPTB is significant different from baseline. p-values estimated using Cox proportional hazard regression models using coxph() routine of the survival R package. Statistical significance is shown as *p-value < 0.01, **p-value < 0.001, and ***p-value < 0.0001
Fig. 2
Fig. 2
β-defensin-2 and microbiota modulate the risk of spontaneous preterm delivery. a Modulation of the risk of sPTB by relative abundance of M. curtisii/mulieris stratified by Lactobacillus spp. relative abundance tertiles within AA when all visits are considered. n represents the number of samples where M. curtisii/mulieris was detected. b log10 β-defensin-2 abundances at visit 1 in AA women stratified by pregnancy outcomes and vaginal community state types. p-values estimated using a t-test. c At visit 1 in AA women, the risk of sPTB associated with the relative abundance of five bacterial taxa is modulated by the abundance of β-defensin-2. p-values were estimated using a Bayesian 2-proportions binomial model with uniform prior implemented in rstan R package. Statistical significance is shown as *p-value < 0.01, **p-value < 0.001 and ***p-value < 0.0001
Fig. 3
Fig. 3
Interactions between β-defensin-2, Lactobacillus spp. relative abundance, M. curtisii/mulieris relative abundance, vaginal community state types and pregnancy outcomes in AA women at visit 1. Each woman who went on to deliver preterm is represented by a triangle, while those who delivered at term by a square. Large and small triangles or squares are colored by CSTs and indicate relative abundances (RA) of M. curtisii/mulieris above and below its threshold value, respectively, as defined in Fig. 1. β-defensin-2 concentrations and Lactobacillus spp. relative abundances were stratified into tertiles. The color of each quadrant indicates the proportion of sPTBs (number of sPTB/total births). p-values were estimated using Bayesian binomial models using uniform prior for two proportions implemented in rstan R package

Similar articles

Cited by

References

    1. Martin JA, Hamilton BE, Osterman MJ, Driscoll AK, Mathews TJ. Births: final data for 2015. Natl. Vital. Stat. Rep. 2017;66:1. - PubMed
    1. MacDorman MF, Matthews TJ, Mohangoo AD, Zeitlin J. International comparisons of infant mortality and related factors: United States and Europe, 2010. Natl. Vital. Stat. Rep. 2014;63:1–6. - PubMed
    1. Goldenberg RL, Culhane JF, Iams JD, Romero R. Epidemiology and causes of preterm birth. Lancet. 2008;371:75–84. doi: 10.1016/S0140-6736(08)60074-4. - DOI - PMC - PubMed
    1. Hall ES, Greenberg JM. Estimating community-level costs of preterm birth. Public Health. 2016;141:222–228. doi: 10.1016/j.puhe.2016.09.033. - DOI - PubMed
    1. McCabe ER, Carrino GE, Russell RB, Howse JL. Fighting for the next generation: US Prematurity in 2030. Pediatrics. 2014;134:1193–1199. doi: 10.1542/peds.2014-2541. - DOI - PubMed

Publication types

MeSH terms