Comparative Study
. 2019 Dec 25;10(1):1220.
doi: 10.1038/s41467-019-09230-w.

Accurate autocorrelation modeling substantially improves fMRI reliability

Affiliations
Comparative Study

Accurate autocorrelation modeling substantially improves fMRI reliability

Wiktor Olszowy et al. Nat Commun. .

Erratum in

Abstract

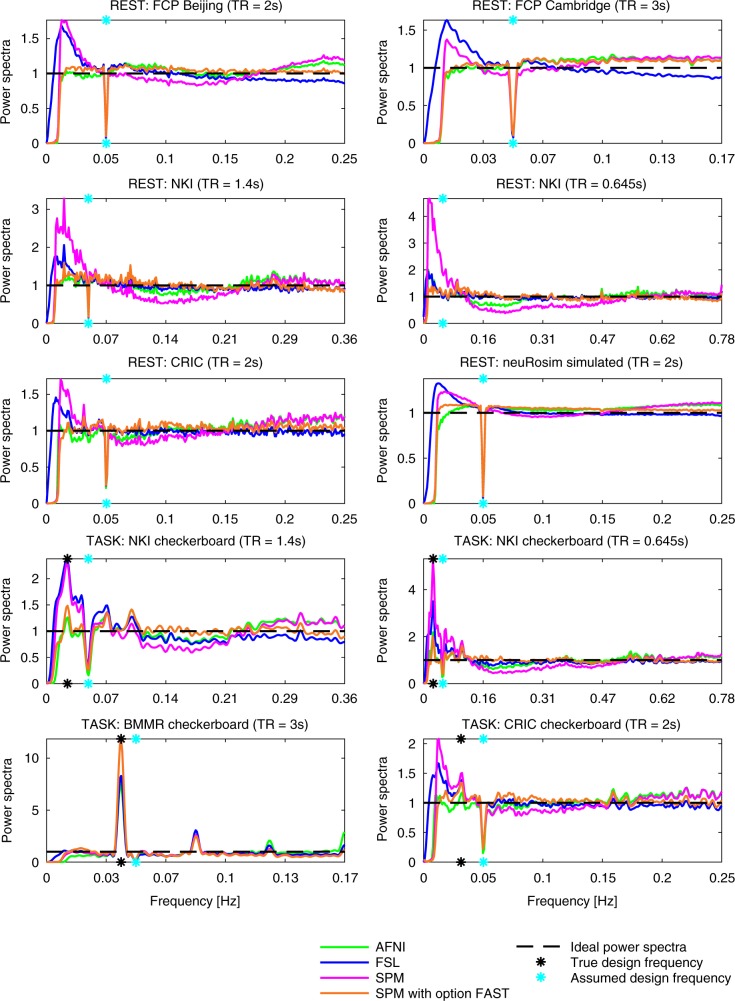
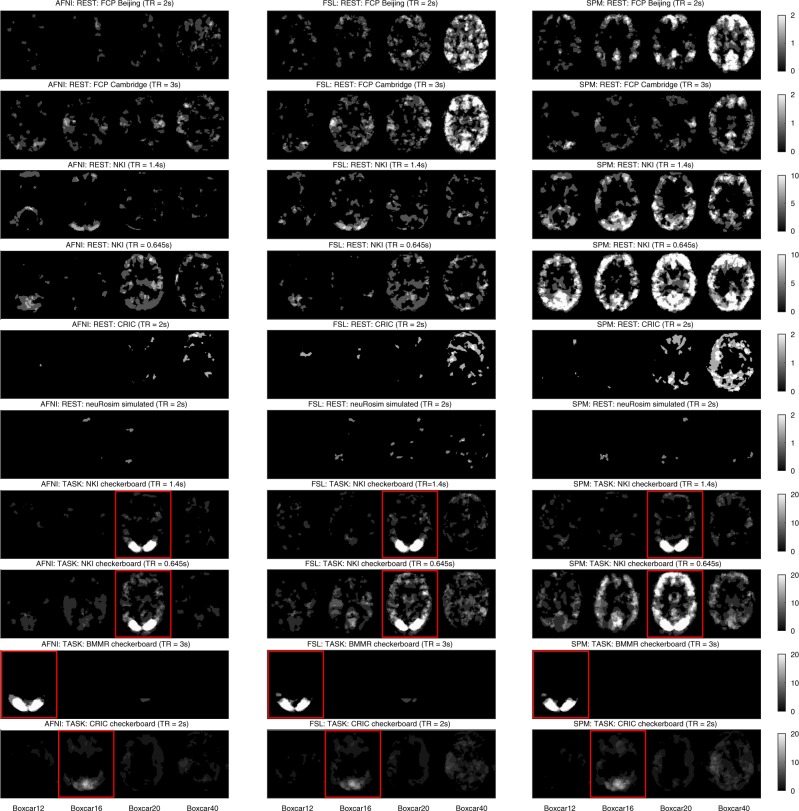
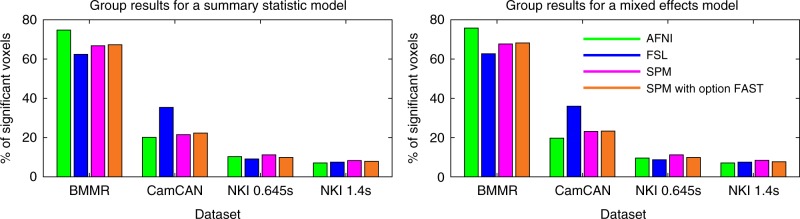
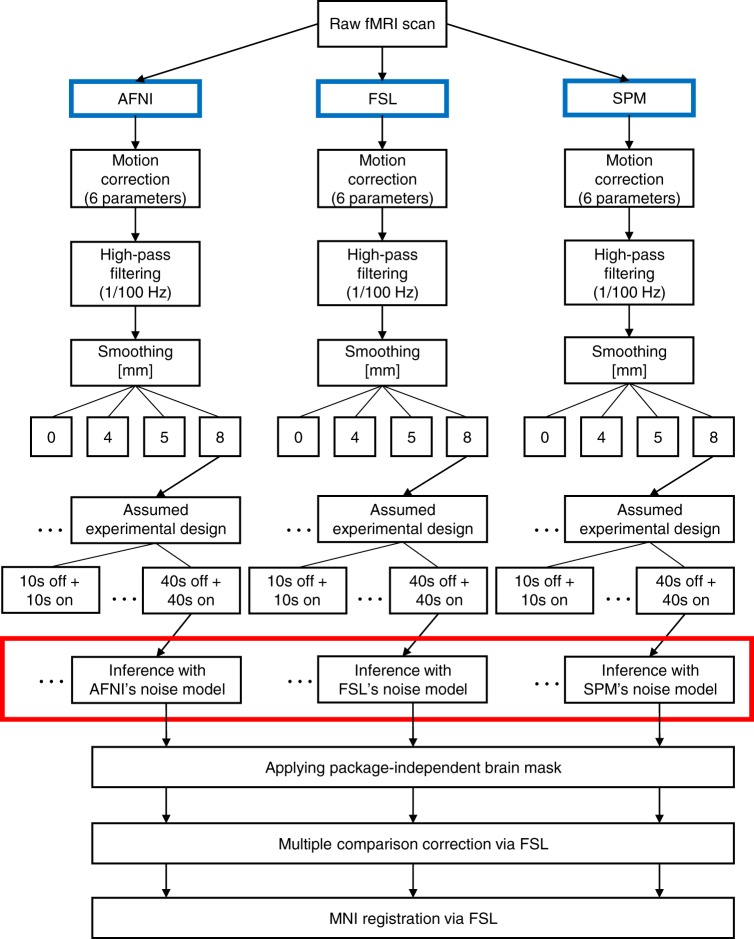
Given the recent controversies in some neuroimaging statistical methods, we compare the most frequently used functional Magnetic Resonance Imaging (fMRI) analysis packages: AFNI, FSL and SPM, with regard to temporal autocorrelation modeling. This process, sometimes known as pre-whitening, is conducted in virtually all task fMRI studies. Here, we employ eleven datasets containing 980 scans corresponding to different fMRI protocols and subject populations. We found that autocorrelation modeling in AFNI, although imperfect, performed much better than the autocorrelation modeling of FSL and SPM. The presence of residual autocorrelated noise in FSL and SPM leads to heavily confounded first level results, particularly for low-frequency experimental designs. SPM's alternative pre-whitening method, FAST, performed better than SPM's default. The reliability of task fMRI studies could be improved with more accurate autocorrelation modeling. We recommend that fMRI analysis packages provide diagnostic plots to make users aware of any pre-whitening problems.


Conflict of interest statement

The authors declare no competing interests.

Figures

Fig. 1
Fig. 1
Power spectra of the GLM residuals in native space averaged across brain voxels and across subjects for the assumed boxcar design of 10 s of rest followed by 10 s of stimulus presentation (boxcar10). The dips at 0.05 Hz are due to the assumed design period being 20 s (10 s + 10 s). For some datasets, the dip is not seen as the assumed design frequency was not covered by any of the sampled frequencies. The frequencies on the x-axis go up to the Nyquist frequency, which is 0.5/repetition time. If after pre-whitening the residuals were white (as it is assumed), the power spectra would be flat. AFNI and SPM’s alternative method: FAST, led to best whitening performance (most flat spectra). For FSL and SPM, there was substantial autocorrelated noise left after pre-whitening, particularly at low frequencies
Fig. 2
Fig. 2
Spatial distribution of significant clusters in AFNI (left), FSL (middle), and SPM (right) for different assumed experimental designs. Scale refers to the percentage of subjects where significant activation was detected at the given voxel. The red boxes indicate the true designs (for task data). Resting state data were used as null data. Thus, low numbers of significant voxels were a desirable outcome, as it was suggesting high specificity. Task data with assumed wrong designs were used as null data too. Thus, large positive differences between the true design and the wrong designs were a desirable outcome. The clearest cut between the true and the wrong/dummy designs was obtained with AFNI’s noise model. FAST performed similarly to AFNI’s noise model (not shown)
Fig. 3
Fig. 3
Group results for four task datasets with assumed true designs. Summary statistic analyses and mixed effects analyses led to only negligibly different percentages of significant voxels
Fig. 4
Fig. 4
The employed analyses pipelines. For SPM, we investigated both the default noise model and the alternative noise model: FAST. The noise models used by AFNI, FSL, and SPM were the only relevant difference (marked in a red box)

References

    1. Bullmore E, et al. Statistical methods of estimation and inference for functional MR image analysis. Magn. Reson. Med. 1996;35:261–277. doi: 10.1002/mrm.1910350219. - DOI - PubMed
    1. Lund TE, Madsen KH, Sidaros K, Luo WL, Nichols TE. Non-white noise in fMRI: does modelling have an impact? Neuroimage. 2006;29:54–66. doi: 10.1016/j.neuroimage.2005.07.005. - DOI - PubMed
    1. Purdon PL, Weisskoff RM. Effect of temporal autocorrelation due to physiological noise and stimulus paradigm on voxel-level false-positive rates in fMRI. Hum. Brain Mapp. 1998;6:239–249. doi: 10.1002/(SICI)1097-0193(1998)6:4<239::AID-HBM4>3.0.CO;2-4. - DOI - PMC - PubMed
    1. Worsley KJ, et al. A general statistical analysis for fMRI data. Neuroimage. 2002;15:1–15. doi: 10.1006/nimg.2001.0933. - DOI - PubMed
    1. Cox RW. AFNI: software for analysis and visualization of functional magnetic resonance neuroimages. Comput. Biomed. Res. 1996;29:162–173. doi: 10.1006/cbmr.1996.0014. - DOI - PubMed

Publication types