. 2019 Mar 21;10(1):1322.
doi: 10.1038/s41467-019-09160-7.

Neutrophil activation and NETosis are the major drivers of thrombosis in heparin-induced thrombocytopenia

Affiliations

Neutrophil activation and NETosis are the major drivers of thrombosis in heparin-induced thrombocytopenia

José Perdomo et al. Nat Commun. .

Abstract

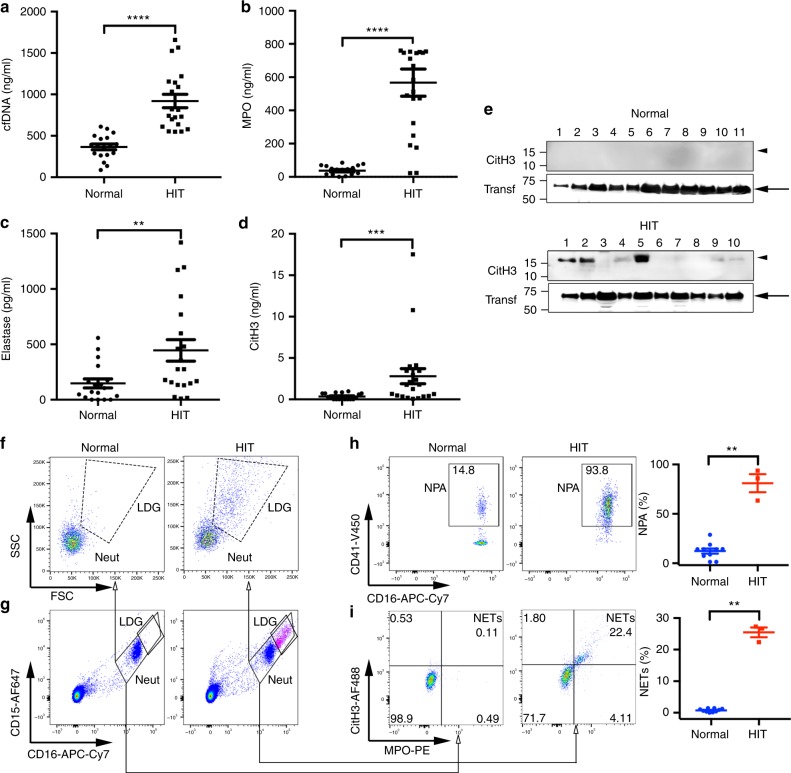
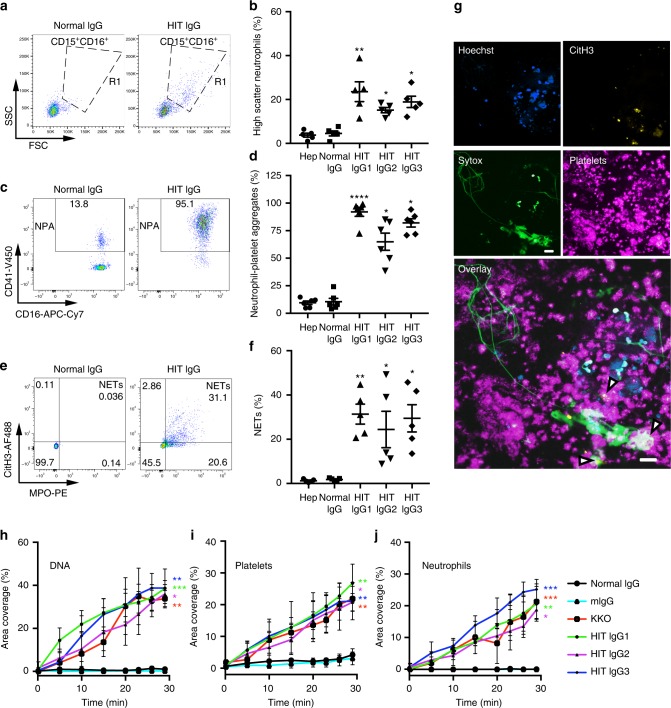
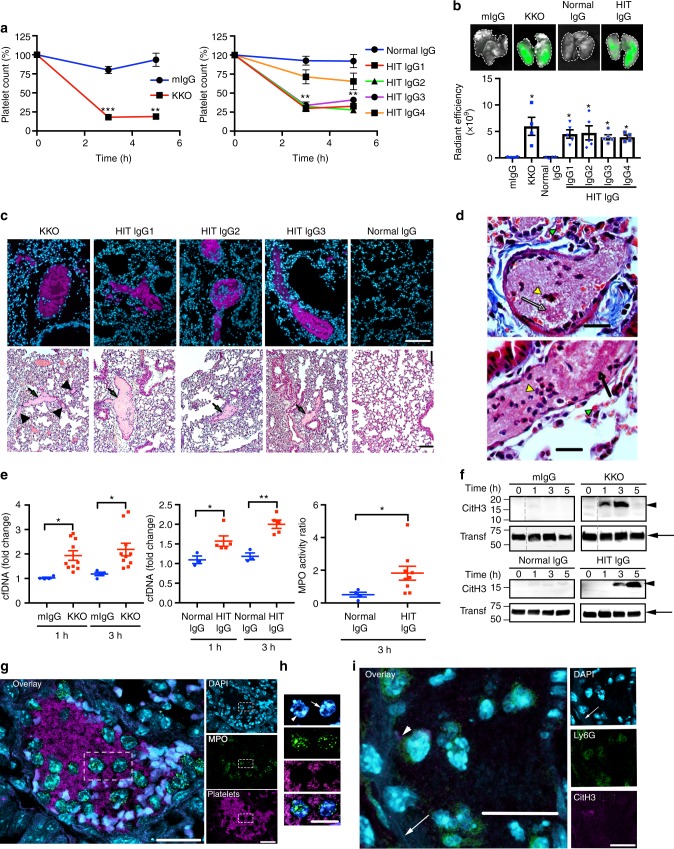
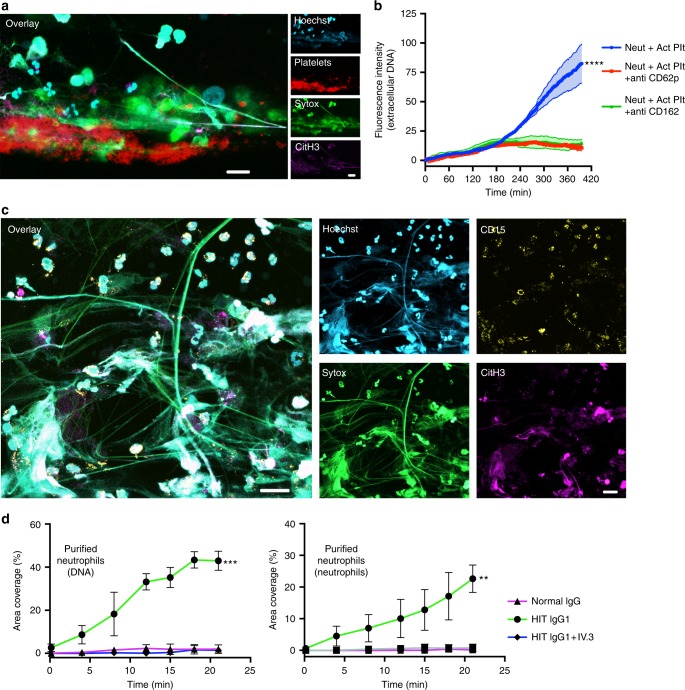
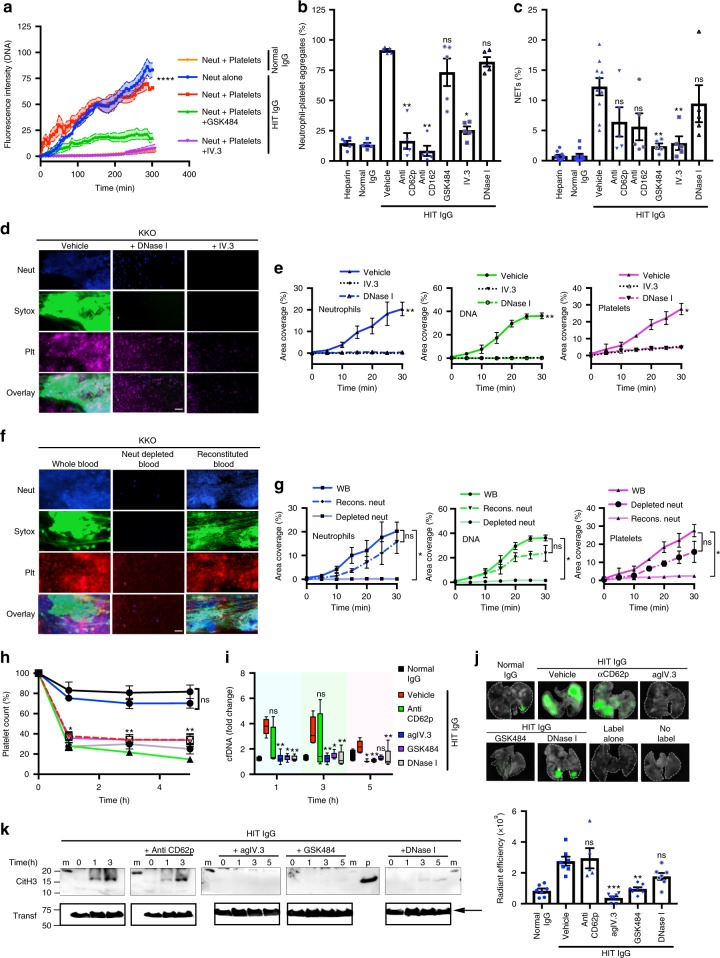
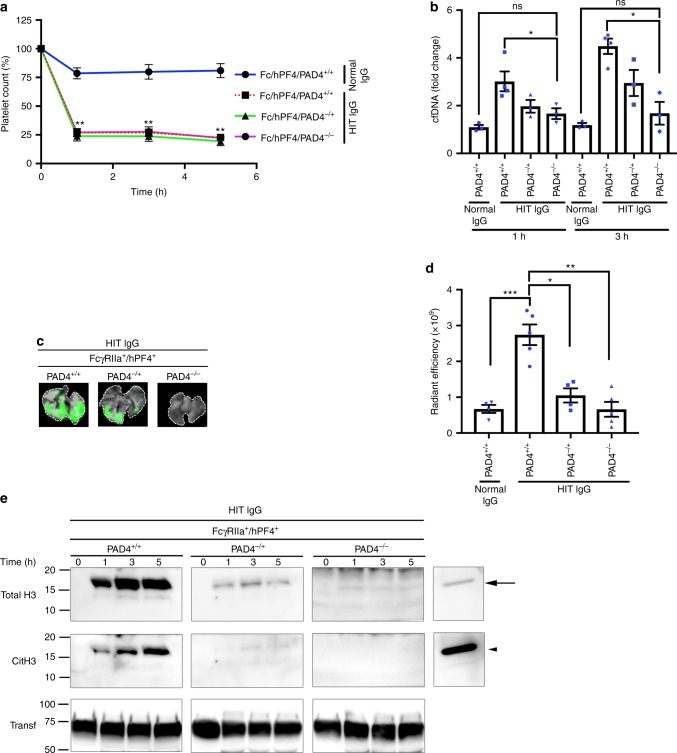
Heparin-induced thrombocytopenia/thrombosis (HIT) is a serious immune reaction to heparins, characterized by thrombocytopenia and often severe thrombosis with high morbidity and mortality. HIT is mediated by IgG antibodies against heparin/platelet factor 4 antigenic complexes. These complexes are thought to activate platelets leading to thrombocytopenia and thrombosis. Here we show that HIT immune complexes induce NETosis via interaction with FcγRIIa on neutrophils and through neutrophil-platelet association. HIT immune complexes induce formation of thrombi containing neutrophils, extracellular DNA, citrullinated histone H3 and platelets in a microfluidics system and in vivo, while neutrophil depletion abolishes thrombus formation. Absence of PAD4 or PAD4 inhibition with GSK484 abrogates thrombus formation but not thrombocytopenia, suggesting they are induced by separate mechanisms. NETs markers and neutrophils undergoing NETosis are present in HIT patients. Our findings demonstrating the involvement of NETosis in thrombosis will modify the current concept of HIT pathogenesis and may lead to new therapeutic strategies.


Conflict of interest statement

The authors declare no competing interests.

Figures

Fig. 1
Fig. 1
NETs are present in HIT patients. a cfDNA in HIT patients’ plasma (n = 21) relative to normal controls (n = 18) was detected using PicoGreen dsDNA fluorescence assay. b MPO levels in HIT patients’ plasma (n = 21) and normal controls (= 18) were measured by ELISA. c Neutrophil elastase concentration in patients’ plasma (n = 20) relative to normal controls (n = 18) and d CitH3 levels in HIT patients’ plasma (n = 21) relative to normal controls (n = 18) was determined by ELISA. e Western blot images of CitH3 probed with anti-CitH3 antibody in normal controls and HIT patients’ plasma. Each lane represents a different donor’s plasma. Transferrin (Transf) was used as a loading control. Arrowhead indicates CitH3 band. Arrow denotes transferrin. f Representative flow cytometry density plots using fresh blood backgated for neutrophils (CD15+ CD16+ population shown in g). g Flow cytometric determination of neutrophils (CD15+ CD16+ population, Neut.). LDGs within the Neut population are shown. h Neutrophil–platelet aggregates (CD41+ events within the CD15+ CD16+ population). The graph shows the quantification of the flow cytometry data shown on the left in healthy controls (n = 10) and HIT patients (n = 3). NPA, neutrophil–platelet aggregates. i Representative dotplot of NETs present in vivo in healthy controls (left panels) and HIT patients (middle panel). The numbers in the quadrants indicate percentage of gated events. NETs were defined as CitH3 and MPO double positive events within the CD15+ CD16+ population. The graph shows the quantification of the flow cytometry data shown on the left in healthy controls (n = 10) and HIT patients (n = 3). Statistics, Mann–Whitney test. *P < 0.05; **P < 0.01; ****P < 0.0001. Mean ± s.e.m. shown in all graphs. LDG, low-density granulocytes, Neut, neutrophils. Source data for (a, b, c, d, e, h, i) are provided as a Source Data file
Fig. 2
Fig. 2
HIT patients’ IgG induces NETosis. a Representative flow cytometry density plots of side scatter (SSC) versus forward scatter (FSC) backgated for neutrophils (CD15+ CD16+ population). b Quantification of high-scatter neutrophils using IgG from three HIT patients repeated with blood from different healthy donors (n = 5). c Neutrophil–platelet aggregates (NPA) induced in whole blood by HIT IgG in the presence of heparin (0.5 U/ml), and (d) quantification of NPA using IgG from three HIT patients repeated with blood from different healthy donors (n = 6). e Representative flow cytometry scatter plots of NETs induced in whole blood by HIT IgG plus heparin. The numbers in the quadrants indicate percentage of gated events. f Quantification of NETs using IgG from three HIT patients with blood from different healthy donors (n = 5). g Citrullinated histone H3 is present in HIT IgG-induced thrombi ex vivo. DNA in nucleated cells was stained with Hoechst 33342 (blue), extracellular DNA with Sytox green (green), CitH3 with anti-CitH3 Alexa 594 (yellow) and platelets with anti-CD41 Alexa 647 (magenta). White areas indicate superposition of signals. White arrowheads indicate areas of CitH3 staining. Images were taken with a confocal laser-scanning microscope (Leica TCS SP8) with a ×40 water immersion objective running Leica’s LAS X software. Scale bar: 20 μm. h–j Graphs represent percentage area coverage of VWF-coated surfaces versus time for (h) the extracellular DNA (Sytox+ areas), (i) platelets (CD41+) and (j) neutrophils (CD15+). Percentage coverage area determinations were calculated for the times indicated. Mean ± s.d are shown; n = 3. Statistical analyses, for (b, d, f) Kruskal–Wallis test followed by Holm’s Stepdown Bonferroni procedure for adjusted p-values. Data are expressed as mean ± s.e.m. For (h, i, j), one-way ANOVA relative to normal IgG with Dunnett’s post-test. *P < 0.05; **P < 0.01; ***P < 0.001 relative to normal IgG. Mean ± s.d. are shown. Source data for (b, d, f, h, i, j) are provided as a Source Data file
Fig. 3
Fig. 3
HIT IgG induces thrombosis and NETs in a HIT mouse model. a FcγRIIa+/hPF4+ mice were injected with KKO or control mouse IgG (n = 3, left panel) or HIT patients’ IgG or normal IgG (n = 4, right panel). Heparin administered at 1U/g. Platelet percentage was calculated relative to basal levels. b Images of mouse lungs harvested 5 h after treatment. Green fluorescence indicates anti-CD42c Dylight 649 platelet clots in lungs. Graph of lung fluorescence from mice treated in (a) (n = 4. For IgG1-3, n = 5). c Lung sections from mice treated as in (b). Upper panels show platelet-rich thrombi (magenta) which are present in all cases except with normal IgG. Blue, nuclei. Lower panels, H&E staining. Arrows indicate clots. Arrowheads show small clots in KKO-treated mice. 10X objective. Scale bar, 100 μm. d Carstair’s staining of KKO- (upper panel) or HIT IgG- (lower panel) induced thrombi in mouse lungs. Fibrin (orange–red, arrows); leucocytes (dark blue, yellow arrowheads); red blood cells (yellow–red, green arrowheads). Platelets (grey–blue) are mixed with fibrin. Scale bar: 20 μm. e cfDNA and MPO activity. Fold change in cfDNA in mouse plasma 1 h or 3 h after treatment with KKO (n = 10) or control mouse IgG (mIgG, n = 4) (left panel) or patient’s HIT IgG (n = 5) or normal control (n = 3, middle panel). Ratio of MPO activity at 3 h relative to time 0 following treatment with HIT IgG (n = 9) or normal control (n = 4, right panel). f Representative western blots of CitH3 in plasma from mice treated in (a). Arrowhead; CitH3. Arrow; transferrin (transf, loading control). Dotted lines: removal of irrelevant lanes. g Thrombi in mouse lung imaged by confocal microscopy. Platelets (magenta), nucleated cells (blue), MPO (green). Scale bar: 20 μm. h Magnified details of dotted area in g of nuclei (arrowhead) and decondensed neutrophil nucleus (arrow). Other panels denote MPO, platelets and overlay images, respectively. Scale bar: 10 μm. i Neutrophils were stained with Ly6G (green), CitH3 (magenta) and DNA (blue). Arrow, extracellular DNA; arrowhead, CitH3. Scale bar: 20 μm. Statistical analyses, (a, e) Mann–Whitney test. b Kruskal–Wallis test. p-values adjusted relative to normal IgG. Mean ± s.e.m. *P < 0.05; **P < 0.01; ***P < 0.001. Source data for (a, b, e, f) are provided as a Source Data file
Fig. 4
Fig. 4
HIT IgG induces NETosis via activated platelets and by direct neutrophil activation. a Platelets and neutrophils were resuspended in autologous plasma at a 20:1 ratio and incubated with KKO plus heparin at 37 °C for 1 h, platelets were stained with anti-CD41 Alexa 647 (red), neutrophils with Hoechst (blue), extracellular DNA with Sytox green (green), and CitH3 with anti-CitH3 Alexa 594 (magenta) and then perfused on VWF-coated microchannels at a shear stress of 67 dynes/cm2 at 37 °C for up to 20 min. Samples were fixed at the end of the experiment. Panels show confocal images of a representative thrombus of three individual experiments, using different donors imaged with a 63x oil immersion objective. Scale bar: 20 μm. b Purified neutrophils were supplemented with HIT complex-activated platelets in the absence or presence of anti-CD62p or anti-CD162 and incubated at 37 °C. DNA release was monitored by confocal microscopy for over 5 h by Sytox green fluorescence. Total DNA, Hoechst staining. The graph shows the fluorescence intensity ratio of extracellular DNA/total DNA vs. time (n = 3). c Purified neutrophils were resuspended in autologous plasma and incubated with KKO plus heparin at 37 °C for 1.5 h. Neutrophils were stained with anti-CD15 Alexa 647 (yellow), DNA with Hoechst (blue), the extracellular DNA with Sytox green (green) and CitH3 with anti-CitH3 Alexa 594 (magenta) and perfused on P-selectin-coated microchannels at a shear stress of 67 dynes/cm2 at 37 °C for up to 30 min. Samples were fixed at the end of the experiment. The panels show confocal images of a representative thrombus of three individual experiments, using different donors imaged with a ×40 water immersion objective. Scale bar: 20μm. d Percentage area coverage versus time of P-selectin-coated surfaces perfused with purified neutrophils in the presence of HIT IgG, normal IgG or HIT IgG plus IV.3 antibody (all in the presence of heparin). DNA (left panel), neutrophils (right panel). n = 3; Mean ± s.d. is shown. Statistics: one-way ANOVA with Tukey’s correction for multiple comparisons. **P < 0.01; ***P < 0.001; ****P < 0.0001. Source data for (b, d) are provided as a Source Data file
Fig. 5
Fig. 5
NETosis is required for thrombus formation in HIT. a Neutrophils plus platelets were treated with PF4, heparin and normal IgG (n = 4, orange), or HIT IgG plus heparin without (n = 3, red) or with GSK484 (n = 5, green) or IV.3 antibody (n = 4, magenta). Treated neutrophils alone are also shown (n = 4, blue). The extracellular DNA release determined as in Fig. 4b. Mean ± s.e.m. b Quantification of neutrophil–platelet aggregates, mean ± s.e.m. c NETs after 5 h treatment with antibodies and inhibitors, mean ± s.e.m. Fluorescent microscopy images of thrombi in microchannels. d Blood pre-treated with KKO plus heparin plus vehicle control, DNase I or IV.3. Neutrophils (anti-CD15 AF594, left panel, blue), nucleated cells (Hoechst, middle panel, blue), the extracellular DNA (Sytox green, green) and platelets (anti-CD41 AF647, magenta). Scale bar: 50 μm. e Area coverage of neutrophils, DNA and platelets. n = 3, mean ± s.d. f Whole blood (WB) (left panels), neutrophil (Neut) depleted blood (middle panels) or depleted blood reconstituted (recons) with autologous neutrophils (right panels) incubated with KKO and heparin, treated as described in (d). Plt, platelets; Scale bar: 50 μm. g Quantification as in (e), n = 3, mean ± s.d. h FcγRIIa+/hPF4+ mice treated with normal (n = 5, black) or HIT IgG plus heparin plus vehicle control (n = 7, dotted red) or anti-CD62p (n = 3, green), agIV.3 antibody (n = 8, blue), GSK484 (n = 8, magenta) or DNase I (n = 8, grey). Mean ± s.e.m. i Box-and-whiskers plot of cfDNA in mouse plasma described in (h) (n = 4 for normal IgG, anti-CD62p; n = 5 for DNase I; n = 6 for vehicle, IV.3, GSK484). Middle line, bounds of box and whiskers represent the median, 25th to 75th percentiles, and minimum and maximum values, respectively. j Mouse lungs imaged as described in (3b) and plot of fluorescence intensity. Mean ± s.e.m. k Representative western blots of mouse plasma described in (h) probed with anti-CitH3 antibody. Arrowhead, CitH3. Arrow, transferrin (transf, loading control). Statistics: (b, c, h, i, j) Kruskal–Wallis test for comparison of groups with versus without inhibitor. P-values adjusted relative to HIT IgG (vehicle). e, g one-way ANOVA with Tukey’s correction for multiple comparisons. *P < 0.05; **P < 0.01; ***P < 0.001; ****P < 0.0001; ns, not significant. Source data for (a, b, c, e, g, h, i, j, k) are provided as a Source Data file
Fig. 6
Fig. 6
PAD4-deficient mice are protected from HIT IgG-induced thrombosis. a FcγRIIa+/hPF4+ double transgenic mice wild-type, heterozygous or knockout for PAD4 (PAD4+/+, PAD4−/+ or PAD4−/−, respectively) were injected intravenously with normal IgG or HIT IgG. Heparin was injected in all cases intraperitoneally at 1 U/g. Platelets were counted at the time points indicated. The percentage of platelets was calculated relative to basal levels. Data are expressed as means ± s.e.m. (n = 5). b cfDNA in plasma of FcγRIIa+/hPF4+/PAD4+/+ (n = 4), FcγRIIa+/hPF4+/PAD4-/+ (n = 3) and FcγRIIa+/hPF4+/PAD4/− (n = 3) mice 1 h and 3 h after normal IgG (n = 3) or HIT IgG plus heparin treatment. Mean ± s.e.m. c Representative images of mouse lungs for FcγRIIa+/hPF4+/PAD4+/+, FcγRIIa+/hPF4+/PAD4−/+ and FcγRIIa+/hPF4+/PAD4/− imaged as described in Fig. 3b. d Graphical representation of fold changes in fluorescence intensity (radiant efficiency) in lungs from FcγRIIa+/hPF4+/PAD4+/+ (n = 5), FcγRIIa+/hPF4+/PAD4−/+ (n = 4) and FcγRIIa+/hPF4+/PAD4/ (n = 5) mice described in (a). Mean ± s.e.m. e Western blots (representative of four independent experiments) of CitH3 in plasma of the transgenic mice described in (a) probed with anti-total H3 and anti-CitH3 antibody at the indicated times after treatment with HIT IgG plus heparin. Transferrin was used as a loading control. Arrow denotes total H3. Arrowhead indicates CitH3. Transf, transferrin. Kruskal–Wallis test and P-values adjusted by Holm’s Stepdown Bonferroni procedure relative normal IgG were used for statistical analyses. *P < 0.05; **P < 0.01; ***P < 0.001. ns not significant. Source data for (a, b, d, e) are provided as a Source Data file

References

    1. Chong BH, Isaacs A. Heparin-induced thrombocytopenia: what clinicians need to know. Thromb. Haemost. 2009;101:279–283. doi: 10.1160/TH08-10-0659. - DOI - PubMed
    1. Warkentin TE. Clinical picture of heparin-induced thrombocytopenia (HIT) and its differentiation from non-HIT thrombocytopenia. Thromb. Haemost. 2016;116:813–822. doi: 10.1160/TH16-06-0435. - DOI - PubMed
    1. Chong BH, Chong JJ. Heparin-induced thrombocytopenia. Expert. Rev. Cardiovasc. Ther. 2004;2:547–559. doi: 10.1586/14779072.2.4.547. - DOI - PubMed
    1. Warkentin, T. E. in Hematology 7th edn. (eds Hoffman, R. et al.) 1973–1983 (Elsevier, PA, 2018).
    1. Chong BH. Heparin-induced thrombocytopenia. J. Thromb. Haemost. 2003;1:1471–1478. doi: 10.1046/j.1538-7836.2003.00270.x. - DOI - PubMed

Publication types

MeSH terms