. 2019 Mar 21;10(1):1298.
doi: 10.1038/s41467-019-09199-6.

The exonuclease Xrn1 activates transcription and translation of mRNAs encoding membrane proteins

Affiliations

The exonuclease Xrn1 activates transcription and translation of mRNAs encoding membrane proteins

Bernat Blasco-Moreno et al. Nat Commun. .

Abstract

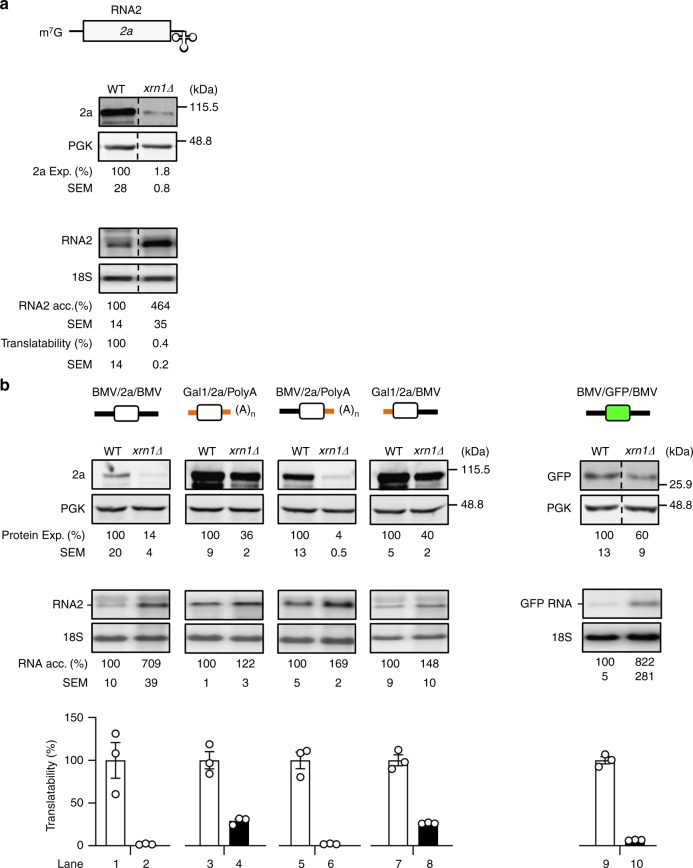
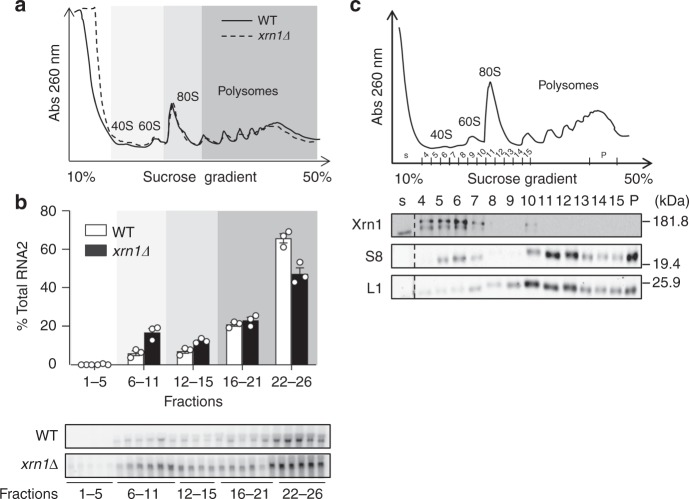
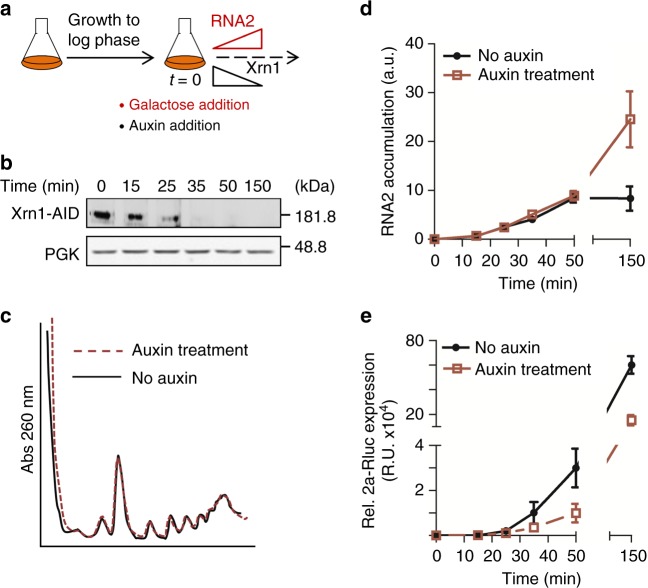
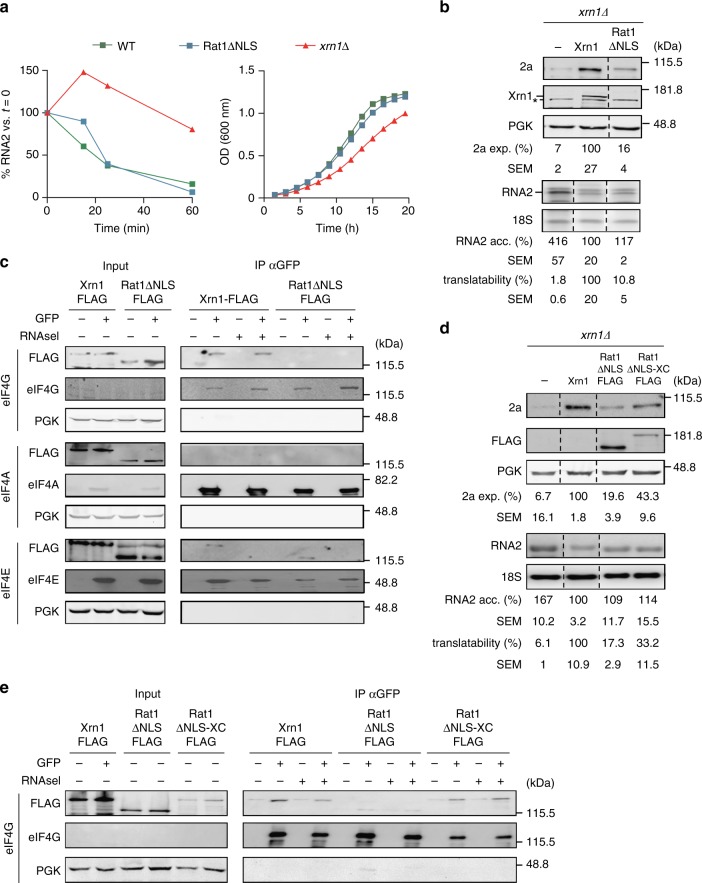
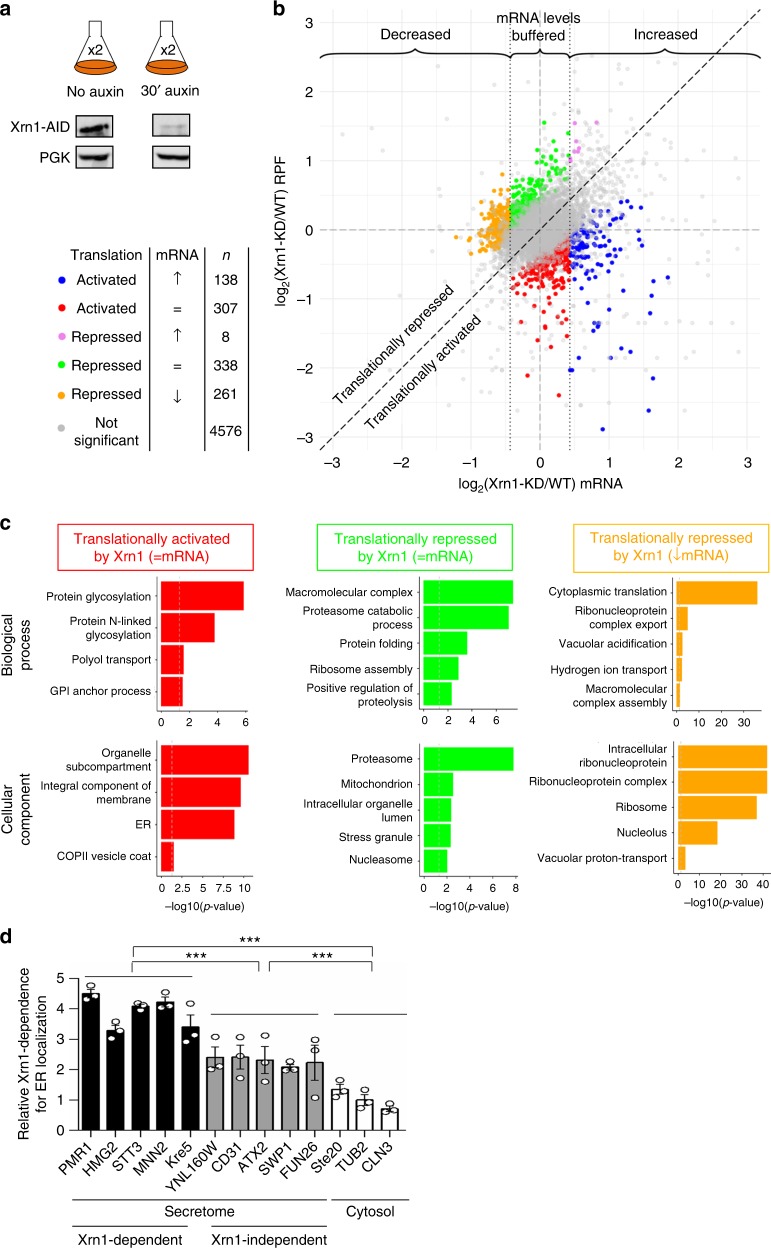
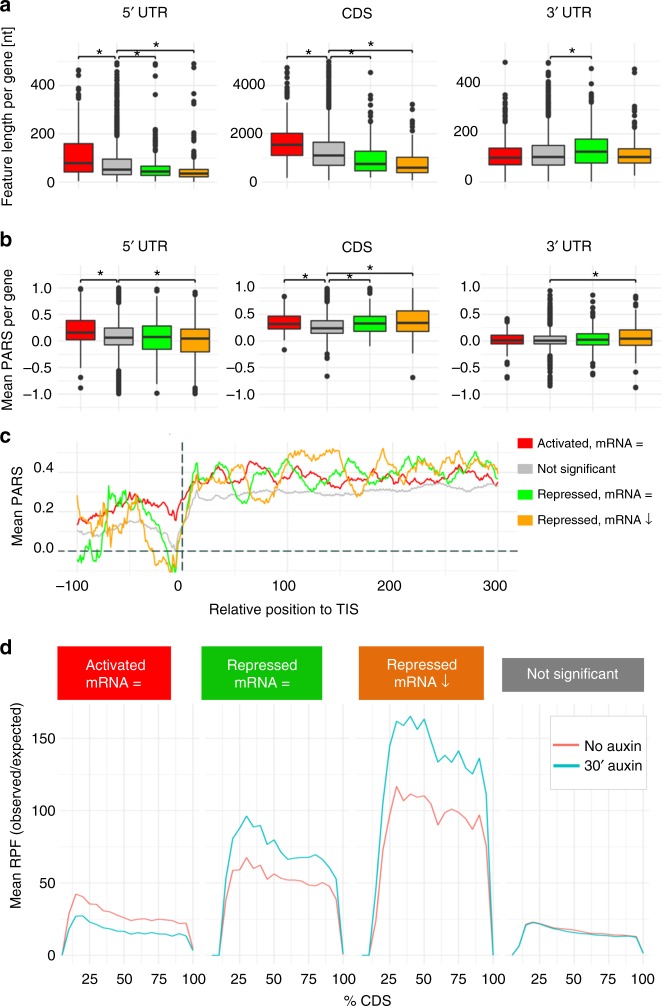
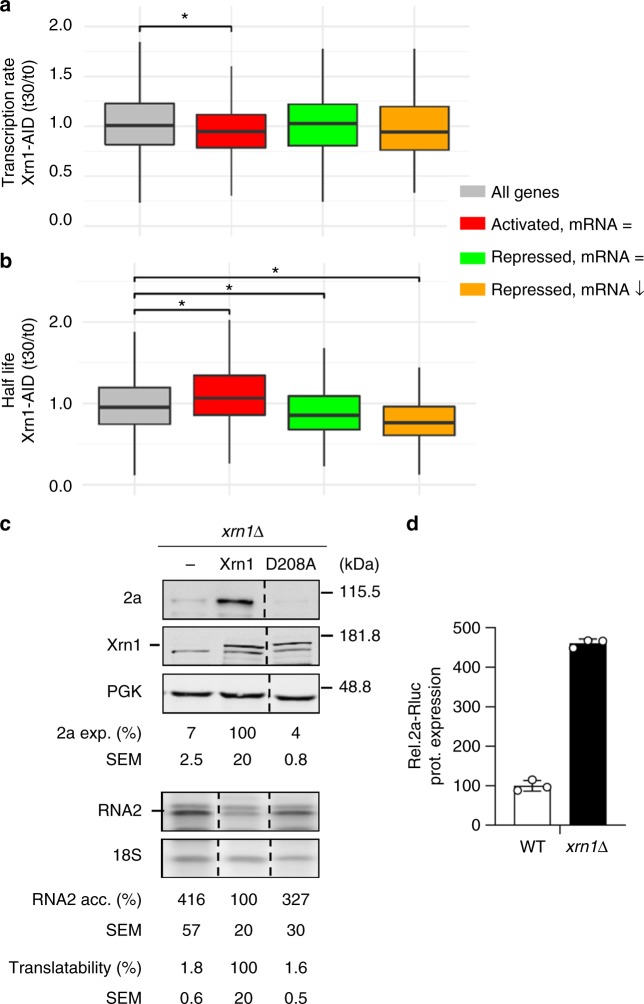
The highly conserved 5'-3' exonuclease Xrn1 regulates gene expression in eukaryotes by coupling nuclear DNA transcription to cytosolic mRNA decay. By integrating transcriptome-wide analyses of translation with biochemical and functional studies, we demonstrate an unanticipated regulatory role of Xrn1 in protein synthesis. Xrn1 promotes translation of a specific group of transcripts encoding membrane proteins. Xrn1-dependence for translation is linked to poor structural RNA contexts for translation initiation, is mediated by interactions with components of the translation initiation machinery and correlates with an Xrn1-dependence for mRNA localization at the endoplasmic reticulum, the translation compartment of membrane proteins. Importantly, for this group of mRNAs, Xrn1 stimulates transcription, mRNA translation and decay. Our results uncover a crosstalk between the three major stages of gene expression coordinated by Xrn1 to maintain appropriate levels of membrane proteins.


Conflict of interest statement

The authors declare no competing interests.

Figures

Fig. 1
Fig. 1
Xrn1 drives translation of BMV RNA. a Xrn1 depletion inhibits BMV RNA2 translation. Simultaneously exposed western blot and northern blot panels showing steady-state levels of viral protein 2a and RNA2. b The BMV RNA2 5ʹUTR and CDS confer dependence on Xrn1 for translation. Black solid lines represent viral UTRs and orange lines GAL1 mRNA 5ʹ and ADH1 3ʹUTRs. The white and green boxes represent 2a and GFP CDSs, respectively. Throughout this study, BMV RNA2 was expressed from a plasmid by the GAL1 promoter, PGK protein, and 18 S RNA were used as loading controls for western and northern blots, respectively. Values denote expression relative to WT, taken arbitrarily as 100% and are calculated from n = 3 independent colonies and expressed as mean ± SEM. Dotted lines represent a separation of the shown samples in the same membrane. Open circles indicate the individual data points. Source data are provided as a Source Data file
Fig. 2
Fig. 2
Xrn1 depletion shifts RNA2 toward single ribosomal subunits fractions. a ultraviolet (UV) absorbance rRNA profile at 260 nm of an extract from WT and xrn1∆ cells expressing RNA2 after sedimentation on a 10 to 50% sucrose gradient. b Depletion of Xrn1 shifts BMV RNA2 toward monosomal fractions. Upper panel: distribution of normalized BMV RNA2 accumulation across the profiles. Fractions were grouped into free (1–5), single ribosome subunits (6–11), monosomes (12–15), light polysomes (16–21), and heavy polysomes (22–26). RNA was quantified by northern blot. Results represent averages of n = 3 biological replicates. Error bars represent SEM. Open circles indicate the individual data points. Lower panel: representative northern blots. c Xrn1 cofractionates with free 40s subunits in polysome-profiling analysis. Top panel: UV absorbance rRNA profile at 260 nm of an extract from WT cells. Lower panel: Fractions were TCA-precipitated and analyzed by western blot. Specific antibodies detecting Xrn1p, S8 protein (small ribosomal subunit) and L1 protein (large ribosomal subunit) were used. S lane corresponds to soluble proteins not associated to ribosome subunits and P lane to a pool of three fractions corresponding to polysomes. Source data are provided as a Source Data file
Fig. 3
Fig. 3
Xrn1 depletion leads to immediate defects on viral RNA2 translation. a Scheme of the experimental set-up to simultaneously deplete Xrn1-AID and express viral 2a-Rluc. b Expression of Xrn1-AID upon addition of auxin to the media. c UV absorbance profile at 260 nm of an extract from the Xrn1-AID strain before and after 35 min of auxin addition. d Relative RNA2-Rluc RNA accumulation, obtained by quantifying RNA level by RT-qPCR (arbitrary units (a.u)) and e Relative 2a-Rluc protein expression (R.U.) before and after galactose and auxin addition. Results represent averages obtained from n = 3 biological replicates. Error bars represent SEM. Source data are provided as a Source Data file
Fig. 4
Fig. 4
Xrn1-dependence for translation is specific and mediated by the interaction with eIF4G. a Rat1∆NLS fully replaces Xrn1 in mRNA decay and cell proliferation. xrn1∆ cells expressing BMV RNA2 under GAL1 promoter and either WT Xrn1, Rat1∆NLS or an empty plasmid were grown in galactose. Left, transcription of RNA2 was shut-off upon glucose addition and BMV RNA2 stability was determined by monitoring RNA2 levels by northern blot analysis at various time-points post-glucose addition. A representative example out of three replicates is shown. Right, growth curves in galactose media. Results represent averages obtained from three replicates. b Rat1∆NLS does not replace Xrn1 in RNA2 translation. Western blot (upper panel) and northern blot (lower panel) analysis showing steady-state levels of viral protein 2a and viral RNA2 in xrn1∆ cells expressing Xrn1 or Rat1∆NLS. Asterisk points at a non-specific band. Quantifications are relative to xrn1∆ transformed with WT Xrn1 plasmid. Results represent averages of n = 3 biological replicates. c Xrn1 interacts with eIF4G. Western blot analysis of immunoprecipitation assays. Xrn1-FLAG and Rat1∆NLS-FLAG proteins were expressed in yeast strains expressing either eIF4G-GFP, eIF4A-GFP, or eIF4E-GFP fusion proteins. As a control, the functionality of GFP-fused strains was assessed (Supplementary Fig. 5). Immunoprecipitations were carried out with GFP-trap beads with extracts treated ( + ) or not treated (−) with RNase A. Expression levels of eIF4G, eIF4A, and eIF4A were detected by anti-GFP antibody. d Expression of Rat1∆NLS-XC rescues BMV RNA2 translation. Western blot (upper panel) and northern blot (lower panel) analysis. Results represent averages of three replicates. Expression levels of flag-tagged Xrn1, Rat1∆NLS, and Rat1∆NLS-XC were analyzed by western blot (Supplementary Fig. 6). e Interaction with eIF4G studied by co-immunoprecipitation analyses. Source data are provided as a Source Data file
Fig. 5
Fig. 5
Xrn1 acts as a translational regulator of cellular mRNAs. a Experimental set-up used for ribosome-profiling analysis. Two duplicates for each condition (no auxin and 30 min with auxin) were included (= 2). Western blot analysis corroborated Xrn1 depletion upon auxin addition. b Analysis of the results from the RNAseq and RPF libraries, comparing untreated cells (WT) to auxin-treated cells (Xrn1-KD). Log2 fold changes in mRNA abundance and ribosome occupancy (RPF) are represented. Vertical dashed lines in black depict the thresholds chosen to consider mRNA levels as stable/buffered ((log2 fold change) < 0.433); see ref. ). A perfect correlation between changes in mRNA and ribosome occupancy levels is indicated by a dashed diagonal line. Gray dots correspond to genes with no significant change in translational control (Riborex FDR ≥ 0.05). Colored dots correspond to genes that show significant changes in translational regulation upon Xrn1 depletion (Riborex FDR < 0.05). These genes are classified into five different subgroups according to their behavior in terms of mRNA and RPF changes. c Gene ontology enrichment analysis (GSEA) of transcripts translationally regulated by Xrn1, focusing on Biological Process and Cellular Component. Colors correspond to the same groups of genes as described in Fig. 5b. At most five significant terms after Revigo redundancy removal are depicted (ordered by p-value). d Xrn1-dependence for translation correlates with Xrn1-dependence for ER localization. The y-axis indicates the ER localization:cytosol-localization in WT (no auxin) related to Xrn1-depleted cells (30 min of auxin treatment). The ratio of specific mRNAs between supernatant and membrane fractions was calculated in WT and xrn1∆ conditions. Xrn1-dependence for ER localization was calculated by dividing [(cc/cm) xrn1∆]/[(cc/cm) WT] (cc = conc. in the cytosol fraction; cm = concentration in the membrane fraction). The values were represented relative to TUB2, which was set to 1. Open circles indicate the individual data points. Values are the mean of n = 3 assays ± SEM. Statistical significance was calculated using a Student’s t-test (***p-value < 0.001). Source data are provided as a Source Data file
Fig. 6
Fig. 6
Features of mRNAs translationally controlled by Xrn1. a, b Box-plot depicting the mean length (a) and the mean PARS score (b) of the 5ʹUTRs, CDSs and 3ʹUTRs for the three subgroups studied and the control group (gray). For boxplots, box boundaries represent the 1st and 3rd quartile of the distribution, while the center line represents the 2nd quartile (median). Whiskers indicate either the most extreme values or extend to 1.5 times the interquartile range starting from the respective box boundary. Black dots indicate outliers (default R parameters). Statistical significance was calculated using a Wilcoxon-test (p-values available in Supplementary Data 4). c Metagene analysis of the PARS scores. Vertical dashed line corresponds to the translation initiation site (TIS). The x-axis represents the nucleotide position relative to the TIS. d Metagene analysis of the average mRNA-normalized RPF coverage along the CDS for activated (red, mRNA=), repressed (green, mRNA = and orange, mRNA ↓), and not affected mRNAs (gray). A light red line corresponds to untreated cells, whereas turquoise corresponds to treatment with auxin for 30 min
Fig. 7
Fig. 7
Xrn1 functions in mRNA transcription, decay, and translation are linked. a Transcription rates and b half-lives of the studied mRNA groups. Statistical significance was calculated using a Wilcoxon-test (*represents p-value < 0.001) The results represent an average of n = 3 biological replicates. For boxplots, box boundaries represent the 1st and 3rd quartile of the distribution, while the center line represents the 2nd quartile (median). Whiskers indicate either the most extreme values or extend to 1.5 times the interquartile range starting from the respective box boundary. c Xrn1 D208A effect on BMV RNA2 translation. d When introduced directly into the cytosol by electroporation, RNA2 does not depend on Xrn1 for translation. RNA2-Rluc mRNA and a control mRNA expressing Fluc were directly electroporated into the cytosol. 2a-Rluc protein values were normalized by those of Fluc and represented in comparison to the WT. Quality controls for RNA integrity and capping were performed (Supplementary Fig. 12). The results represent an average of n = 3 biological replicates ± SEM. Open circles indicate the individual dot plots. Source data are provided as a Source Data file

References

    1. Haimovich G, et al. Gene expression is circular: factors for mRNA degradation also foster mRNA synthesis. Cell. 2013;153:1000–1011. doi: 10.1016/j.cell.2013.05.012. - DOI - PubMed
    1. Medina DA, et al. Cytoplasmic 5’−3’ exonuclease Xrn1p is also a genome-wide transcription factor in yeast. Front. Genet. 2014;5:1. doi: 10.3389/fgene.2014.00001. - DOI - PMC - PubMed
    1. Sun M, et al. Global analysis of eukaryotic mRNA degradation reveals xrn1-dependent buffering of transcript levels. Mol. Cell. 2013;52:52–62. doi: 10.1016/j.molcel.2013.09.010. - DOI - PubMed
    1. Pérez-Ortín JE, Alepuz P, Chávez S, Choder M. Eukaryotic mRNA decay: methodologies, pathways, and links to other stages of gene expression. J. Mol. Biol. 2013;425:3750–3775. doi: 10.1016/j.jmb.2013.02.029. - DOI - PubMed
    1. Nagarajan VK, Jones CI, Newbury SF, Green PJ. XRN 5’→3’ exoribonucleases: Structure, mechanisms and functions. Biochim. Biophys. Acta. 2013;182:590–603. doi: 10.1016/j.bbagrm.2013.03.005. - DOI - PMC - PubMed

Publication types

MeSH terms