. 2019 Mar 21;10(1):1319.
doi: 10.1038/s41467-019-09328-1.

Polarization-state-resolved high-harmonic spectroscopy of solids

Affiliations

Polarization-state-resolved high-harmonic spectroscopy of solids

N Klemke et al. Nat Commun. .

Abstract

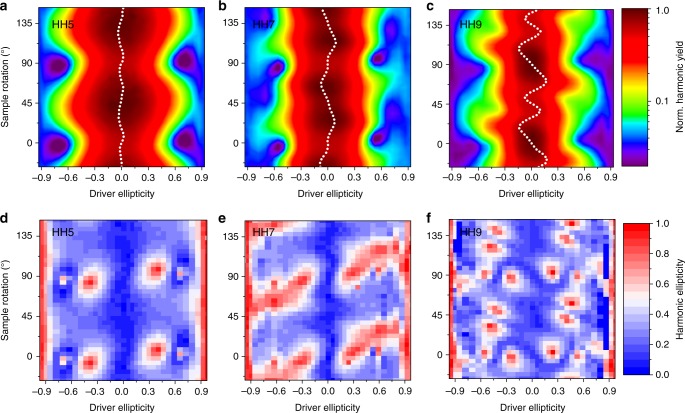
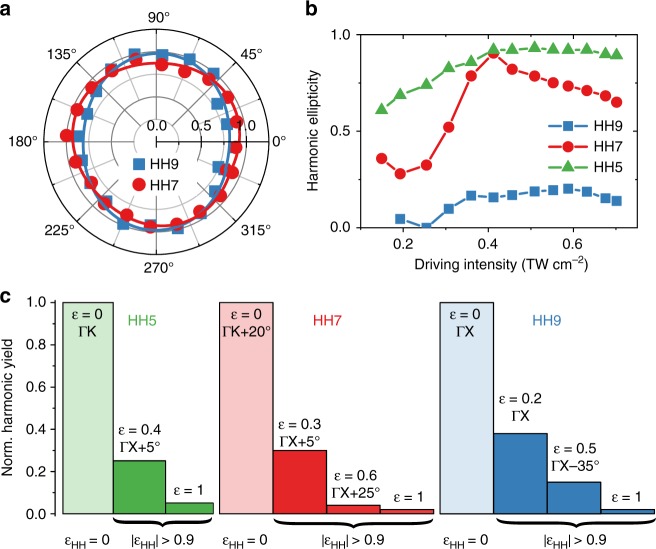
Attosecond metrology sensitive to sub-optical-cycle electronic and structural dynamics is opening up new avenues for ultrafast spectroscopy of condensed matter. Using intense lightwaves to precisely control the fast carrier dynamics in crystals holds great promise for next-generation petahertz electronics and devices. The carrier dynamics can produce high-order harmonics of the driving field extending up into the extreme-ultraviolet region. Here, we introduce polarization-state-resolved high-harmonic spectroscopy of solids, which provides deeper insights into both electronic and structural sub-cycle dynamics. Performing high-harmonic generation measurements from silicon and quartz, we demonstrate that the polarization states of the harmonics are not only determined by crystal symmetries, but can be dynamically controlled, as a consequence of the intertwined interband and intraband electronic dynamics. We exploit this symmetry-dynamics duality to efficiently generate coherent circularly polarized harmonics from elliptically polarized pulses. Our experimental results are supported by ab-initio simulations, providing evidence for the microscopic origin of the phenomenon.


Conflict of interest statement

The authors declare no competing interests.

Figures

Fig. 1
Fig. 1
High-harmonic response of silicon versus driving pulse ellipticity and sample rotation. Measured intensity and harmonic ellipticity |εHH| of HH5 (a, d), HH7 (b, e), and HH9 (c, f) as a function of driver ellipticity and sample rotation. The white dotted lines in ac indicate the centers of mass (×5 to enhance visibility of the variation) of the intensity distributions. 0° and 90° sample rotation correspond to driver major axis along ΓX, 45° and 135° along ΓK. The peak driving intensity is 0.6 TW cm−2 in vacuum
Fig. 2
Fig. 2
Measured circular harmonics from a circular driver and selection rules. Normalized harmonic intensity versus polarizer rotation angle from silicon (a) and quartz (b), showing circular harmonics. The solid lines are sin-square fits. c Intensity of HH3 and HH4 from quartz versus driver ellipticity. Harmonic major-axis rotation after a second quarter-wave plate for silicon (d) and quartz (e), indicating alternating helicities (RHCP/LHCP, right/left-handed circular polarization) with harmonic order, consistent with selection rules. f Harmonic ellipticities |εHH| from Si versus sample rotation
Fig. 3
Fig. 3
Measured circular harmonics from elliptical driver pulses in Si. a Polarizer scan of HH9 (ε = 0.5, θ = ΓX + 30°) and HH7 (ε = 0.3, θ = ΓX + 5°). The solid lines are sin-square fits. b Harmonic ellipticities |εHH| versus driving intensity for ε = 0.4 and θ = ΓX + 10°. c Yields of HH5–HH9 for exemplary cases of circular harmonic polarization. The harmonic yields are normalized to the maximum harmonic yield for ε = 0 (indicated by the light color bars)
Fig. 4
Fig. 4
Calculated polarization states of the harmonics compared to the experiment. Comparison between TDDFT simulations (solid lines) and experimental results for a the harmonic yield, b the harmonic ellipticity |εHH|, and c the major-axis rotation of the harmonics’ polarization ellipse of HH5 to HH9 versus the driver ellipticity. Here, θ = ΓX. For all plots, the values are interpolated between θ=ΓX-3+2 and averaged over negative and positive ellipticity values. The error bars are the averaged absolute deviations. d TDDFT result for the time-derivative of the electric current yielding HH7, for ε = 0.3 and θ = ΓX + 5°. The red curves show the x- and y-projections of the driving laser field

References

    1. Krausz F, Ivanov M. Attosecond physics. Rev. Mod. Phys. 2009;81:163–233. doi: 10.1103/RevModPhys.81.163. - DOI
    1. Krausz F, Stockman MI. Attosecond metrology: from electron capture to future signal processing. Nat. Phot. 2014;8:205–213. doi: 10.1038/nphoton.2014.28. - DOI
    1. Basov DN, Averitt RD, Hsieh D. Towards properties on demand in quantum materials. Nat. Mater. 2017;81:1077–1088. doi: 10.1038/nmat5017. - DOI - PubMed
    1. Mashiko H, Oguri K, Yamaguchi T, Suda A, Gotoh H. Petahertz optical drive with wide-bandgap semiconductor. Nat. Phys. 2016;12:741–744. doi: 10.1038/nphys3711. - DOI
    1. Schiffrin A, et al. Optical-field-induced current in dielectrics. Nature. 2013;493:70–73. doi: 10.1038/nature11567. - DOI - PubMed

Publication types