. 2019 Mar 21;9(1):4995.
doi: 10.1038/s41598-019-41523-4.

Targeting cellular metabolism to reduce head and neck cancer growth

Affiliations

Targeting cellular metabolism to reduce head and neck cancer growth

Jian Yang et al. Sci Rep. .

Abstract

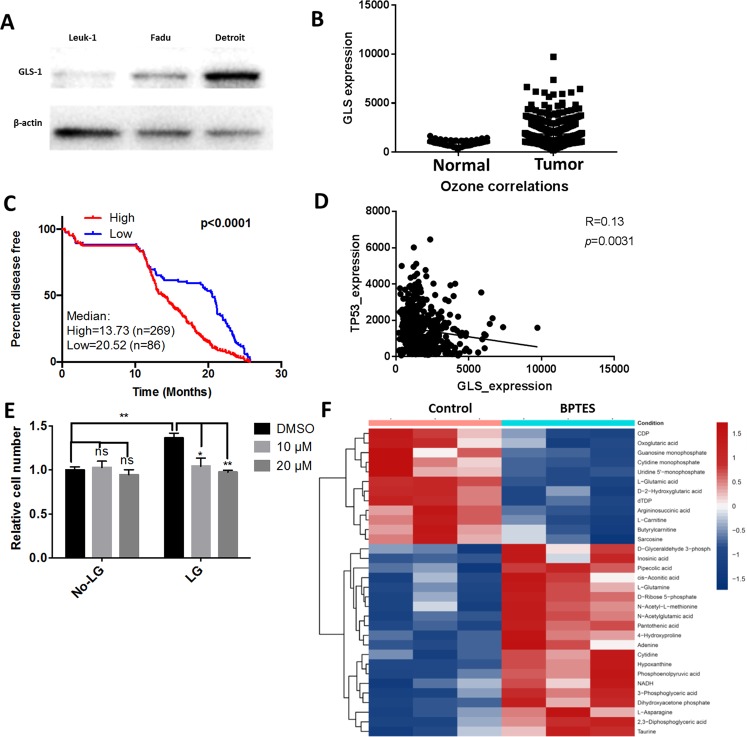
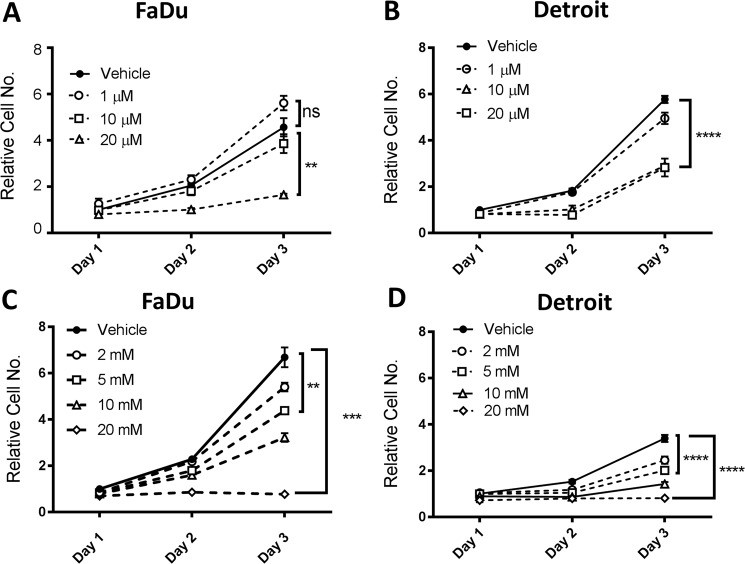
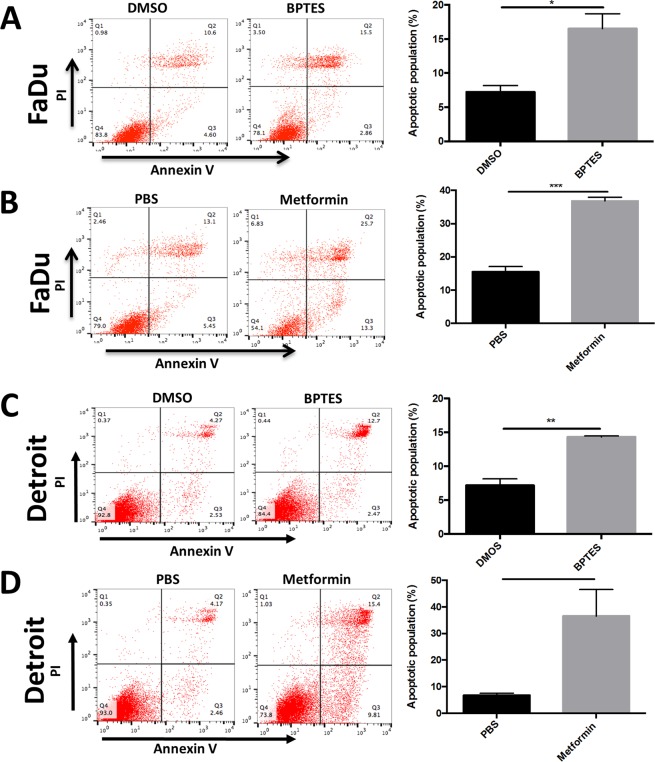
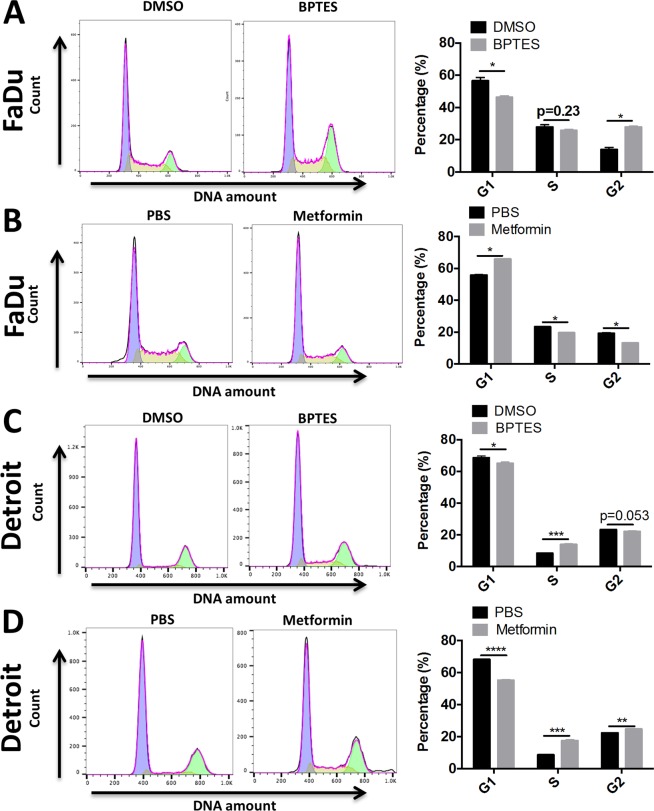
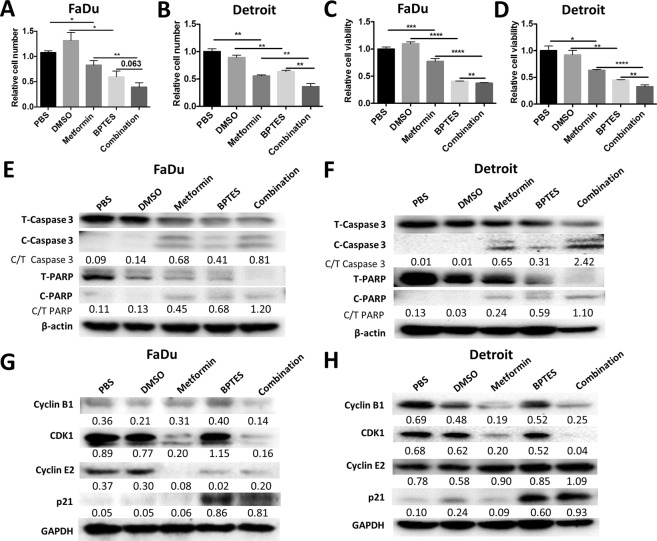
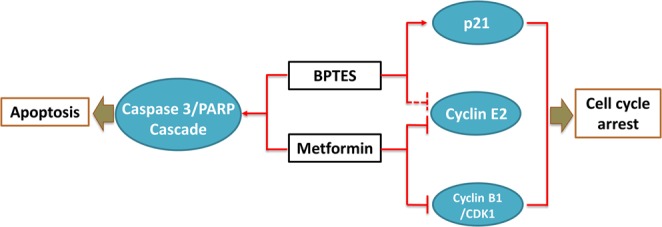
Head and neck squamous cell carcinoma (HNSCC) presents a major public health concern because of delayed diagnosis and poor prognosis. Malignant cells often reprogram their metabolism in order to promote their survival and proliferation. Aberrant glutaminase 1 (GLS1) expression enables malignant cells to undergo increased glutaminolysis and utilization of glutamine as an alternative nutrient. In this study, we found a significantly elevated GLS1 expression in HNSCC, and patients with high expression levels of GLS1 experienced shorter disease-free periods after therapy. We hypothesized that the GLS1 selective inhibitor, bis-2-(5-phenylacetamido-1,3,4-thiadiazol-2-yl)ethyl sulfide (BPTES), which curtails cells' glutamine consumption, may inhibit HNSCC cell growth. Our results support the idea that BPTES inhibits HNSCC growth by inducing apoptosis and cell cycle arrest. Considering that metformin can reduce glucose consumption, we speculated that metformin would enhance the anti-neoplasia effect of BPTES by suppressing malignant cells' glucose utilization. The combination of both compounds exhibited an additive inhibitory effect on cancer cell survival and proliferation. All of our data suggest that GLS1 is a promising therapeutic target for HNSCC treatment. Combining BPTES with metformin might achieve improved anti-cancer effects in HNSSC, which sheds light on using novel therapeutic strategies by dually targeting cellular metabolism.


Conflict of interest statement

The authors declare no competing interests.

Figures

Figure 1
Figure 1
GLS1 is highly expressed in HNSCC. (A) GLS1 expression level in Leuk-1, FaDu and Detroit cell lines were determined by western blotting. β-actin was used as internal control (B) GLS1 expression level in HNSCC patients and normal controls were evaluated using a TCGA cohort. (C) Kaplan-Meier survival curve was generated to show the percentage of disease-free patients of GLS-high and GLS-low subgroups after receiving therapy. (D) Correlation between TP53 and GLS in the TCGA dataset was analyzed Prism Graphpad software. (E) 10,000 of Detroit cells were seeded in 96-well plate and cultured in low glucose (5 mM) DMEM medium supplement with or without L-glutamine (2 mM). Cells were treated with BPTES at indicated concentration for 48 hours. Cell viability was determined using MTT assay. **p < 0.01, ****p < 0.0001. (F) Metabolomics assay was performed using FaDu cell samples treated with control or 10 µM BPETS for 72 hours. DMSO was used as control. Heat-map represents indicated metabolites changes of both groups (N = 3).
Figure 2
Figure 2
BPTES and metformin suppresses the growth of HNSCC. FaDu and Detroit 562 cell lines were used to assess the effects of BPTES and metformin at indicated concentrations. For both cell lines, 10,000 cells were seeded in a 96-well plate and treated with indicated concentrations of BPTES or metformin for 24 hours, 48 hours and 72 hours. The relative live cell numbers were indicated by the absorbance readings after crystal violet staining. (A) FaDu cells treated with Vehicle (DMSO) or BPTES; (B) FaDu cells treated with vehicle (PBS) or metformin; (C) Detroit 562 cells treated with Vehicle (DMSO) or BPTES; (D) Detroit 562 cells treated with vehicle (PBS) or metformin. **p < 0.01, ***p < 0.001, ****p < 0.0001.
Figure 3
Figure 3
BPTES and metformin induces the apoptosis of HNSCC. Equal number (0.5 × 106) of (A,B) FaDu or (C,D) Detroit 562 cells were seeded in 6-well plate and treated with BPTES (20 μM) or metformin (10 mM) for 48 hours. The apoptotic cell population in each well was determined by flow cytometry analysis safter propidium iodide and Annexin V double staining. *p < 0.05, **p < 0.01, ***p < 0.001,
Figure 4
Figure 4
BPTES and metformin induces the cell cycle arrest of FaDu and Detroit cell line. Half-million (A,B) FaDu or (C,D) Detroit cells were seeded in 6-well plate and treated with BPTES (20 μM) or metformin (10 mM) for 48 hours. The cell population in each cell cycle phase was determined by flow cytometry analysis after propidium iodide staining. *p < 0.05, **p < 0.01, ***p ≤ 0.001, ****p < 0.0001.
Figure 5
Figure 5
Combined treatment of BPTES and metformin additively inhibits the cell viability of HNSCC. 10,000 of FaDu or Detroit cells were seeded in 96-well plate and treated with BPTES (20 μM) or metformin (10 mM) or the combination for 48 hours. The cell numbers of FaDu (A) and Detroit (B) cell lines were determined by crystal violet staining. The viability of FaDu (C) and Detroit (D) cells was determined by MTT assay. Apoptotic markers of FaDu (E) and Detroit (F) cells t were determined by western blotting. β-actin was used as internal control. The ratio of cleaved Caspase 3 to total Casepase 3 (C/T Caspase 3), or cleaved PARP to total PARP (C/T PARP) was displayed under the band of indicated treatments. Cell cycle regulatory proteins in FaDu (G) and Detroit (H) cells were determined by western blotting with GAPDH used as internal control. The ratio of indicated protein to internal control was displayed under each band. *p < 0.05, **p < 0.01, ***p < 0.001, ****p < 0.0001.
Figure 6
Figure 6
Schematic model depicting the regulatory effect of BPTES and metformin on cell cycle and apoptosis pathways in HNSCC. BPTES reduces the expression of cyclin E2 (in Fadu cells only) and promotes the expression of p21 to induce G2-phase arrest. Metformin decreases CDK1/Cyclin B1 expression and almost totally eliminates Cyclin E2 expression to induce G1-phase arrest. Both BPTES and metformin are able to initiate apoptosis by inducing the cleavage of Caspase 3/PRAP cascade.

Similar articles

Cited by

References

    1. Ali J, et al. Genetic etiology of oral cancer. Oral oncology. 2017;70:23–28. doi: 10.1016/j.oraloncology.2017.05.004. - DOI - PubMed
    1. Chaturvedi AK, et al. Worldwide trends in incidence rates for oral cavity and oropharyngeal cancers. Journal of clinical oncology: official journal of the American Society of Clinical Oncology. 2013;31:4550–4559. doi: 10.1200/JCO.2013.50.3870. - DOI - PMC - PubMed
    1. Barupal DK, Pinkerton KE, Hood C, Kind T, Fiehn O. Environmental Tobacco Smoke Alters Metabolic Systems in Adult Rats. Chemical research in toxicology. 2016;29:1818–1827. doi: 10.1021/acs.chemrestox.6b00187. - DOI - PMC - PubMed
    1. Rattray NJW, et al. Environmental influences in the etiology of colorectal cancer: the premise of metabolomics. Current pharmacology reports. 2017;3:114–125. doi: 10.1007/s40495-017-0088-z. - DOI - PMC - PubMed
    1. Teicher BA, Linehan WM, Helman LJ. Targeting cancer metabolism. Clinical cancer research: an official journal of the American Association for Cancer Research. 2012;18:5537–5545. doi: 10.1158/1078-0432.CCR-12-2587. - DOI - PMC - PubMed

Publication types

MeSH terms