. 2019 Mar 21;9(1):5017.
doi: 10.1038/s41598-019-41539-w.

Gene Saturation: An Approach to Assess Exploration Stage of Gene Interaction Networks

Affiliations

Gene Saturation: An Approach to Assess Exploration Stage of Gene Interaction Networks

Ziqiao Yin et al. Sci Rep. .

Abstract

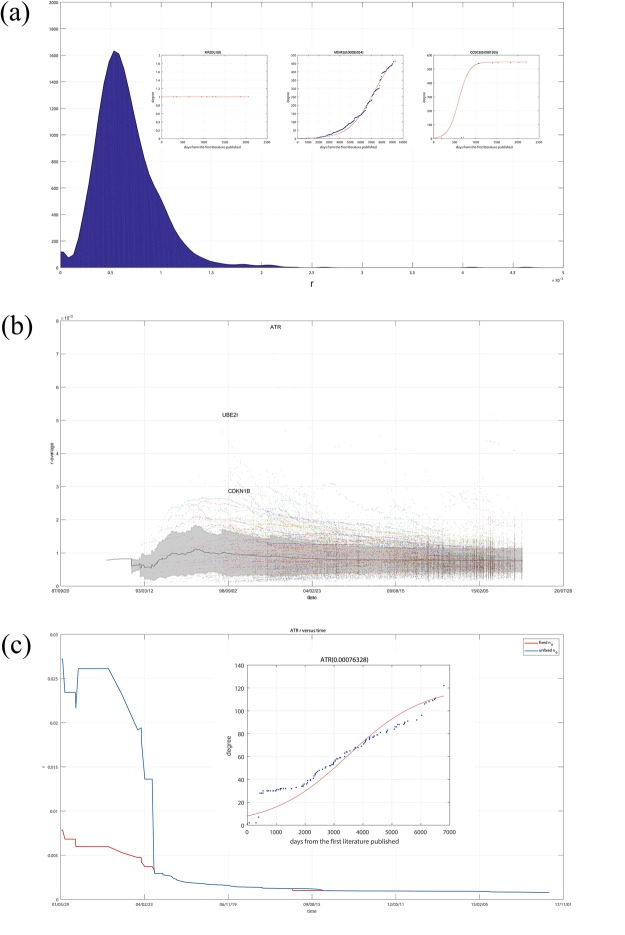
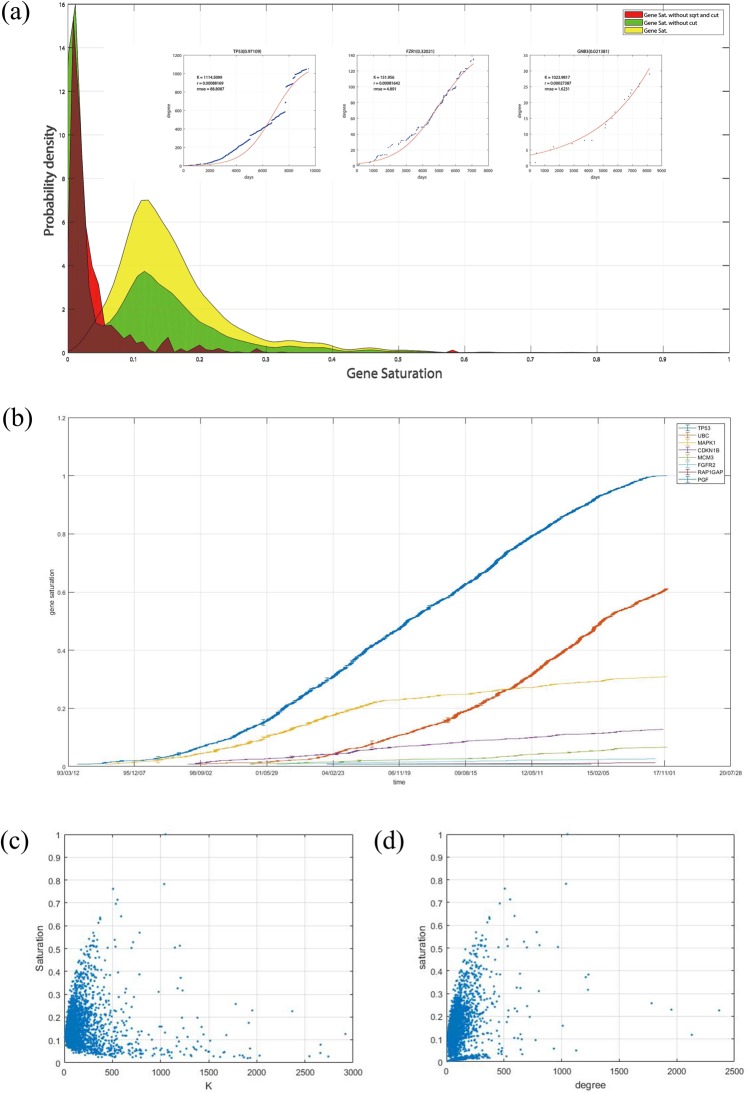
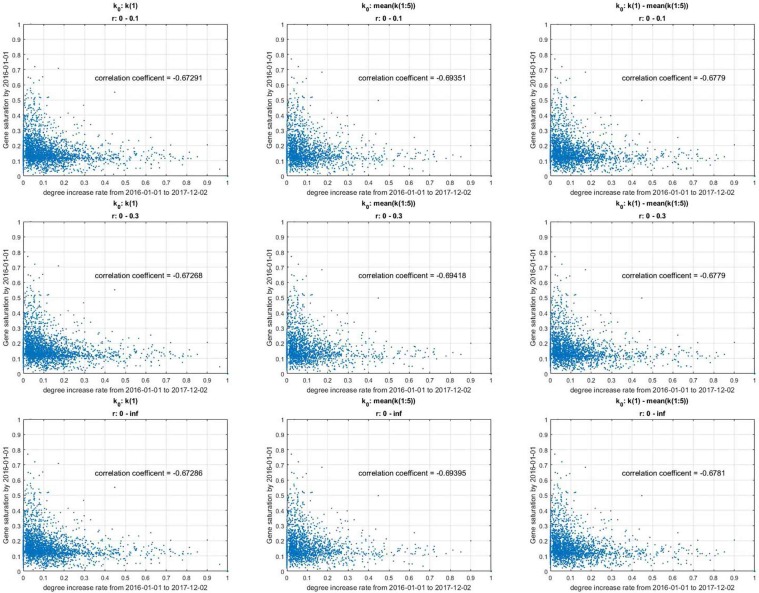
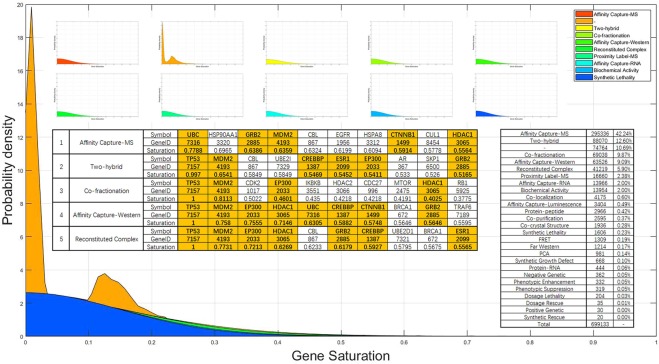
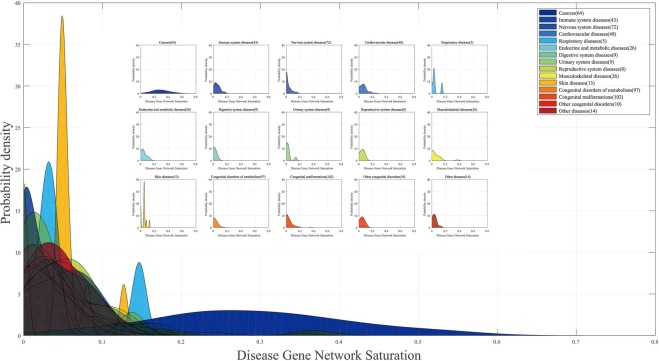
The gene interaction network is one of the most important biological networks and has been studied by many researchers. The gene interaction network provides information about whether the genes in the network can cause or heal diseases. As gene-gene interaction relations are constantly explored, gene interaction networks are evolving. To describe how much a gene has been studied, an approach based on a logistic model for each gene called gene saturation has been proposed, which in most cases, satisfies non-decreasing, correlation and robustness principles. The average saturation of a group of genes can be used to assess the network constructed by these genes. Saturation reflects the distance between known gene interaction networks and the real gene interaction network in a cell. Furthermore, the saturation values of 546 disease gene networks that belong to 15 categories of diseases have been calculated. The disease gene networks' saturation for cancer is significantly higher than that of all other diseases, which means that the disease gene networks' structure for cancer has been more deeply studied than other disease. Gene saturation provides guidance for selecting an experimental subject gene, which may have a large number of unknown interactions.


Conflict of interest statement

The authors declare no competing interests.

Figures

Figure 1
Figure 1
Networks of the 20 top genes of the number of related references. Changes in the interaction network of the 20 top genes of related references from 1992 to 2017. The time interval between the two adjacent pictures is 5 years.
Figure 2
Figure 2
(a) The relationship between the number of gene related studies and the degree of each gene in gcHGIN. The red line shows n = k, and the green line shows n = ak, where a is the average ratio of ni/ki of all the genes in gcHGIN. The value of a here is approximately 0.4244. (b) Radian distribution of all 17274 genes in gcHGIN. (c) Degree distribution of all genes with a ratio ni/ki = 1. The figure on the top right shows the increase in degree over time (DT increase curve) of the gene with the largest degree, MYOD1, among all these genes. (d) Degree-literature ratio versus date curve of the 20 top genes of the number of related studies.
Figure 3
Figure 3
(a) Number of studies of all the genes in gcHGIN. The figure on the top right shows the distribution of studies of all these genes. (b) DT increase curve of all the genes in gcHGIN. The figure on the top left presents a special example, TRIM25, for which almost all of its interaction data are obtained from one study.
Figure 4
Figure 4
DT curve and fDT curve of some example genes. Nine example genes are presented with their DT curves and fDT curves. The blue dots in each figure represent the fDT curve, and the red line is the corresponding fDT curve. The values of the fit parameters K and r and the root mean squared error are plotted on the top left.
Figure 5
Figure 5
(a) Distribution of r for all the genes in gcHGIN using 3 example genes’ DT and fDT curves with r values that range from small to large. (b) Distribution of all the genes’ r values versus time. The black line is the average r of all the genes in gcHGIN, and the grey area is the area of the average value plus or minus one times the standard deviation. Points with different colors represent r values of different genes, and points with the same color represent r values of the same gene different times. (c) DT curve, fDT curve and the r value over time for the ATR gene, which exhibits the widest range of r values among all the genes in gcHGIN.
Figure 6
Figure 6
(a) Distribution of three types of gene saturations with three example genes’ DT curves and fDT curves with different gene saturations. (b) Saturation value versus time of 8 random genes. (c) Correlation between a gene’s degree and saturation. (d) Correlation between a gene’s predicted interaction numbers in the RRN K and at saturation.
Figure 7
Figure 7
Correlation between gene saturation and the increasing degree in the near future with different ranges of fit parameters. The gene saturation value is calculated using data reported before 2016-01-01. The correlation coefficient is calculated based on gene saturation in 2016 and the increasing degree from 2016-01-01 to 2018-03-04. Each row represents results with the same range of r but a different initial value of k0, and each column presents results with the same initial value of k0 but a different range of r.
Figure 8
Figure 8
Gene saturation distribution of the top 10 interaction types. Gene saturation distribution of the top 10 types of interaction types. ‘−’ indicates interaction records without a clear label. The table in the figure shows the genes with the top saturation values for the top 5 interaction types. Bold genes with orange backgrounds are the genes with the top 10 gene saturation values in the network of all types of interactions. The table on the right of the figure shows the ratio of the number of different types of interactions to the total number.
Figure 9
Figure 9
Disease gene network saturation distribution of 15 categories of diseases. There are 546 diseases recorded by KEGG that have more than 3 disease genes. The disease gene network saturation distribution of these 546 diseases, which belong to 15 categories of diseases, is shown.

Similar articles

Cited by

References

    1. Robbins KC, Summaria L, Hsieh B, Shah RJ. The peptide chain of human plasmin. mechanism of activation of human plasminogen to plasmin. J. Biol. Chem. 1967;242:2333. - PubMed
    1. Jenssen TK, Laegreid A, Komorowski J, Hovig E. A literature network of human genes for high-throughput analysis of gene expression. Nat. Genet. 2001;28:21–28. - PubMed
    1. Karopka T, Scheel TS, Glass A. Automatic construction of gene relation networks using text mining and gene expression data. Med. Informatics. 2004;29:169–183. - PubMed
    1. Krallinger M, Leitner F, Rodriguezpenagos C, Valencia A. Overview of the protein-protein interaction annotation extraction task of biocreative ii. Genome Biol. 2008;9:1–19. doi: 10.1186/gb-2008-9-s2-s1. - DOI - PMC - PubMed
    1. Wiegers TC, Davis AP, Cohen KB, Hirschman L, Mattingly CJ. Text mining and manual curation of chemical-gene-disease networks for the comparative toxicogenomics database (ctd) Bmc Bioinforma. 2009;10:326–326. doi: 10.1186/1471-2105-10-326. - DOI - PMC - PubMed

Publication types