. 2019 Mar 21;9(1):5005.
doi: 10.1038/s41598-019-41453-1.

Clock advance and magnitude limitation through fault interaction: the case of the 2016 central Italy earthquake sequence

Affiliations

Clock advance and magnitude limitation through fault interaction: the case of the 2016 central Italy earthquake sequence

Nicola Alessandro Pino et al. Sci Rep. .

Abstract

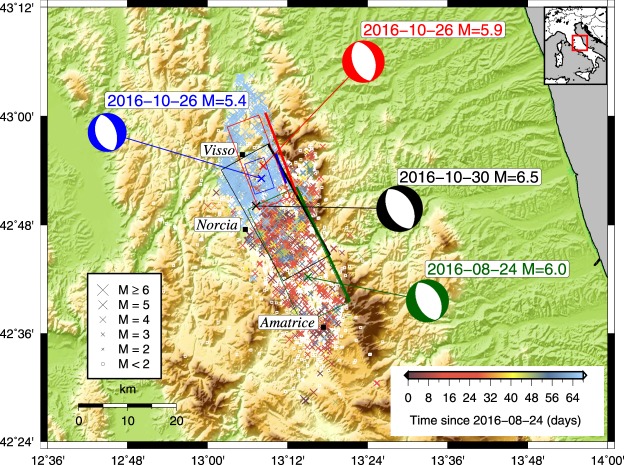
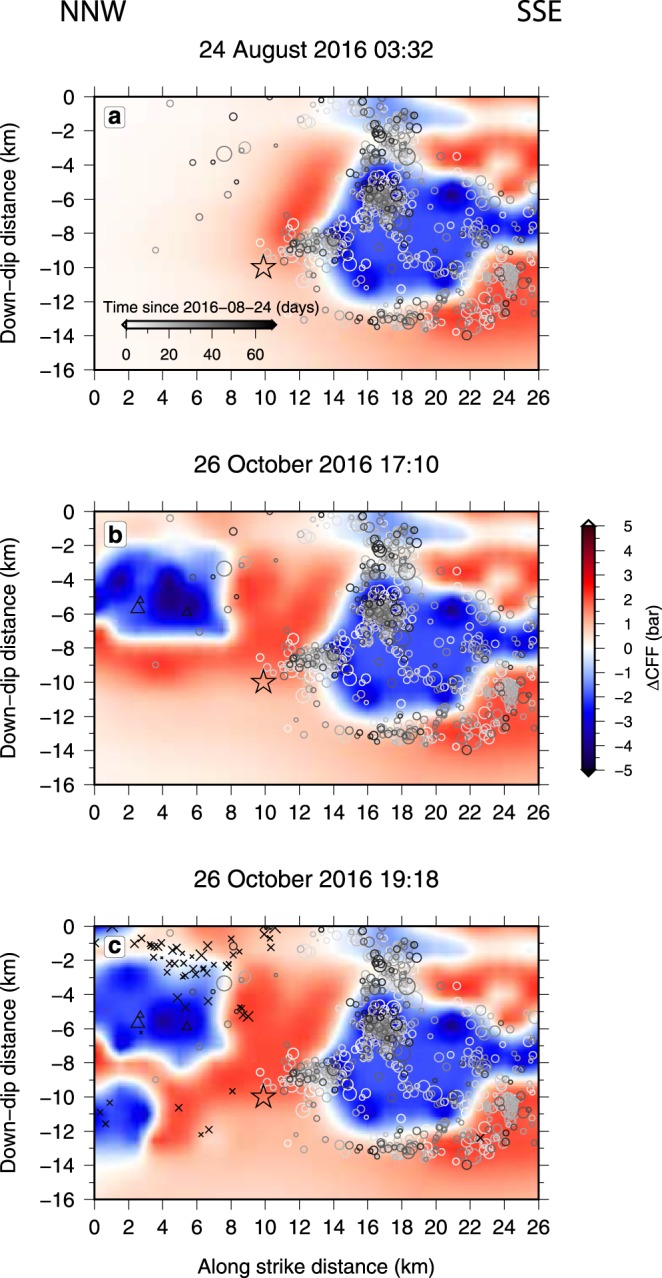
Faults communicate with each other. Strong earthquakes perturb stress over large volumes modifying the load on nearby faults and their resistance to slip. The causative fault induces permanent or transient perturbations that can change the time to the next seismic rupture with respect to that expected for a steadily accumulating stress. For a given fault, an increase of stress or a strength decrease would drive it closer to - or maybe even trigger - an earthquake. This is usually perceived as an undesired circumstance. However, with respect to the potential damage, a time advance might not necessarily be a bad thing. Here we show that the central Italy seismic sequence starting with the Amatrice earthquake on 24 August 2016 advanced the 30 October Norcia earthquake (MW = 6.5), but limited its magnitude by inhibiting the rupture on large portions of the fault plane. The preceding events hastened the mainshock and determined its features by shaping a patch of concentrated stress. During the Norcia earthquake, the coseismic slip remained substantially confined to this patch. Our results demonstrate that monitoring the seismicity with very dense networks and timely analyses can make it feasible to map rupture prone areas.


Conflict of interest statement

The authors declare no competing interests.

Figures

Figure 1
Figure 1
Seismicity map of the Amatrice seismic sequence. Epicentral location of the earthquakes occurring since 24 August 2016 to the time of the 30 October 2016, Norcia earthquake. The symbol colour and size change according to time of occurrence and magnitude (except for the M < 2 events, all displayed in white colour, and for the mainshocks to preserve clarity), respectively, while the analysed events are indicated by green, blue, red, and black crosses. The fault mechanisms (Supplementary Table 1) of the largest events are also displayed as beachballs, using the same colour as the location. The black rectangles represent the surface projection of the fault planes (P1 in Supplementary Table 1), as inferred from both the focal mechanisms and surface displacements,. For each plane, the intersection with the free surface is depicted by a thick line of the same colour.
Figure 2
Figure 2
Coulomb failure function change (ΔCFF) on the fault plane of the 30 October 2016, Norcia earthquake, caused by the 3 strongest preceding events in the Amatrice seismic sequence, together with the aftershocks distribution. (a) ΔCFF caused by the Amatrice 24 August 2016 event, along with the aftershocks (circles) occurring within 350 m (see Methods section) from the Norcia fault plane and up to 26 October 2016 17:10. Aftershocks are colour coded based on their origin time since 24 August 2016 (see time line in Fig. 2a). Positive and negative variations indicate respectively increased and decreased ΔCFF areas. (b) Same as (a), with the addition of the ΔCFF contribution of the 26 October 2016 17:10 and aftershocks (triangles) up to 26 October 19:18 UTC. The evident invariance of the ΔCFF in the southern half of the fault plane in the ~60 days time period indicates the negligible effect of viscous relaxation in the lower crust. (c) Same as (b), with the addition of the ΔCFF contribution of the 26 October 2016 19:18 UTC and aftershocks (crosses) up to 30 October 2016. In all the panels, the black empty star corresponds to the location of the Norcia event hypocenter (rupture nucleation).
Figure 3
Figure 3
Dislocation associated with rupture of the Norcia 30 October 2016 earthquake, (see Methods). The preceding seismicity since the 24 August 2016 Amatrice earthquake and occurring within 350 m (see Methods section) from the fault plane is also displayed. The colour code for time and symbols for aftershocks are the same as in Fig. 2. The foreshocks are distributed around the Norcia slip area – showing the “encircling maneuver” (ref.) leading to the breakage of the asperity – and are clustered in three main patches, with varying b-value representing a complex pattern of the differential stress, increasing down-dip and away from the asperity (Supplementary Fig. 2). The empty star corresponds to the location of the Norcia event hypocenter (rupture nucleation), while the arrow indicates the dominant direction of rupture propagation.

References

    1. Wells DL, Coppersmith KJ. New empirical relationships among magnitude, rupture length, rupture width, rupture area, and surface displacement. Bull. Seismol. Soc. Am. 1994;84:974–1002.
    1. Somerville P, et al. Characterizing crustal earthquake slip models for the prediction of strong ground motion. Seismol. Res. Lett. 1999;70:59–80. doi: 10.1785/gssrl.70.1.59. - DOI
    1. McGarr A, Fletcher JB. Maximum slip in earthquake fault zones, apparent stress, and stick-slip friction. Bull. Seismol. Soc. Am. 2003;93:2355–2362. doi: 10.1785/0120030037. - DOI
    1. King GCP, Stein RS, Lin J. Static stress changes and the triggering of earthquakes. Bull. Seismol. Soc. Am. 1994;84:935–953.
    1. Stein RS. The role of stress transfer in earthquake occurrence. Nature. 1999;402:605–609. doi: 10.1038/45144. - DOI