. 2019 Apr;37(4):451-460.
doi: 10.1038/s41587-019-0068-4. Epub 2019 Mar 21.

Characterization of cell fate probabilities in single-cell data with Palantir

Affiliations

Characterization of cell fate probabilities in single-cell data with Palantir

Manu Setty et al. Nat Biotechnol. 2019 Apr.

Erratum in

Abstract

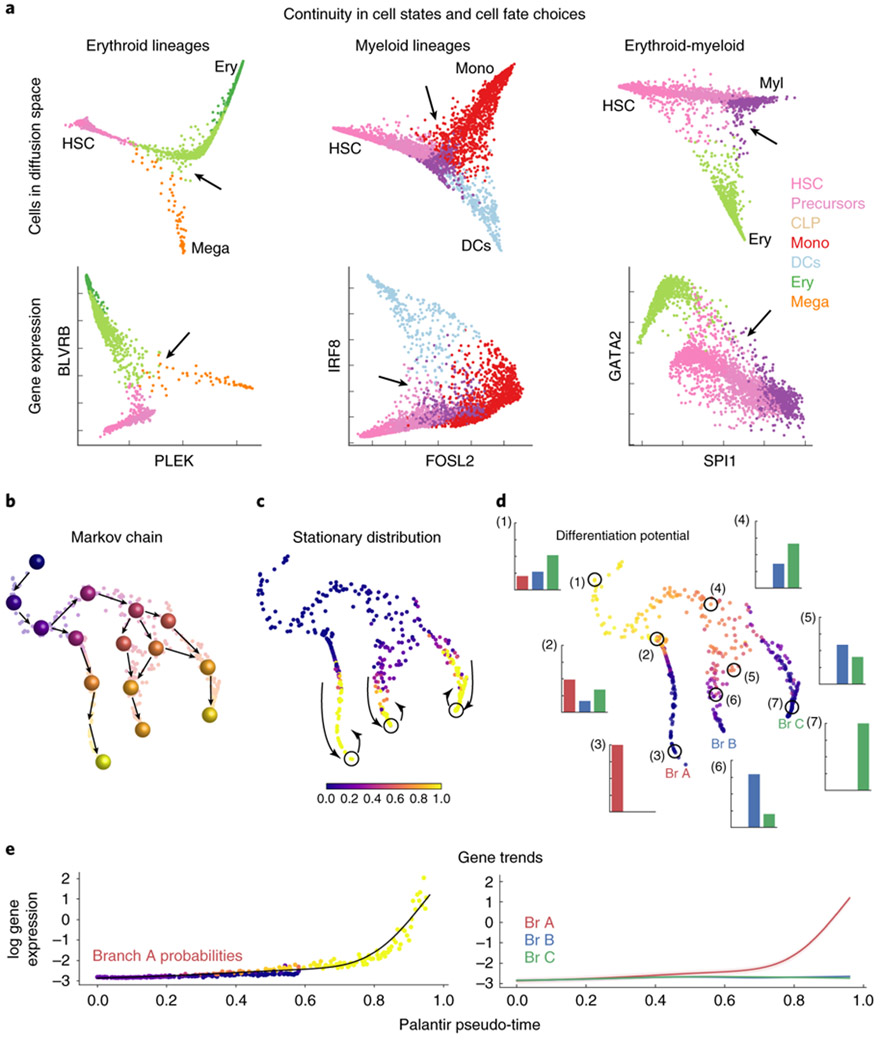
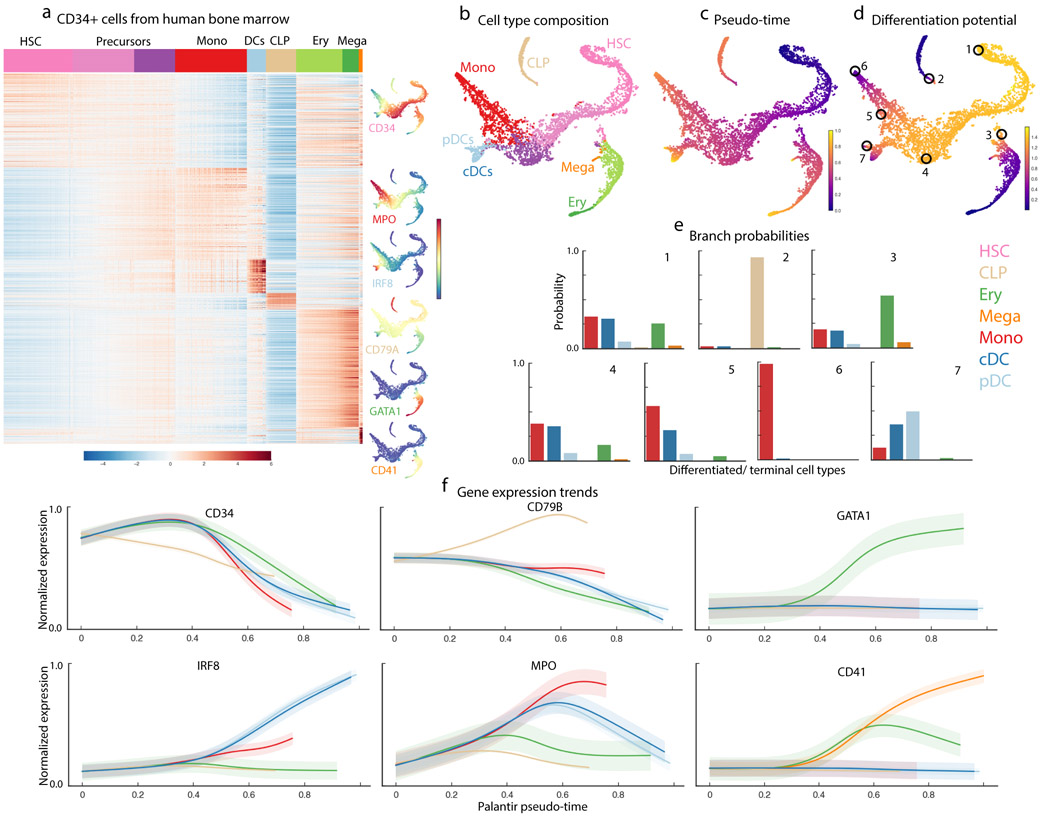
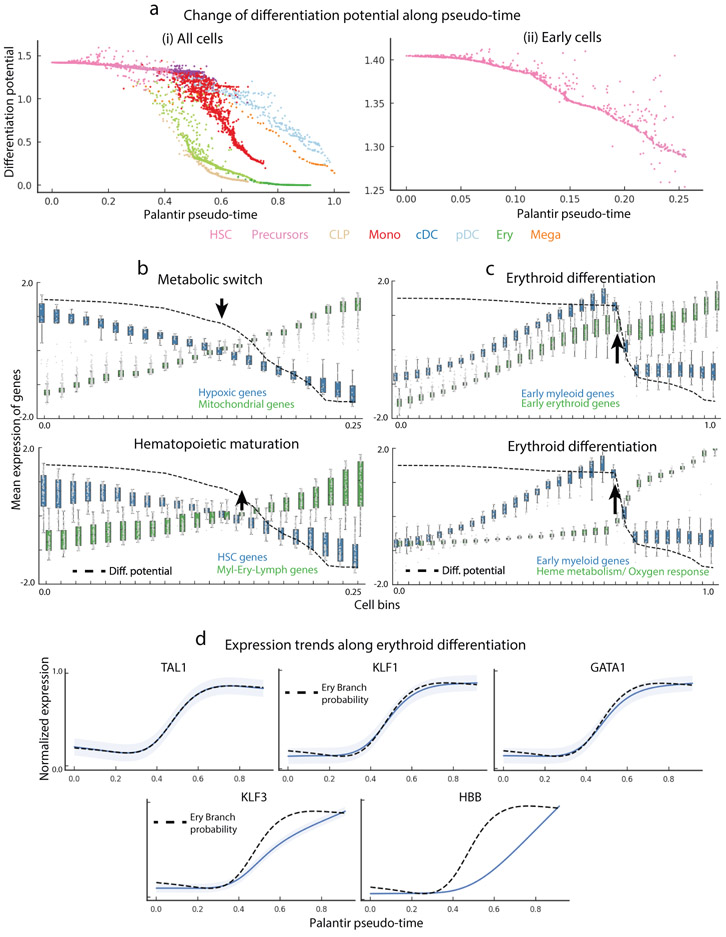
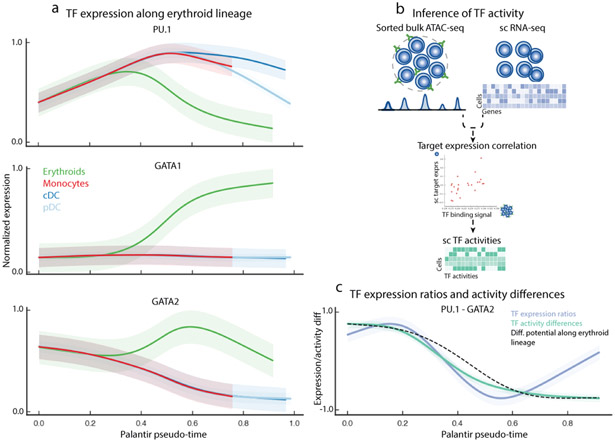
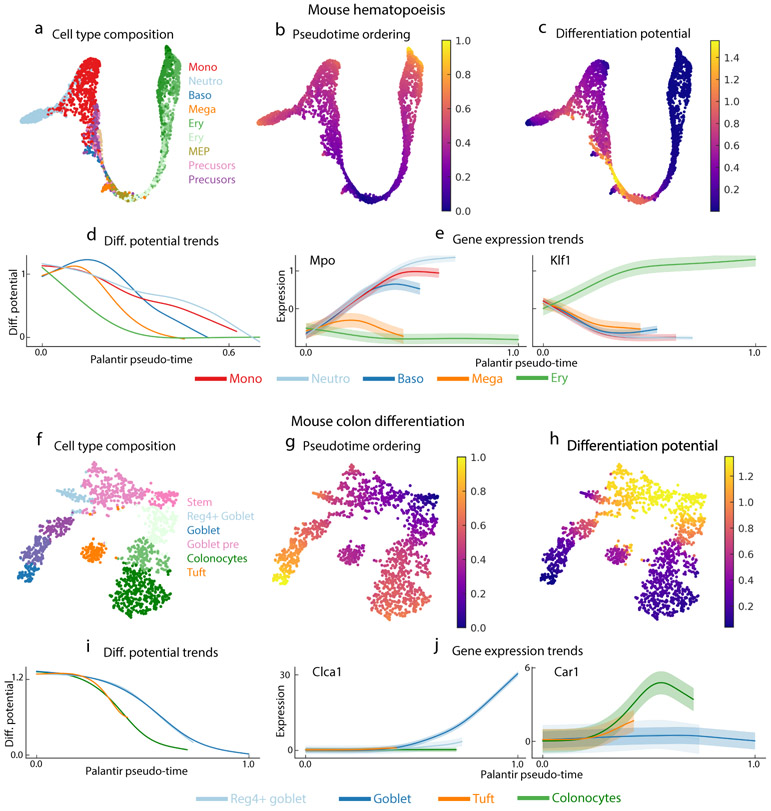
Single-cell RNA sequencing studies of differentiating systems have raised fundamental questions regarding the discrete versus continuous nature of both differentiation and cell fate. Here we present Palantir, an algorithm that models trajectories of differentiating cells by treating cell fate as a probabilistic process and leverages entropy to measure cell plasticity along the trajectory. Palantir generates a high-resolution pseudo-time ordering of cells and, for each cell state, assigns a probability of differentiating into each terminal state. We apply our algorithm to human bone marrow single-cell RNA sequencing data and detect important landmarks of hematopoietic differentiation. Palantir's resolution enables the identification of key transcription factors that drive lineage fate choice and closely track when cells lose plasticity. We show that Palantir outperforms existing algorithms in identifying cell lineages and recapitulating gene expression trends during differentiation, is generalizable to diverse tissue types, and is well-suited to resolving less-studied differentiating systems.


Figures

Figure 1.
Figure 1.
Palantir characterizes cell fate choices in a continuous model of differentiation. (a) Top: Projection of CD34+ human bone marrow cells along diffusion components. Bottom: Expression of gene pairs involved in lineage decisions for cells in the corresponding top panel. Cells colored by Phenograph cluster (Supplementary Fig. 4a); arrows highlight continuity in cell fate choices as a pervasive lack of well-defined branch points in decision-making regions. Plots show comparison of 3170, 4224 and 3510 cells respectively(b-d) Palantir phenotypic manifold for a subsampled dataset of CD34+ human hematopoiesis. Each dot represents a cell embedded into diffusion space based on the first 3 components and visualized using tSNE. (b) Cartoon of Markov chain construction over the manifold. Cells colored by pseudo-time. (c) Cells colored by the stationary distribution of the Markov chain in (b), demonstrating outliers (yellow) in the mature states. Outliers that are also boundary states (circles) are selected as terminal states. (d) Cells colored by differentiation potential. Highlighted examples (circles) show relationship between pseudo-time, differentiation potential and branch probabilities (histogram with bars colored by terminal state or branch, Br). High differentiation potential (1) decreases gradually as cells move towards commitment (2-3). Modeling cell fate choices as probabilities provides a representation of their continuity (4-7). (e) Expression of a branch A–specific gene along pseudo-time. Left: Each dot represents a cell colored by its probability of reaching terminus A. Black line, gene expression trend for this data. Right. Expression trends for the 3 lineages. The unified framework of pseudo-time and branch probabilities enable gene expression dynamics to be characterized across a common axis.
Figure 2.
Figure 2.
Differentiation landscape of early human hematopoiesis. Data shown for CD34+ human bone marrow cells, replicate 1. (a) MAGIC imputed expression of genes (rows) differentially expressed between PhenoGraph clusters (based on MAST). Cells (columns) are ordered by cluster; top row represents annotated cluster labels, with color coding scheme used in all figures. tSNE maps show cells colored by imputed expression of characteristic cell lineage markers. (b-d) tSNE maps of full scRNA-seq dataset generated using one HSC as a start cell. 5780 cells are shown on the tSNE maps.(b) Cells colored by cluster labels in (a), annotated by correlation with bulk sorted populations. (c) Cells colored by Palantir pseudo-time. (d) Cells colored by Palantir differentiation potential. (e) Branch probabilities of example cells circled in (d), highlighting early cells (1), lymphoid and erythroid lineages (2,3) and monocyte and DC lineages (4-7). Bars are colored by cell type as in (a). (f) Gene expression trends for characteristic lineage genes, plotted as in Supplementary Fig. 3.
Figure 3.
Figure 3.
Palantir differentiation potential identifies landmarks of hematopoietic differentiation. Data shown for CD34+ human bone marrow cells, replicate 1. (a) Differentiation potential along pseudo-time for all cells (left) or early cells (right) decreases as cells commit to lineages. Each dot represents a cell colored by cell type as in Fig. 2b and at bottom. (b) Mean expression of hypoxic and mitochondrial genes (top) and stem cell and mature lineage-specifying genes (bottom) in equal-sized bins along Palantir pseudo-time. Box plots show the mean expression and 1.5 std. Dotted black line, DP; arrow, point of maximal DP change, corresponding to crossover points in gene expression. (c) Mean expression of early myeloid and early erythroid genes (top), and early myeloid genes and genes involved in functional specification of erythroid function (bottom). Dotted black line, DP; arrow, point of maximal DP change, corresponding to point of higher erythroid gene expression. d) Gene expression trends (blue) of key erythroid TFs TAL1, KLF1 and GATA1 are the most correlated with erythroid branch probability (dotted black line). Gene expression of downstream regulators KLF3 and HBB is also shown. Shaded region represents 1 s.d.
Figure 4.
Figure 4.
Transcriptional regulation of erythroid differentiation. Data shown are for CD34+ human bone marrow cells, replicate 1 5708 cells). (a) Gene expression trends for PU.1, GATA1 and GATA2 in the myeloid and erythroid lineages. Trends are colored based on lineage, as in Fig. 2b. Shaded region represents 1 s.d. (b) Single-cell TF activity inference using scRNA-seq data and ATAC-seq data from bulk sorted populations. ATAC-seq data is used to identify cell-type-specific TF targets, and TF activity in each cell is inferred by measuring the correlation between predicted TF sequence affinity of the targets with their expression. (c) PU.1 / GATA2 expression ratio and PU.1 - GATA2 TF activity difference (colored trends) strongly correlate with DP (black) change along erythroid lineage. Shaded regions represent 1 s.d.
Figure 5.
Figure 5.
Palantir generalizes to mouse hematopoiesis and colon differentiation datasets. (a) tSNE map of mouse hematopoiesis data generated by scRNA-seq of sorted precursor populations lacking a well-defined stem cell population. Cell are colored by clusters generated in ref . 2700 cells are shown on the tSNE maps. (b,c) Palantir pseudo-time (b) and differentiation potential (c), generated after selecting an early cell for initiation. (d) DP trends along pseudo-time, highlighting the hierarchical nature of murine hematopoiesis (commitment towards erythroid lineage followed by commitment towards the myeloid lineages). Trends are colored by clusters as in Fig. 5a. (e) Expression trends of myeloid factor Mpo and erythroid factor Klf1 recapitulate expected behavior and are consistent with their dynamics in human hematopoiesis. (f) tSNE map of scRNA-seq dataset of epithelial enriched cells from the mouse colon. Cells are colored by Phenograph cluster. 1811 cells are shown on the tSNE maps. (g,h) Palantir pseudo-time (g) and DP (h) generated using an Lgr5+ stem cell as the start cell and manually setting the tuft cells as one of the terminal states. (i) DP trends recapitulate known hierarchy of lineage specification (colonocytes followed by goblet cell populations). Trends colored by cluster as in Fig. 5f. (j) Expression trends of Clca1 and Car1 across lineages.

Similar articles

Cited by

References

    1. Bendall SC et al. Single-cell trajectory detection uncovers progression and regulatory coordination in human B cell development. Cell 157, 714–725 (2014). - PMC - PubMed
    1. Setty M et al. Wishbone identifies bifurcating developmental trajectories from single-cell data. Nature biotechnology 34, 637–645 (2016). - PMC - PubMed
    1. Haghverdi L, Buttner M, Wolf FA, Buettner F & Theis FJ Diffusion pseudotime robustly reconstructs lineage branching. Nature methods 13, 845–848 (2016). - PubMed
    1. Velten L et al. Human haematopoietic stem cell lineage commitment is a continuous process. Nature cell biology 19, 271–281 (2017). - PMC - PubMed
    1. Buenrostro JD et al. Integrated Single-Cell Analysis Maps the Continuous Regulatory Landscape of Human Hematopoietic Differentiation. Cell 173, 1535–1548 e1516 (2018). - PMC - PubMed

Online Methods References

    1. Finak G et al. MAST: a flexible statistical framework for assessing transcriptional changes and characterizing heterogeneity in single-cell RNA sequencing data. Genome Biol 16, 278 (2015). - PMC - PubMed
    1. Klein AM et al. Droplet barcoding for single-cell transcriptomics applied to embryonic stem cells. Cell 161, 1187–1201 (2015). - PMC - PubMed
    1. Buettner F et al. Computational analysis of cell-to-cell heterogeneity in single-cell RNA-sequencing data reveals hidden subpopulations of cells. Nature biotechnology 33, 155–160 (2015). - PubMed
    1. Buettner F, Pratanwanich N, McCarthy DJ, Marioni JC & Stegle O f-scLVM: scalable and versatile factor analysis for single-cell RNA-seq. Genome Biol 18, 212 (2017). - PMC - PubMed
    1. van der Maaten LPJ & Hinton GE Visualizing High-Dimensional Data Using t-SNE. Journal of Machine Learning Researc 9, 2579–2605 (2008).

Publication types