

Remaking White Residential Segregation: Metropolitan Diversity and Neighborhood Change in the United States
- PMID: 30899128
- PMCID: PMC6424505
- DOI: 10.1080/02723638.2017.1360039
Remaking White Residential Segregation: Metropolitan Diversity and Neighborhood Change in the United States
Abstract
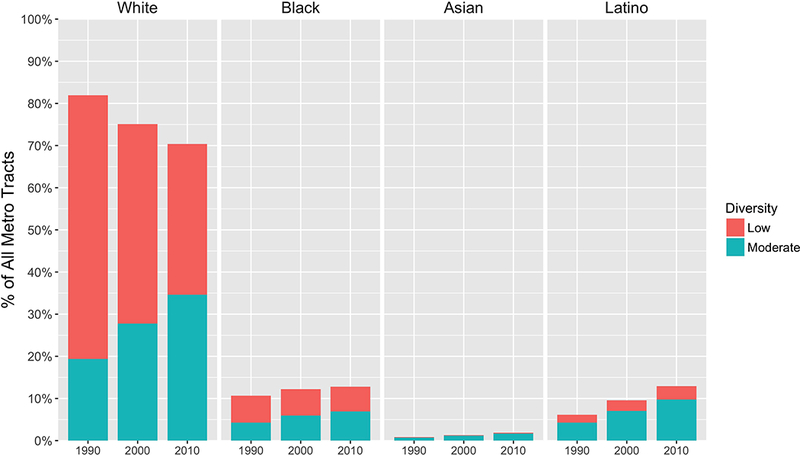
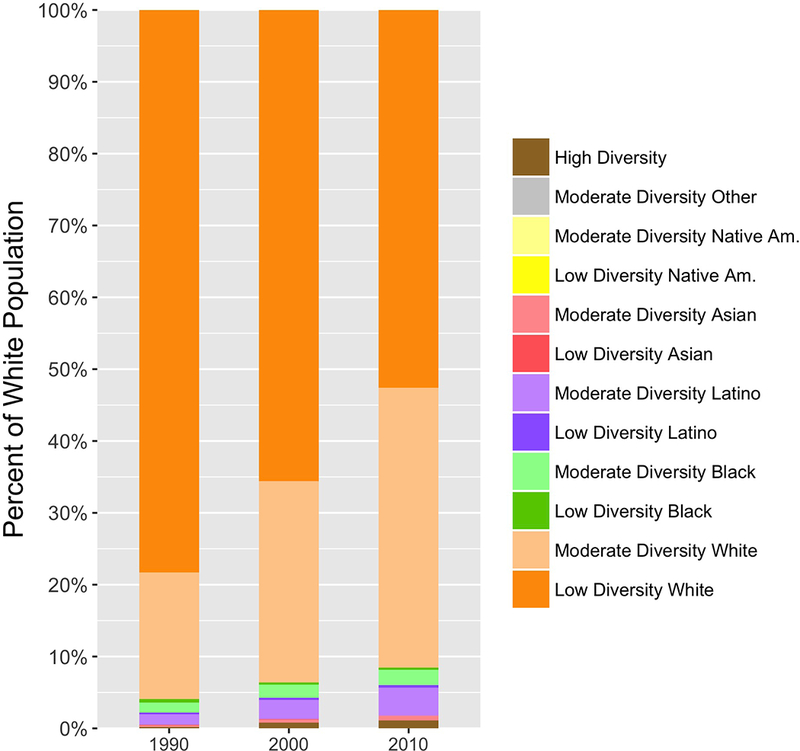
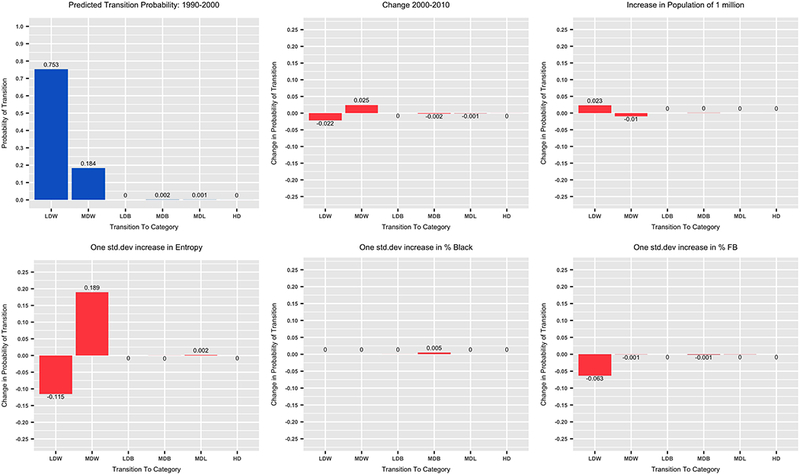
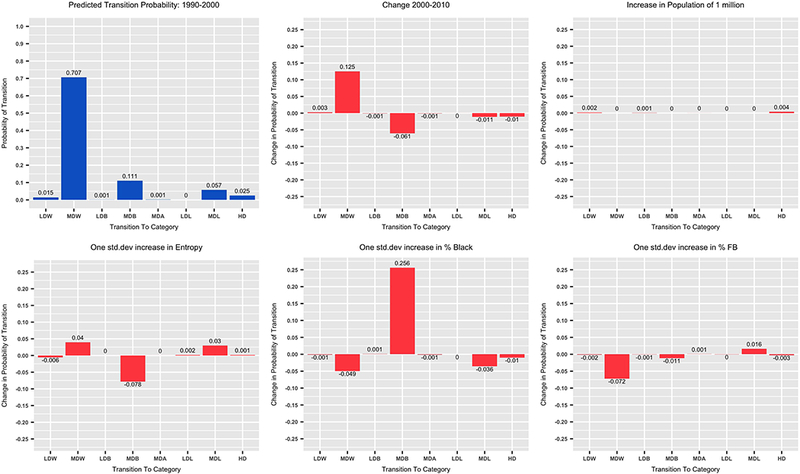
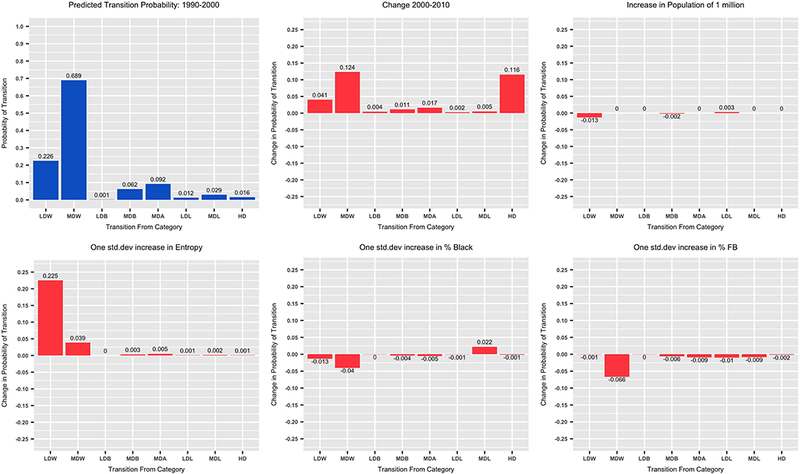
Between 1990 and 2010, the white population share in US metropolitan areas fell from 73.5 percent to 60.3 percent. This paper explores how this decline affected the number and composition of white census tracts (tracts in which non-Latino whites constitute the largest group). In 1990, white tracts comprised 82 percent of all metropolitan tracts. By 2010, this percentage had fallen to 70 percent, paralleling the percentage point drop in white population share. This loss was concentrated among the most segregated white tracts - those with low diversity. White tracts that were moderately diverse actually doubled in number between 1990 and 2010 although this increase was insufficient to cancel the loss of low diversity white tracts. We model the effects of metropolitan characteristics on white-tract change by metropolitan area. Greater metropolitan-scale diversity increases the probability that low-diversity white tracts transition to moderate-diversity white. Moderately diverse white tracts, however, become more stable with increased diversity. A large metropolitan percentage of blacks or the foreign born, however, reverses this stabilizing effect, increasing the probability that moderately diverse white tracts transition to non-white tracts (i.e. where a non-white group is the largest group). Thus the level and composition of metropolitan diversity matters for the trajectory of moderately diverse white tracts. Overall, the formation of new white tracts, possibly the result of gentrification, coupled with the emergence of moderately diverse white tracts and an increasing share of whites living in such residential environments, suggests a reconfiguration rather than a dissolving of white dominated neighborhood space in response to increased diversity in surrounding metropolitan contexts.
Keywords: diversity; gentrification; neighborhood change; segregation; whites.
Figures
Similar articles
-
The Instability of Highly Racially Diverse Residential Neighborhoods in the United States.Sociol Race Ethn (Thousand Oaks). 2020 Jul 1;6(3):365-381. doi: 10.1177/2332649218819168. Epub 2018 Dec 21. Sociol Race Ethn (Thousand Oaks). 2020. PMID: 34621917 Free PMC article.
-
Predicting neighborhood racial change in large US metropolitan areas, 1990-2010.Environ Plan B Urban Anal City Sci. 2018 Nov;45(6):1022-1037. doi: 10.1177/2399808317744558. Epub 2017 Dec 8. Environ Plan B Urban Anal City Sci. 2018. PMID: 32478176 Free PMC article.
-
Metropolitan Heterogeneity and Minority Neighborhood Attainment: Spatial Assimilation or Place Stratification?Soc Probl. 2012 May;59(2):258-281. doi: 10.1525/sp.2012.59.2.258. Soc Probl. 2012. PMID: 22639470 Free PMC article.
-
From Census Tracts to Local Environments: An Egocentric Approach to Neighborhood Racial Change.Spat Demogr. 2019 Apr;7(1):1-26. doi: 10.1007/s40980-018-0044-5. Epub 2018 Jun 18. Spat Demogr. 2019. PMID: 31223641 Free PMC article.
-
Still Large, but Narrowing: The Sizable Decline in Racial Neighborhood Inequality in Metropolitan America, 1980-2010.Demography. 2016 Feb;53(1):139-64. doi: 10.1007/s13524-015-0447-5. Demography. 2016. PMID: 26685905 Free PMC article.
Cited by
-
The Instability of Highly Racially Diverse Residential Neighborhoods in the United States.Sociol Race Ethn (Thousand Oaks). 2020 Jul 1;6(3):365-381. doi: 10.1177/2332649218819168. Epub 2018 Dec 21. Sociol Race Ethn (Thousand Oaks). 2020. PMID: 34621917 Free PMC article.
-
Segregation and the pandemic: The dynamics of daytime social diversity during COVID-19 in Greater Stockholm.Appl Geogr. 2023 May;154:102926. doi: 10.1016/j.apgeog.2023.102926. Epub 2023 Mar 10. Appl Geogr. 2023. PMID: 36999002 Free PMC article.
-
Millennials as a Demographic Bridge to Diversity? Segregation and Diversity of Young Adult Neighborhoods.Popul Res Policy Rev. 2025;44(3):32. doi: 10.1007/s11113-025-09954-2. Epub 2025 May 12. Popul Res Policy Rev. 2025. PMID: 40370488 Free PMC article.
-
Social Equity and COVID-19: The Case of African Americans.Public Adm Rev. 2020 Sep-Oct;80(5):820-826. doi: 10.1111/puar.13251. Epub 2020 Aug 7. Public Adm Rev. 2020. PMID: 32836453 Free PMC article.
-
The evolution and stability of multi-ethnic residential neighbourhoods in England.Trans Inst Br Geogr. 2021 Jun;46(2):330-346. doi: 10.1111/tran.12416. Epub 2020 Sep 29. Trans Inst Br Geogr. 2021. PMID: 34354298 Free PMC article.
References
-
- Allen James P, & Eugene Turner. (2005). Ethnic Residential Concentrations in United States Metropolitan Areas. Geographical Review, 95 (2), 267–285.
-
- Bader Michael, & Warkentien Siri. (2016). The Fragmented Evolution of Racial Integration since the Civil Rights Movement. Sociological Science, 3, 135–164.
-
- Bean Frank D, & Gillian Stevens. (2003). America’s Newcomers and the Dynamics of Diversity. Russell Sage Foundation.
-
- Blalock Hubert M. (1957). Per Cent Non-White and Discrimination in the South. American Sociological Review, 22 (6), 677–682.
-
- Bråmå Åsa. (2006). “White Flight”? The Production and Reproduction of Immigrant Concentration Areas in Swedish Cities, 1990–2000. Urban Studies, 43 (7), 1127–1146.
Grants and funding
LinkOut - more resources
Full Text Sources